

Paper Menu >>
Journal Menu >>
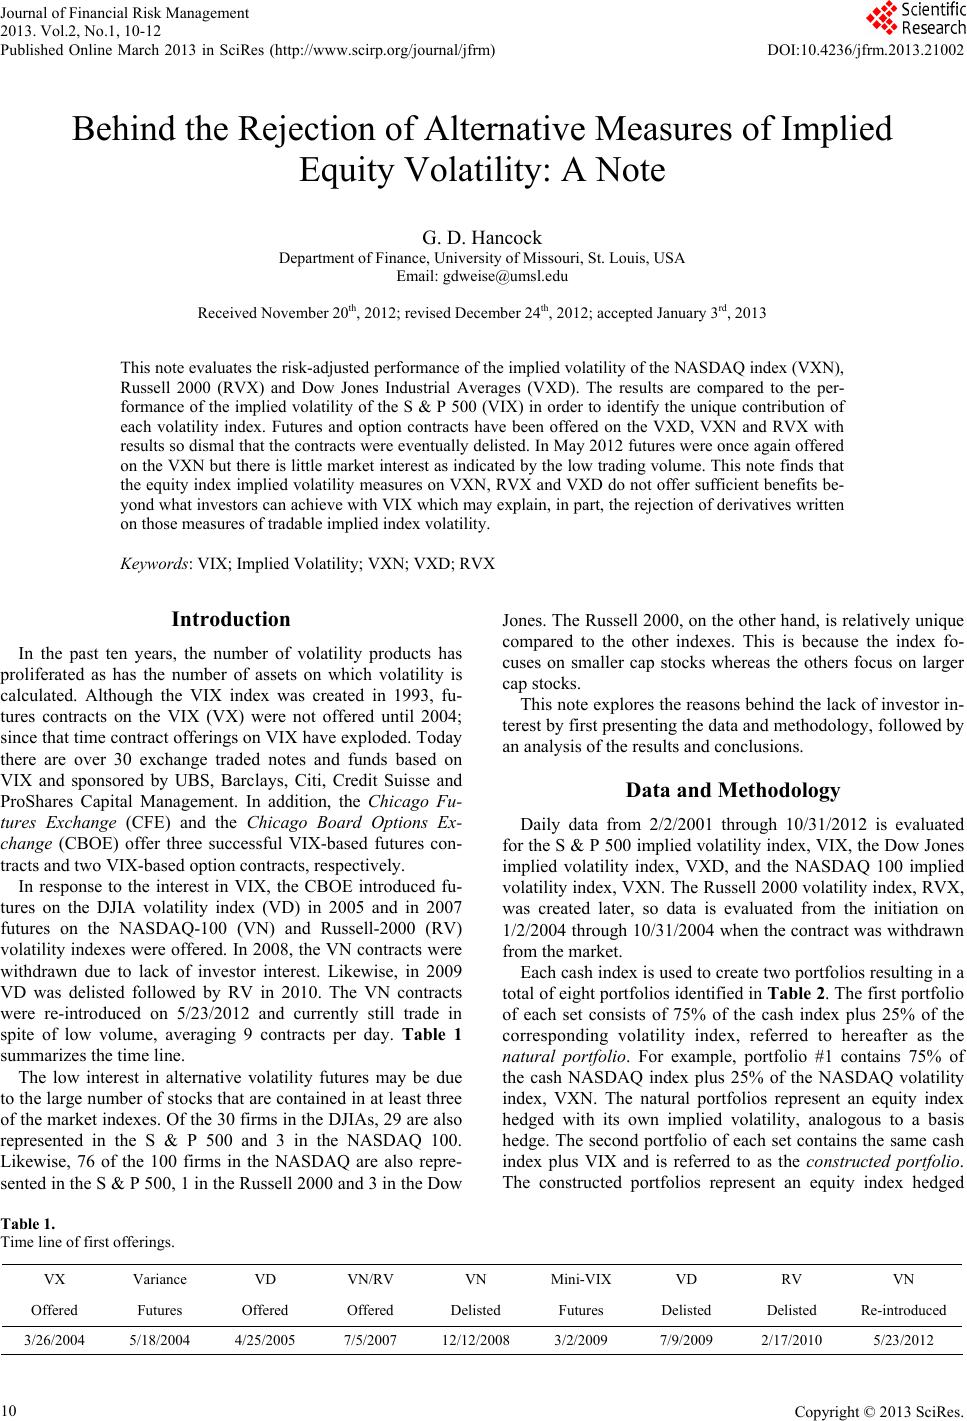 Journal of Financial Risk Management 2013. Vol.2, No.1, 10-12 Published Online March 2013 in SciRes (http://www.scirp.org/journal/jfrm) DOI:10.4236/jfrm.2013.21002 Behind the Rejection of Alternative Measures of Implied Equity Volatility: A Note G. D. Hancock Department of Finance, University of Missouri, St. Louis, USA Email: [email protected] Received November 20th, 2012; revised December 24th, 2012; accepted January 3rd, 2013 This note evaluates the risk-adjusted performance of the implied volatility of the NASDAQ index (VXN), Russell 2000 (RVX) and Dow Jones Industrial Averages (VXD). The results are compared to the per- formance of the implied volatility of the S & P 500 (VIX) in order to identify the unique contribution of each volatility index. Futures and option contracts have been offered on the VXD, VXN and RVX with results so dismal that the contracts were eventually delisted. In May 2012 futures were once again offered on the VXN but there is little market interest as indicated by the low trading volume. This note finds that the equity index implied volatility measures on VXN, RVX and VXD do not offer sufficient benefits be- yond what investors can achieve with VIX which may explain, in part, the rejection of derivatives written on those measures of tradable implied index volatility. Keywords: VIX; Implied Volatility; VXN; VXD; RVX Introduction In the past ten years, the number of volatility products has proliferated as has the number of assets on which volatility is calculated. Although the VIX index was created in 1993, fu- tures contracts on the VIX (VX) were not offered until 2004; since that time contract offerings on VIX have exploded. Today there are over 30 exchange traded notes and funds based on VIX and sponsored by UBS, Barclays, Citi, Credit Suisse and ProShares Capital Management. In addition, the Chicago Fu- tures Exchange (CFE) and the Chicago Board Options Ex- change (CBOE) offer three successful VIX-based futures con- tracts and two VIX-based option contracts, respectively. In response to the interest in VIX, the CBOE introduced fu- tures on the DJIA volatility index (VD) in 2005 and in 2007 futures on the NASDAQ-100 (VN) and Russell-2000 (RV) volatility indexes were offered. In 2008, the VN contracts were withdrawn due to lack of investor interest. Likewise, in 2009 VD was delisted followed by RV in 2010. The VN contracts were re-introduced on 5/23/2012 and currently still trade in spite of low volume, averaging 9 contracts per day. Table 1 summarizes the time line. The low interest in alternative volatility futures may be due to the large number of stocks that are contained in at least three of the market indexes. Of the 30 firms in the DJIAs, 29 are also represented in the S & P 500 and 3 in the NASDAQ 100. Likewise, 76 of the 100 firms in the NASDAQ are also repre- sented in the S & P 500, 1 in the Russell 2000 and 3 in the Dow Jones. The Russell 2000, on the other hand, is relatively unique compared to the other indexes. This is because the index fo- cuses on smaller cap stocks whereas the others focus on larger cap stocks. This note explores the reasons behind the lack of investor in- terest by first presenting the data and methodology, followed by an analysis of the results and conclusions. Data and Methodology Daily data from 2/2/2001 through 10/31/2012 is evaluated for the S & P 500 implied volatility index, VIX, the Dow Jones implied volatility index, VXD, and the NASDAQ 100 implied volatility index, VXN. The Russell 2000 volatility index, RVX, was created later, so data is evaluated from the initiation on 1/2/2004 through 10/31/2004 when the contract was withdrawn from the market. Each cash index is used to create two portfolios resulting in a total of eight portfolios identified in Table 2. The first portfolio of each set consists of 75% of the cash index plus 25% of the corresponding volatility index, referred to hereafter as the natural portfolio. For example, portfolio #1 contains 75% of the cash NASDAQ index plus 25% of the NASDAQ volatility index, VXN. The natural portfolios represent an equity index hedged with its own implied volatility, analogous to a basis hedge. The second portfolio of each set contains the same cash index plus VIX and is referred to as the constructed portfolio. he constructed portfolios represent an equity index hedged T Table 1. Time line of first offerings. VX Variance VD VN/RV VN Mini-VIX VD RV VN Offered Futures Offered Offered Delisted Futures Delisted Delisted Re-introduced 3/26/2004 5/18/2004 4/25/2005 7/5/2007 12/12/2008 3/2/2009 7/9/2009 2/17/2010 5/23/2012 Copyright © 2013 SciRes. 10 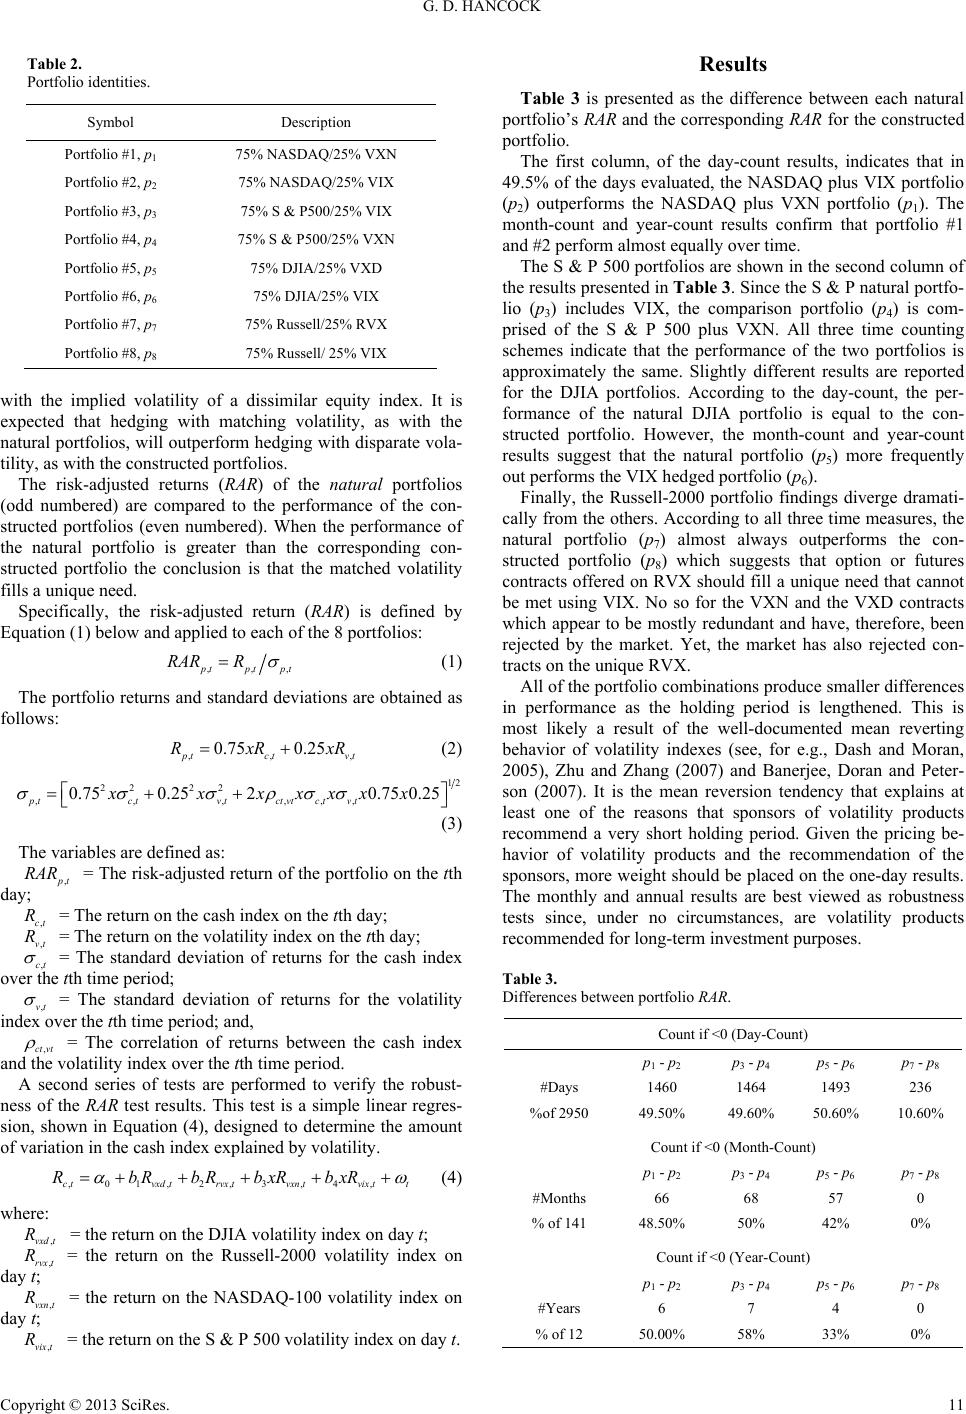 G. D. HANCOCK Table 2. Portfolio identities. Symbol Description Portfolio #1, p1 75% NASDAQ/25% VXN Portfolio #2, p2 75% NASDAQ/25% VIX Portfolio #3, p3 75% S & P500/25% VIX Portfolio #4, p4 75% S & P500/25% VXN Portfolio #5, p5 75% DJIA/25% VXD Portfolio #6, p6 75% DJIA/25% VIX Portfolio #7, p7 75% Russell/25% RVX Portfolio #8, p8 75% Russell/ 25% VIX with the implied volatility of a dissimilar equity index. It is expected that hedging with matching volatility, as with the natural portfolios, will outperform hedging with disparate vola- tility, as with the constructed portfolios. The risk-adjusted returns (RAR) of the natural portfolios (odd numbered) are compared to the performance of the con- structed portfolios (even numbered). When the performance of the natural portfolio is greater than the corresponding con- structed portfolio the conclusion is that the matched volatility fills a unique need. Specifically, the risk-adjusted return (RAR) is defined by Equation (1) below and applied to each of the 8 portfolios: ,,, p tptp RAR Rt (1) The portfolio returns and standard deviations are obtained as follows: ,, 0.750.25 , p tctvt R xR xR (2) 12 22 22 ,,,,,, 0.750.2520.75 0.25 ptctvtctvt ct vt xxxxxxx (3) The variables are defined as: , p t R AR = The risk-adjusted return of the portfolio on the tth day; ,ct R = The return on the cash index on the tth day; ,vt R = The return on the volatility index on the tth day; ,ct = The standard deviation of returns for the cash index over the tth time period; ,vt = The standard deviation of returns for the volatility index over the tth time period; and, ,ctvt = The correlation of returns between the cash index and the volatility index over the tth time period. A second series of tests are performed to verify the robust- ness of the RAR test results. This test is a simple linear regres- sion, shown in Equation (4), designed to determine the amount of variation in the cash index explained by volatility. ,01,2,3,4,c tvxdtrvx tvxn tvix tt RbRbRbxRbxR (4) where: ,vxd t R = the return on the DJIA volatility index on day t; ,rvxt R = the return on the Russell-2000 volatility index on day t; ,vxn t R = the return on the NASDAQ-100 volatility index on day t; ,vix t R = the return on the S & P 500 volatility index on day t. Results Table 3 is presented as the difference between each natural portfolio’s RAR and the corresponding RAR for the constructed portfolio. The first column, of the day-count results, indicates that in 49.5% of the days evaluated, the NASDAQ plus VIX portfolio (p2) outperforms the NASDAQ plus VXN portfolio (p1). The month-count and year-count results confirm that portfolio #1 and #2 perform almost equally over time. The S & P 500 portfolios are shown in the second column of the results presented in Table 3. Since the S & P natural portfo- lio (p3) includes VIX, the comparison portfolio (p4) is com- prised of the S & P 500 plus VXN. All three time counting schemes indicate that the performance of the two portfolios is approximately the same. Slightly different results are reported for the DJIA portfolios. According to the day-count, the per- formance of the natural DJIA portfolio is equal to the con- structed portfolio. However, the month-count and year-count results suggest that the natural portfolio (p5) more frequently out performs the VIX hedged portfolio (p6). Finally, the Russell-2000 portfolio findings diverge dramati- cally from the others. According to all three time measures, the natural portfolio (p7) almost always outperforms the con- structed portfolio (p8) which suggests that option or futures contracts offered on RVX should fill a unique need that cannot be met using VIX. No so for the VXN and the VXD contracts which appear to be mostly redundant and have, therefore, been rejected by the market. Yet, the market has also rejected con- tracts on the unique RVX. All of the portfolio combinations produce smaller differences in performance as the holding period is lengthened. This is most likely a result of the well-documented mean reverting behavior of volatility indexes (see, for e.g., Dash and Moran, 2005), Zhu and Zhang (2007) and Banerjee, Doran and Peter- son (2007). It is the mean reversion tendency that explains at least one of the reasons that sponsors of volatility products recommend a very short holding period. Given the pricing be- havior of volatility products and the recommendation of the sponsors, more weight should be placed on the one-day results. The monthly and annual results are best viewed as robustness tests since, under no circumstances, are volatility products recommended for long-term investment purposes. Table 3. Differences between portfolio RAR. Count if <0 (Day-Count) p1 - p2 p3 - p4 p5 - p6 p7 - p8 #Days 1460 1464 1493 236 %of 2950 49.50% 49.60% 50.60% 10.60% Count if <0 (Month-Count) p1 - p2 p3 - p4 p5 - p6 p7 - p8 #Months 66 68 57 0 % of 141 48.50% 50% 42% 0% Count if <0 (Year-Count) p1 - p2 p3 - p4 p5 - p6 p7 - p8 #Years 6 7 4 0 % of 12 50.00% 58% 33% 0% Copyright © 2013 SciRes. 11 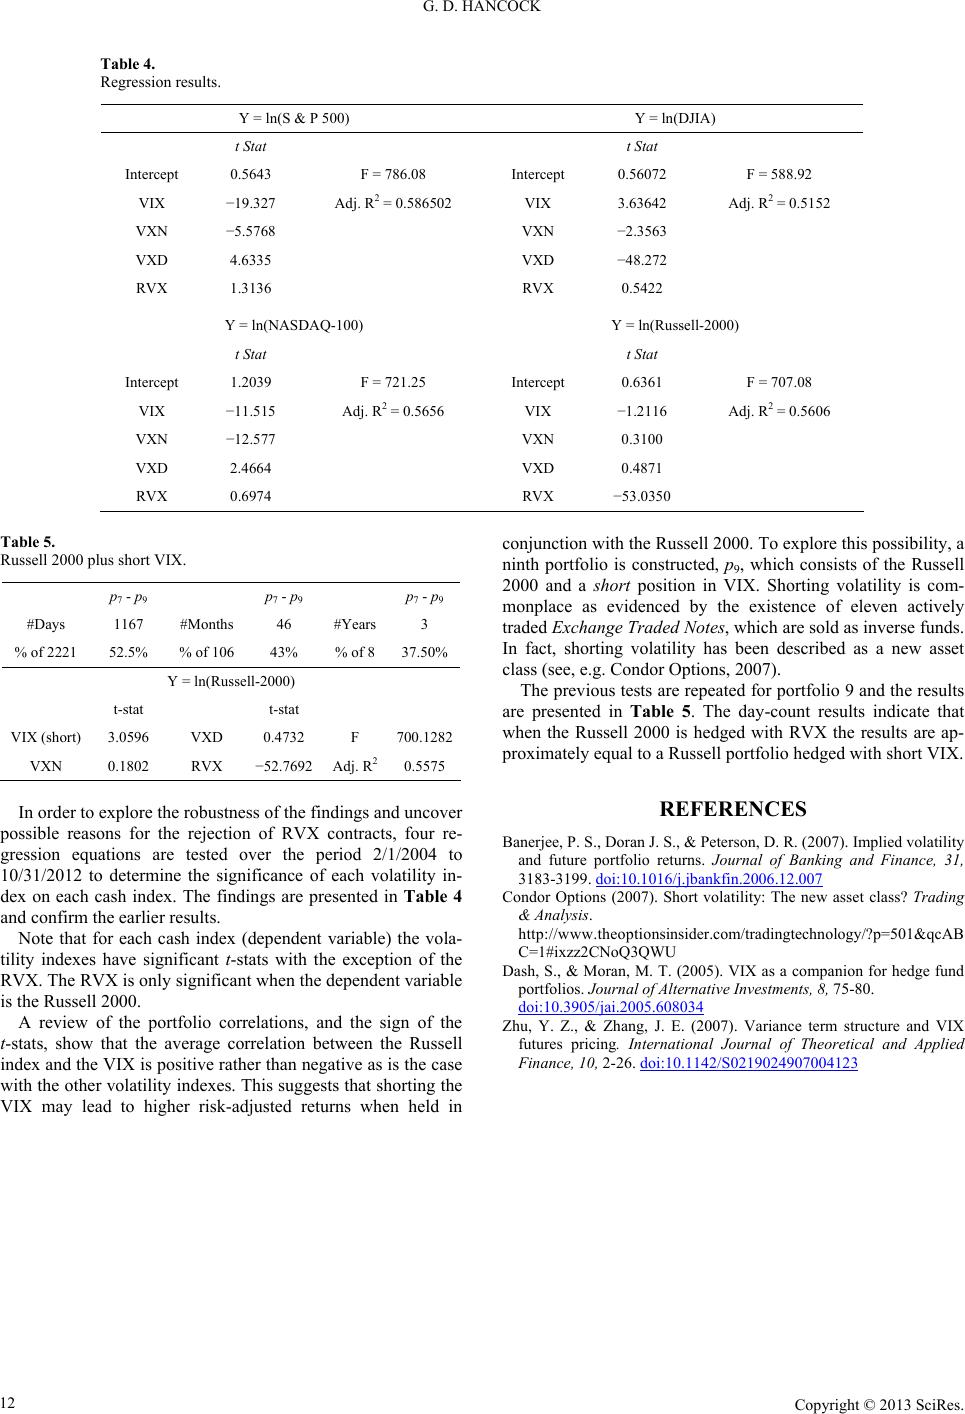 G. D. HANCOCK Table 4. Regression results. Y = ln(S & P 500) Y = ln(DJIA) t S tat t Stat Intercept 0.5643 F = 786.08 Intercept 0.56072 F = 588.92 VIX −19.327 Adj. R2 = 0.586502 VIX 3.63642 Adj. R2 = 0.5152 VXN −5.5768 VXN −2.3563 VXD 4.6335 VXD −48.272 RVX 1.3136 RVX 0.5422 Y = ln(NASDAQ-100) Y = ln(Russell-2000) t S tat t Stat Intercept 1.2039 F = 721.25 Intercept 0.6361 F = 707.08 VIX −11.515 Adj. R2 = 0.5656 VIX −1.2116 Adj. R2 = 0.5606 VXN −12.577 VXN 0.3100 VXD 2.4664 VXD 0.4871 RVX 0.6974 RVX −53.0350 Table 5. Russell 2000 plus short VIX. p7 - p9 p7 - p9 p7 - p9 #Days 1167 #Months 46 #Years 3 % of 2221 52.5% % of 106 43% % of 8 37.50% Y = ln(Russell-2000) t-stat t-stat VIX (short) 3.0596 VXD 0.4732 F 700.1282 VXN 0.1802 RVX −52.7692 Adj. R2 0.5575 In order to explore the robustness of the findings and uncover possible reasons for the rejection of RVX contracts, four re- gression equations are tested over the period 2/1/2004 to 10/31/2012 to determine the significance of each volatility in- dex on each cash index. The findings are presented in Table 4 and confirm the earlier results. Note that for each cash index (dependent variable) the vola- tility indexes have significant t-stats with the exception of the RVX. The RVX is only significant when the dependent variable is the Russell 2000. A review of the portfolio correlations, and the sign of the t-stats, show that the average correlation between the Russell index and the VIX is positive rather than negative as is the case with the other volatility indexes. This suggests that shorting the VIX may lead to higher risk-adjusted returns when held in conjunction with the Russell 2000. To explore this possibility, a ninth portfolio is constructed, p9, which consists of the Russell 2000 and a short position in VIX. Shorting volatility is com- monplace as evidenced by the existence of eleven actively traded Exchange Traded Notes, which are sold as inverse funds. In fact, shorting volatility has been described as a new asset class (see, e.g. Condor Options, 2007). The previous tests are repeated for portfolio 9 and the results are presented in Table 5. The day-count results indicate that when the Russell 2000 is hedged with RVX the results are ap- proximately equal to a Russell portfolio hedged with short VIX. REFERENCES Banerjee, P. S., Doran J. S., & Peterson, D. R. (2007). Implied volatility and future portfolio returns. Journal of Banking and Finance, 31, 3183-3199. doi:10.1016/j.jbankfin.2006.12.007 Condor Options (2007). Short volatility: The new asset class? Trading & Analysis. http://www.theoptionsinsider.com/tradingtechnology/?p=501&qcAB C=1#ixzz2CNoQ3QWU Dash, S., & Moran, M. T. (2005). VIX as a companion for hedge fund portfolios. Journal o f Alternative Investments, 8, 75-80. doi:10.3905/jai.2005.608034 Zhu, Y. Z., & Zhang, J. E. (2007). Variance term structure and VIX futures pricing. International Journal of Theoretical and Applied Finance, 10, 2-26. doi:10.1142/S0219024907004123 Copyright © 2013 SciRes. 12 |