

Paper Menu >>
Journal Menu >>
 Advances in Computed Tomography, 2013, 2, 34-40 http://dx.doi.org/10.4236/act.2013.21007 Published Online March 2013 (http://www.scirp.org/journal/act) Multi-Detector-Row CT Diagnosis of Adre nal Incidentaloma in Patients with Hepatocellular Carc inoma Taisuke Harada1, Tamotsu Kamishima2, Satoshi Terae1, Yuya Onodera3, Hiroki Shirato4 1Department of Diagnostic and Interventional Radiology, Hokkaido University Hospital, Sapporo City, Japan 2Faculty of Health Science, Hokkaido University, Sapporo City, Japan 3Department of Radiology, Keiyukai Sapporo Hospital, Sapporo City, Japan 4Department of Radiation Medicine, Hokkaido University, Graduate School of Medicine, Sapporo City, Japan Email: ktamot[email protected] Received November 27, 2012; revised December 21, 2012; accepted January 4, 2013 ABSTRACT We investigate the diagnostic reliability of differentiating between lipid-poor adrenal adenomas and metastatic adrenal tumors originating from hepatocellular carcinoma (HCC) using a routine dynamic CT protocol for liver imaging. Eighteen metastatic adrenal tumors originating from HCC and 13 lipid-poor adrenal adenomas were identified. Dy- namic CT data were analyzed for CT attenuation of adrenal lesions before and after contrast administration. When a cutoff of 36 HU was set for adrenal lesions at pre-contrast attenuation, the sensitivity and specificity for the diagnosis of metastatic lesions were 94.4% and 92.3%, respectively. Attenuation criteria on pre-contrast CT may help optimize the differentiation between these lesions. Keywords: CT; Adrenal Incidentaloma; Hepatocellular Carcinoma; Lipid-Poor Adrenal Adenomas; Metastatic Adrenal Tumors 1. Introduction Hepatocellular carcinoma (HCC) results in between 250,000 and one million deaths globally per year [1-4]. Hepatocellular carcinoma is a devastating tumor, with a mean survival time of much less than 1 year, if left un- treated [5]. The treatment of HCC depends entirely on tumor stage. Potentially curative partial hepatic resection or orthotopic liver transplantation should be reserved for patients with stage I or II tumors [6]. Patients with an advanced tumor staging or with poor hepatocellular re- serves are not candidates for these curative surgical treat- ments, and therefore have palliative care as their only option. Patients with advanced-stage disease have lower survival rates than patients with early-stage HCC tumors. Thus, the detection of extrahepatic metastatic disease be- comes a crucial factor in planning potential therapy for patients with HCC, as it is desirable to avoid unnecessary surgical interventions. The adrenal glands are a common site for extrahepatic metastases, which accounted in one study for 19 (8.4%) of 232 consecutive cases of hepato- cellular carcinoma autopsied [7]. Recent studies have predicted that an adrenal inciden- taloma will be identified in 4% - 5% of abdominal CTs [8]. However approximately 75% of adrenal masses in patients with no history of cancer are cortical adenomas, whereas adrenal metastases account for 45% - 73% of adrenal masses in cancer patients [8]. Computed tomo- graphy has become the imaging modality of choice to differentiate between benign adrenal adenomas and me- tastases in oncology patients [9]. As approximately 30% of adenomas are lipid-poor and difficult to characterize on unenhanced CT scans [10], it has been proposed that if the attenuation of the adrenal gland exceeds 10 HU upon non-enhanced CT, contrast material-enhanced CT should be performed, and the washout calculated. With a combination of unenhanced and delayed enhanced CT, nearly all adrenal masses can be correctly categorized as adenomas or non-adenomas [11,12]. In patients with HCC, adrenal incidentalomas may be depicted if the patient is undergoing dynamic CT for an HCC protocol that would include the hepatic arterial, portal, and equilibrium phases after contrast administra- tion, in addition to non-enhanced CT. Lipid-rich adrenal adenomas may be diagnosed by analyzing unenhanced CT images. On the other hand, it remains difficult to dif- ferentiate metastatic adrenal tumors from lipid-poor ad- renal adenomas via CT images using an HCC protocol without a 10-minute delayed CT scan. As regards the CT-imaging results of adrenal tumors metastasized from HCC, Katyal and colleagues reported finding that con- trast material-enhancement characteristics ranged from the typical hypoattenuation of soft tissue (seen in adrenal C opyright © 2013 SciRes. ACT 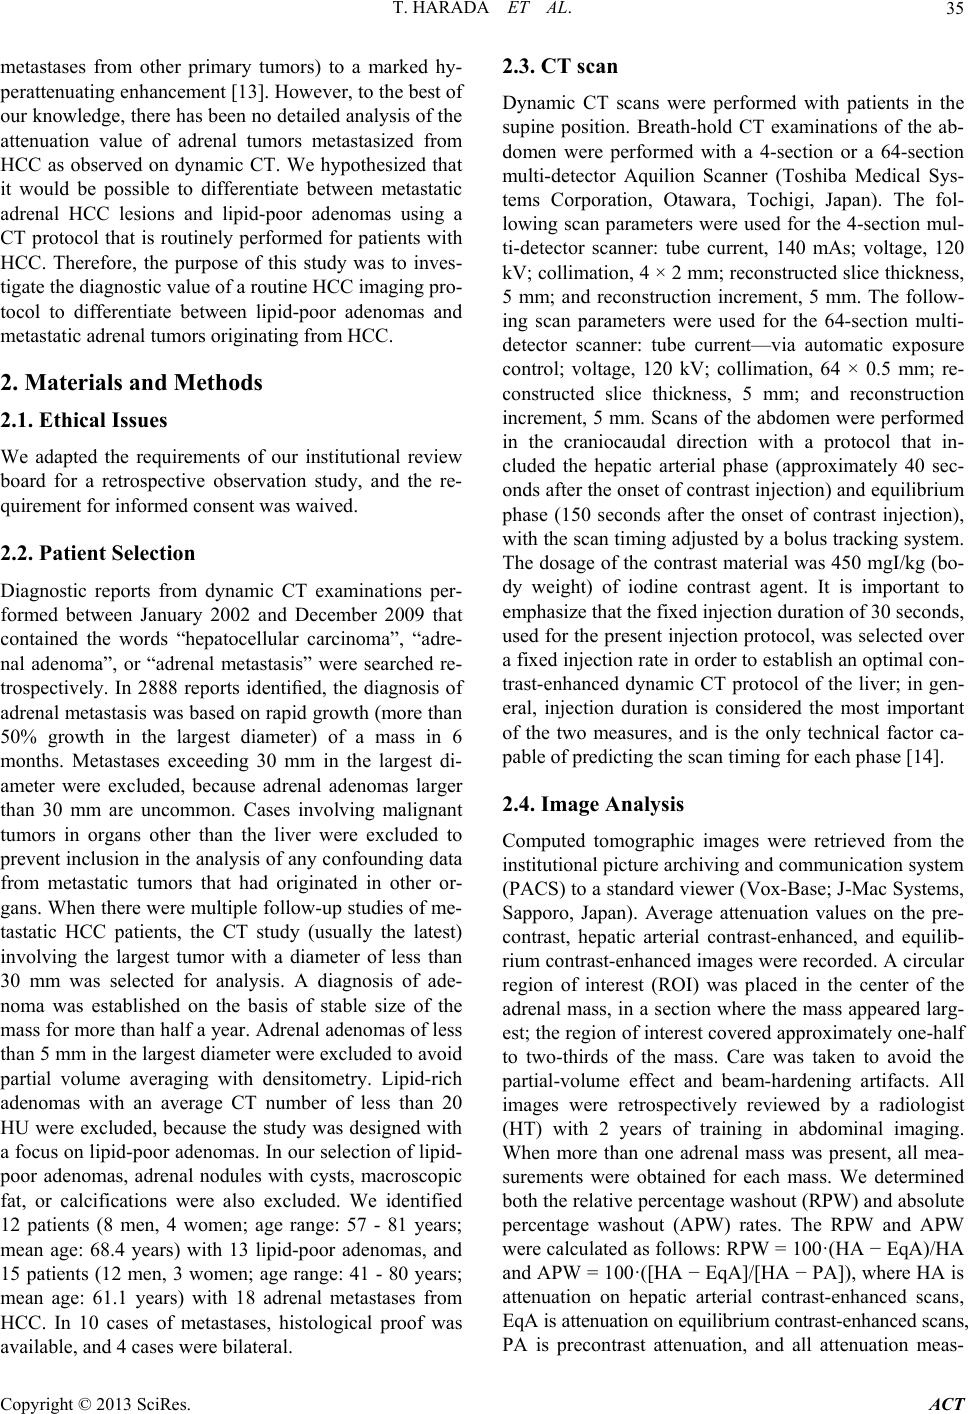 T. HARADA ET AL. 35 metastases from other primary tumors) to a marked hy- perattenuating enhancement [13]. However, to the best of our knowledge, there has been no detailed analysis of the attenuation value of adrenal tumors metastasized from HCC as observed on dynamic CT. We hypothesized that it would be possible to differentiate between metastatic adrenal HCC lesions and lipid-poor adenomas using a CT protocol that is routinely performed for patients with HCC. Therefore, the purpose of this study was to inves- tigate the diagnostic value of a routine HCC imaging pro- tocol to differentiate between lipid-poor adenomas and metastatic adrenal tumors originating from HCC. 2. Materials and Methods 2.1. Ethical Issues We adapted the requirements of our institutional review board for a retrospective observation study, and the re- quirement for informed consent was waived. 2.2. Patient Selection Diagnostic reports from dynamic CT examinations per- formed between January 2002 and December 2009 that contained the words “hepatocellular carcinoma”, “adre- nal adenoma”, or “adrenal metastasis” were searched re- trospectively. In 2888 reports identified, the diagnosis of adrenal metastasis was based on rapid growth (more than 50% growth in the largest diameter) of a mass in 6 months. Metastases exceeding 30 mm in the largest di- ameter were excluded, because adrenal adenomas larger than 30 mm are uncommon. Cases involving malignant tumors in organs other than the liver were excluded to prevent inclusion in the analysis of any confounding data from metastatic tumors that had originated in other or- gans. When there were multiple follow-up studies of me- tastatic HCC patients, the CT study (usually the latest) involving the largest tumor with a diameter of less than 30 mm was selected for analysis. A diagnosis of ade- noma was established on the basis of stable size of the mass for more than half a year. Adrenal adenomas of less than 5 mm in the largest diameter were excluded to avoid partial volume averaging with densitometry. Lipid-rich adenomas with an average CT number of less than 20 HU were excluded, because the study was designed with a focus on lipid-poor adenomas. In our selection of lipid- poor adenomas, adrenal nodules with cysts, macroscopic fat, or calcifications were also excluded. We identified 12 patients (8 men, 4 women; age range: 57 - 81 years; mean age: 68.4 years) with 13 lipid-poor adenomas, and 15 patients (12 men, 3 women; age range: 41 - 80 years; mean age: 61.1 years) with 18 adrenal metastases from HCC. In 10 cases of metastases, histological proof was available, and 4 cases were bilateral. 2.3. CT scan Dynamic CT scans were performed with patients in the supine position. Breath-hold CT examinations of the ab- domen were performed with a 4-section or a 64-section multi-detector Aquilion Scanner (Toshiba Medical Sys- tems Corporation, Otawara, Tochigi, Japan). The fol- lowing scan parameters were used for the 4-section mul- ti-detector scanner: tube current, 140 mAs; voltage, 120 kV; collimation, 4 × 2 mm; reconstructed slice thickness, 5 mm; and reconstruction increment, 5 mm. The follow- ing scan parameters were used for the 64-section multi- detector scanner: tube current—via automatic exposure control; voltage, 120 kV; collimation, 64 × 0.5 mm; re- constructed slice thickness, 5 mm; and reconstruction increment, 5 mm. Scans of the abdomen were performed in the craniocaudal direction with a protocol that in- cluded the hepatic arterial phase (approximately 40 sec- onds after the onset of contrast injection) and equilibrium phase (150 seconds after the onset of contrast injection), with the scan timing adjusted by a bolus tracking system. The dosage of the contrast material was 450 mgI/kg (bo- dy weight) of iodine contrast agent. It is important to emphasize that the fixed injection duration of 30 seconds, used for the present injection protocol, was selected over a fixed injection rate in order to establish an optimal con- trast-enhanced dynamic CT protocol of the liver; in gen- eral, injection duration is considered the most important of the two measures, and is the only technical factor ca- pable of predicting the scan timing for each phase [14]. 2.4. Image Analysis Computed tomographic images were retrieved from the institutional picture archiving and communication system (PACS) to a standard viewer (Vox-Base; J-Mac Systems, Sapporo, Japan). Average attenuation values on the pre- contrast, hepatic arterial contrast-enhanced, and equilib- rium contrast-enhanced images were recorded. A circular region of interest (ROI) was placed in the center of the adrenal mass, in a section where the mass appeared larg- est; the region of interest covered approximately one-half to two-thirds of the mass. Care was taken to avoid the partial-volume effect and beam-hardening artifacts. All images were retrospectively reviewed by a radiologist (HT) with 2 years of training in abdominal imaging. When more than one adrenal mass was present, all mea- surements were obtained for each mass. We determined both the relative percentage washout (RPW) and absolute percentage washout (APW) rates. The RPW and APW were calculated as follows: RPW = 100·(HA − EqA)/HA and APW = 100·([HA − EqA]/[HA − PA]), where HA is attenuation on hepatic arterial contrast-enhanced scans, EqA is attenuation on equilibrium contrast-enhanced scans, PA is precontrast attenuation, and all attenuation meas- Copyright © 2013 SciRes. ACT 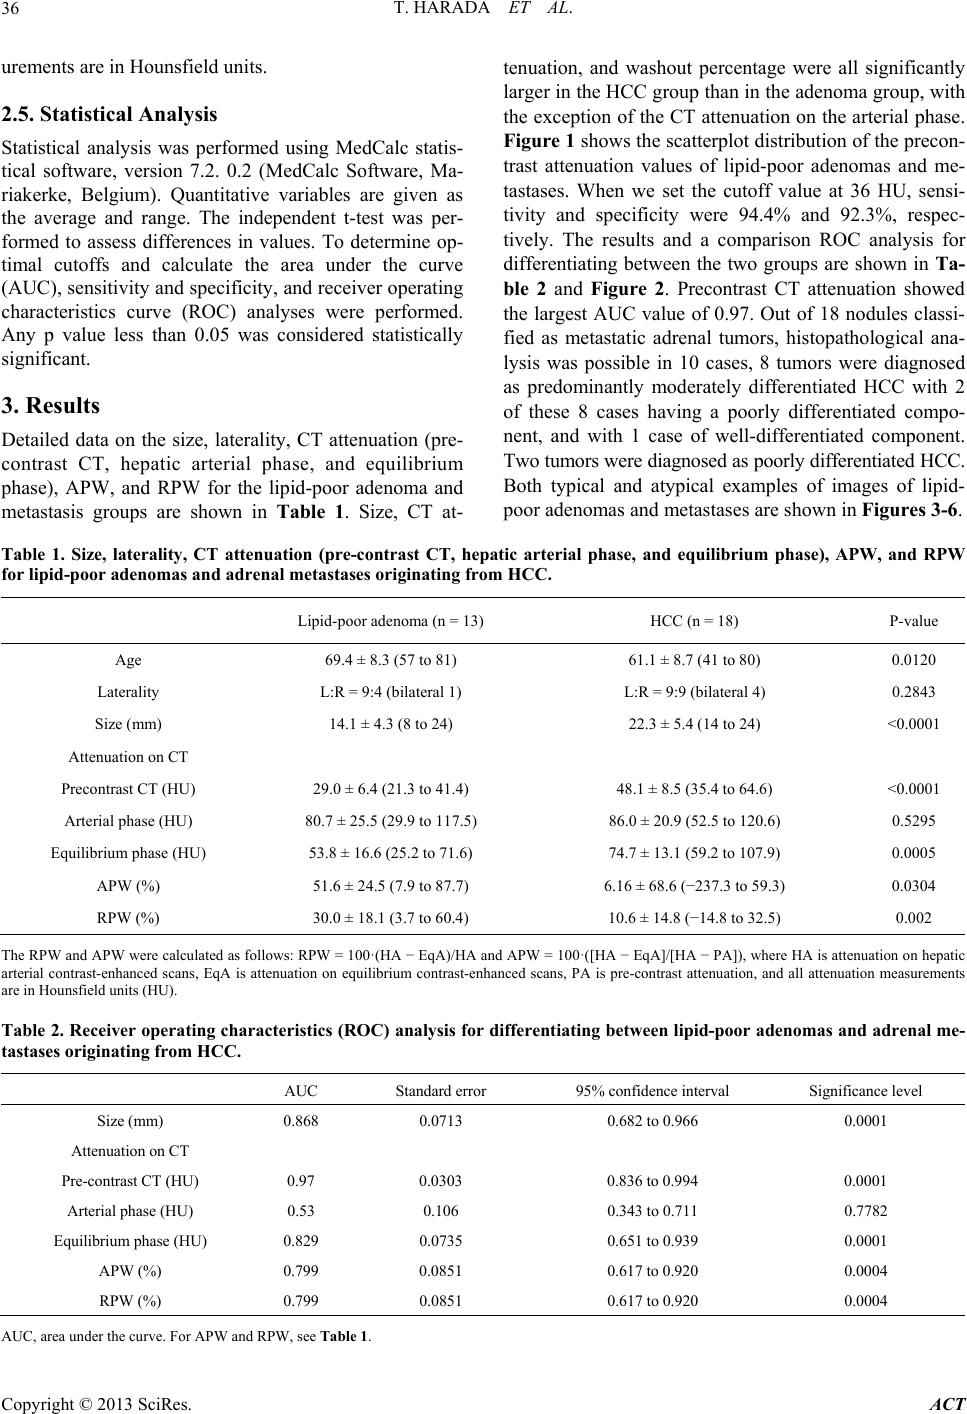 T. HARADA ET AL. Copyright © 2013 SciRes. ACT 36 urements are in Hounsfield units. 2.5. Statistical Analysis Statistical analysis was performed using MedCalc statis- tical software, version 7.2. 0.2 (MedCalc Software, Ma- riakerke, Belgium). Quantitative variables are given as the average and range. The independent t-test was per- formed to assess differences in values. To determine op- timal cutoffs and calculate the area under the curve (AUC), sensitivity and specificity, and receiver operating characteristics curve (ROC) analyses were performed. Any p value less than 0.05 was considered statistically significant. 3. Results Detailed data on the size, laterality, CT attenuation (pre- contrast CT, hepatic arterial phase, and equilibrium phase), APW, and RPW for the lipid-poor adenoma and metastasis groups are shown in Table 1. Size, CT at- tenuation, and washout percentage were all significantly larger in the HCC group than in the adenoma group, with the exception of the CT attenuation on the arterial phase. Figure 1 shows the scatterplot distribution of the precon- trast attenuation values of lipid-poor adenomas and me- tastases. When we set the cutoff value at 36 HU, sensi- tivity and specificity were 94.4% and 92.3%, respec- tively. The results and a comparison ROC analysis for differentiating between the two groups are shown in Ta- ble 2 and Figure 2. Precontrast CT attenuation showed the largest AUC value of 0.97. Out of 18 nodules classi- fied as metastatic adrenal tumors, histopathological ana- lysis was possible in 10 cases, 8 tumors were diagnosed as predominantly moderately differentiated HCC with 2 of these 8 cases having a poorly differentiated compo- nent, and with 1 case of well-differentiated component. Two tumors were diagnosed as poorly differentiated HCC. Both typical and atypical examples of images of lipid- poor adenomas and metastases are shown in Figures 3-6. Table 1. Size, laterality, CT attenuation (pre-contrast CT, hepatic arterial phase, and equilibrium phase), APW, and RPW for lipid-poor adenomas and adrenal metastases originating from HCC. Lipid-poor adenoma (n = 13) HCC (n = 18) P-value Age 69.4 ± 8.3 (57 to 81) 61.1 ± 8.7 (41 to 80) 0.0120 Laterality L:R = 9:4 (bilateral 1) L:R = 9:9 (bilateral 4) 0.2843 Size (mm) 14.1 ± 4.3 (8 to 24) 22.3 ± 5.4 (14 to 24) <0.0001 Attenuation on CT Precontrast CT (HU) 29.0 ± 6.4 (21.3 to 41.4) 48.1 ± 8.5 (35.4 to 64.6) <0.0001 Arterial phase (HU) 80.7 ± 25.5 (29.9 to 117.5) 86.0 ± 20.9 (52.5 to 120.6) 0.5295 Equilibrium phase (HU) 53.8 ± 16.6 (25.2 to 71.6) 74.7 ± 13.1 (59.2 to 107.9) 0.0005 APW (%) 51.6 ± 24.5 (7.9 to 87.7) 6.16 ± 68.6 (−237.3 to 59.3) 0.0304 RPW (%) 30.0 ± 18.1 (3.7 to 60.4) 10.6 ± 14.8 (−14.8 to 32.5) 0.002 The RPW and APW were calculated as follows: RPW = 100·(HA − EqA)/HA and APW = 100·([HA − EqA]/[HA − PA]), where HA is attenuation on hepatic arterial contrast-enhanced scans, EqA is attenuation on equilibrium contrast-enhanced scans, PA is pre-contrast attenuation, and all attenuation measurements are in Hounsfield units (HU). Table 2. Receiver operating characteristics (ROC) analysis for differentiating between lipid-poor adenomas and adrenal me- tastases originating from HCC. AUC Standard error 95% confidence interval Significance level Size (mm) 0.868 0.0713 0.682 to 0.966 0.0001 Attenuation on CT Pre-contrast CT (HU) 0.97 0.0303 0.836 to 0.994 0.0001 Arterial phase (HU) 0.53 0.106 0.343 to 0.711 0.7782 Equilibrium phase (HU) 0.829 0.0735 0.651 to 0.939 0.0001 APW (%) 0.799 0.0851 0.617 to 0.920 0.0004 RPW (%) 0.799 0.0851 0.617 to 0.920 0.0004 AUC, area under the curve. For APW and RPW, see Table 1. 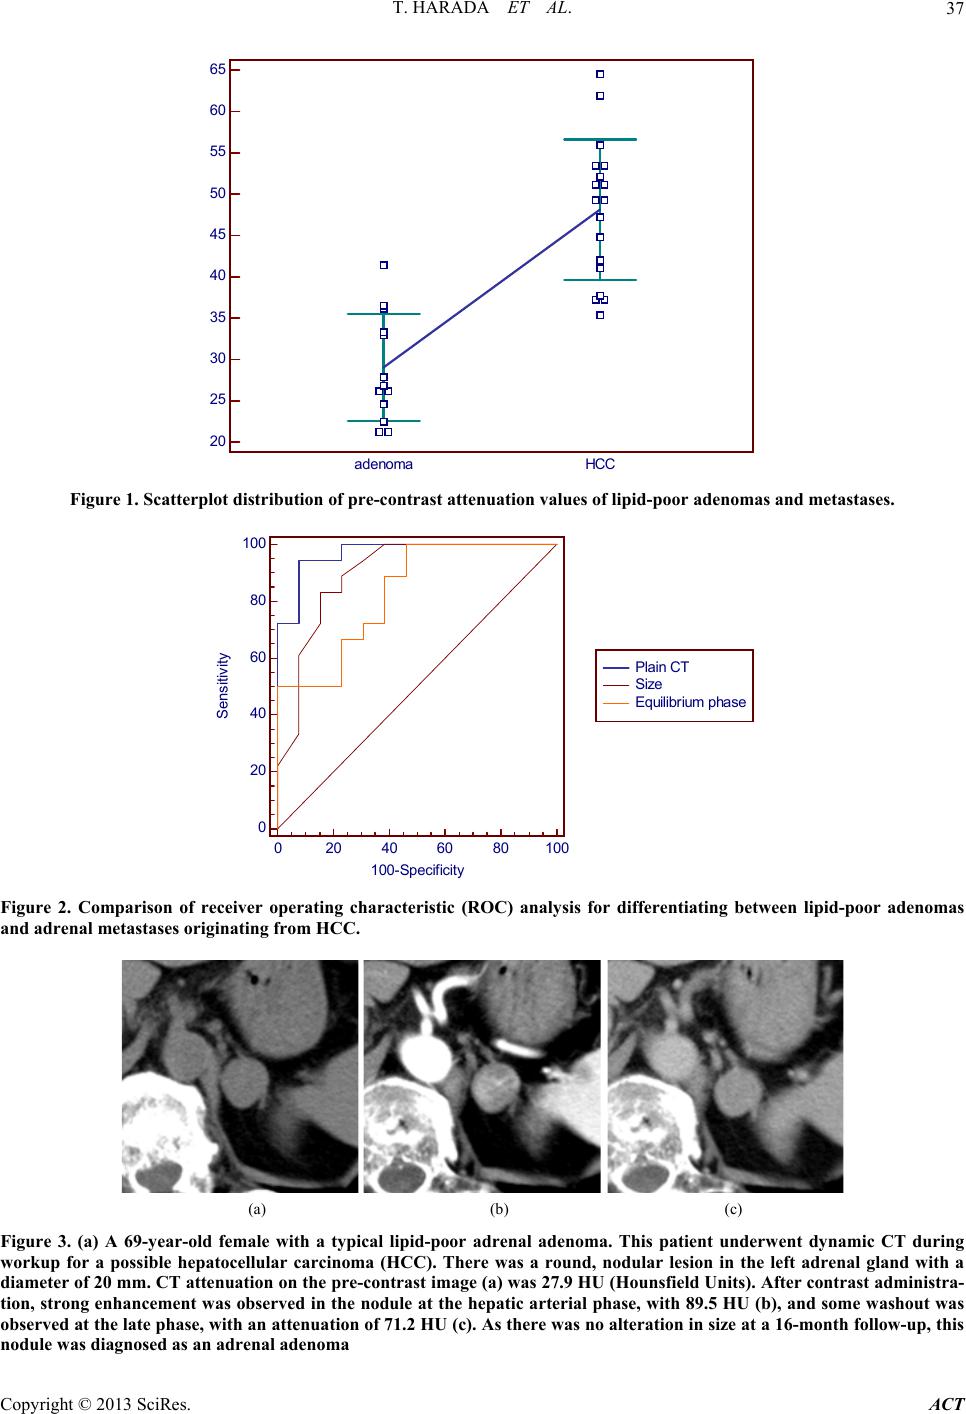 T. HARADA ET AL. 37 65 60 55 50 45 40 35 30 25 20 adenomaHCC Figure 1. Scatterplot distribution of pre -contrast atte nuation values of lipid-poor adenomas and metastases. Plain CT Size Equilibrium phase 020 406080 100 100 80 60 40 20 0 100-Specificity Sensitiv ity Figure 2. Comparison of receiver operating characteristic (ROC) analysis for differentiating between lipid-poor adenomas and adrenal metastases originating from HCC. (a) (b) (c) Figure 3. (a) A 69-year-old female with a typical lipid-poor adrenal adenoma. This patient underwent dynamic CT during workup for a possible hepatocellular carcinoma (HCC). There was a round, nodular lesion in the left adrenal gland with a diameter of 20 mm. CT attenuation on the pre-contrast image (a) was 27.9 HU (Hounsfield Units). After contrast administra- tion, strong enhancement was observed in the nodule at the hepatic arterial phase, with 89.5 HU (b), and some washout was observed at the late phase, with an attenuation of 71.2 HU (c). As there was no alteration in size at a 16-month follow-up, this nodule was diagnosed as an adrenal adenoma Copyright © 2013 SciRes. ACT 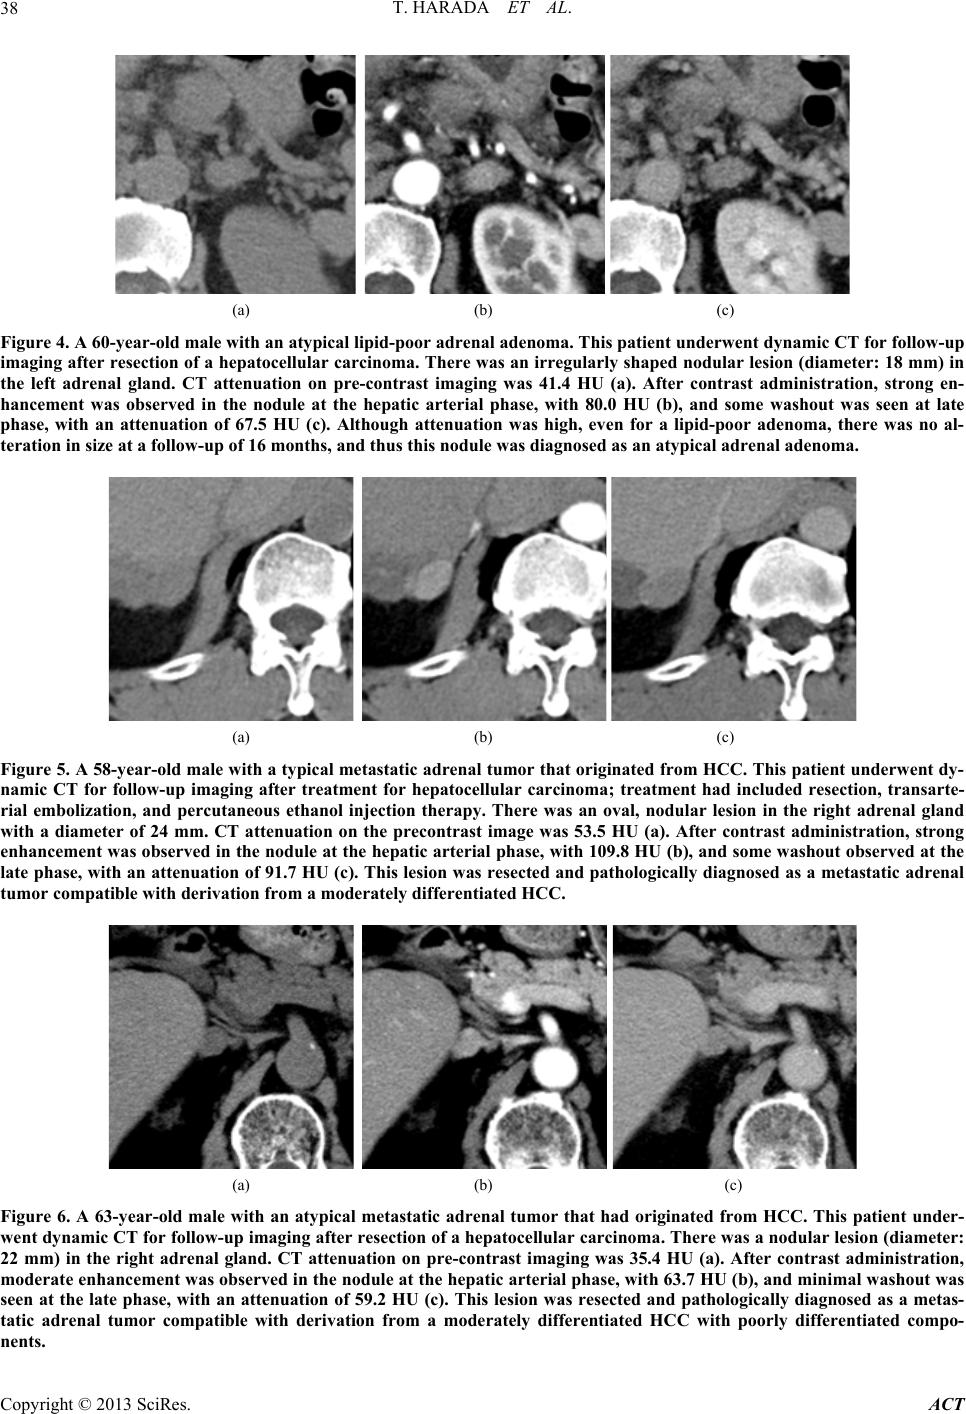 T. HARADA ET AL. 38 (a) (b) (c) Figure 4. A 60-year-old male with an atypical lipid-poor adrenal adenoma. This patient underwent dynamic CT for follow-up imaging after resection of a hepatocellular carcinoma. There was an irregularly shaped nodular lesion (diameter: 18 mm) in the left adrenal gland. CT attenuation on pre-contrast imaging was 41.4 HU (a). After contrast administration, strong en- hancement was observed in the nodule at the hepatic arterial phase, with 80.0 HU (b), and some washout was seen at late phase, with an attenuation of 67.5 HU (c). Although attenuation was high, even for a lipid-poor adenoma, there was no al- teration in size at a follow-up of 16 months, and thus this nodule was diagnosed as an atypical adrenal adenoma. (a) (b) (c) Figure 5. A 58-year-old male with a ty pical metastatic adrenal tumor that originated from HCC. This patient underw ent dy- namic CT for follow-up imaging after treatment for hepatocellular carcinoma; treatment had included resection, transarte- rial embolization, and percutaneous ethanol injection therapy. There was an oval, nodular lesion in the right adrenal gland with a diameter of 24 mm. CT attenuation on the precontrast image was 53.5 HU (a). After contrast administration, strong enhancement was observed in the nodule at the hepatic arterial phase, with 109.8 HU (b), and some washout observed at the late phase, with an attenuation of 91.7 HU (c). This lesion was resected and pathologically diagnosed as a metastatic adrenal tumor compatible with derivation from a moderately differentiated HCC. (a) (b) (c) Figure 6. A 63-year-old male with an atypical metastatic adrenal tumor that had originated from HCC. This patient under- went dynamic CT for follow-up imaging after resection of a hepatocellular carcinoma. There was a nodular lesion (diameter: 22 mm) in the right adrenal gland. CT attenuation on pre-contrast imaging was 35.4 HU (a). After contrast administration, moderate enhancement was observed in the nodule at the hepatic arterial phase, with 63.7 HU (b), and minimal washout was seen at the late phase, with an attenuation of 59.2 HU (c). This lesion was resected and pathologically diagnosed as a metas- tatic adrenal tumor compatible with derivation from a moderately differentiated HCC with poorly differentiated compo- ents. n Copyright © 2013 SciRes. ACT 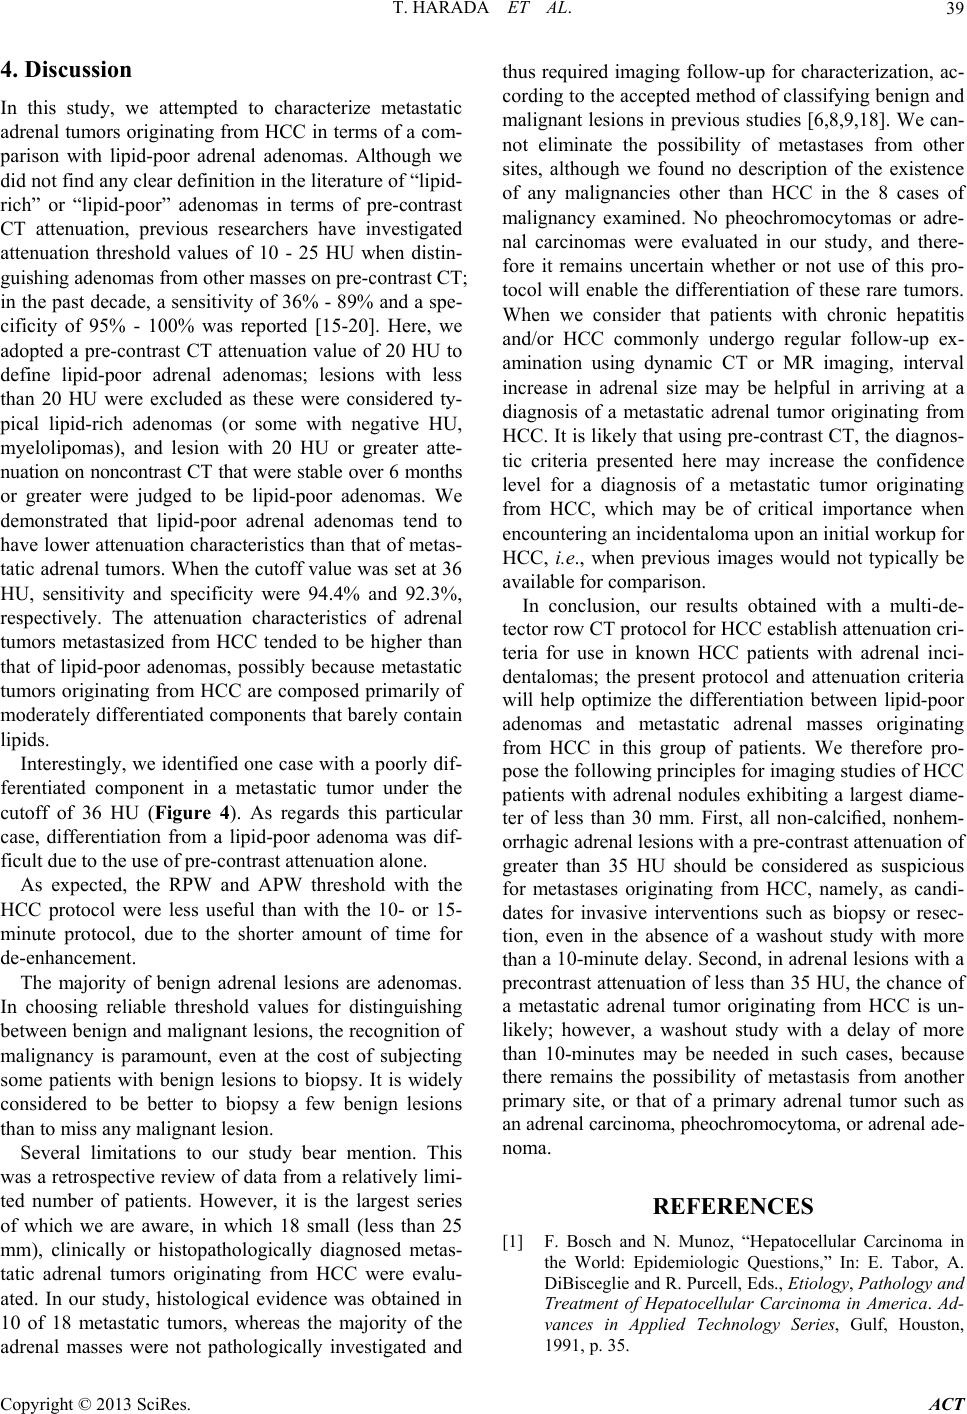 T. HARADA ET AL. Copyright © 2013 SciRes. ACT 39 4. Discussion In this study, we attempted to characterize metastatic adrenal tumors originating from HCC in terms of a com- parison with lipid-poor adrenal adenomas. Although we did not find any clear definition in the literature of “lipid- rich” or “lipid-poor” adenomas in terms of pre-contrast CT attenuation, previous researchers have investigated attenuation threshold values of 10 - 25 HU when distin- guishing adenomas from other masses on pre-contrast CT; in the past decade, a sensitivity of 36% - 89% and a spe- cificity of 95% - 100% was reported [15-20]. Here, we adopted a pre-contrast CT attenuation value of 20 HU to define lipid-poor adrenal adenomas; lesions with less than 20 HU were excluded as these were considered ty- pical lipid-rich adenomas (or some with negative HU, myelolipomas), and lesion with 20 HU or greater atte- nuation on noncontrast CT that were stable over 6 months or greater were judged to be lipid-poor adenomas. We demonstrated that lipid-poor adrenal adenomas tend to have lower attenuation characteristics than that of metas- tatic adrenal tumors. When the cutoff value was set at 36 HU, sensitivity and specificity were 94.4% and 92.3%, respectively. The attenuation characteristics of adrenal tumors metastasized from HCC tended to be higher than that of lipid-poor adenomas, possibly because metastatic tumors originating from HCC are composed primarily of moderately differentiated components that barely contain lipids. Interestingly, we identified one case with a poorly dif- ferentiated component in a metastatic tumor under the cutoff of 36 HU (Figure 4). As regards this particular case, differentiation from a lipid-poor adenoma was dif- ficult due to the use of pre-contrast attenuation alone. As expected, the RPW and APW threshold with the HCC protocol were less useful than with the 10- or 15- minute protocol, due to the shorter amount of time for de-enhancement. The majority of benign adrenal lesions are adenomas. In choosing reliable threshold values for distinguishing between benign and malignant lesions, the recognition of malignancy is paramount, even at the cost of subjecting some patients with benign lesions to biopsy. It is widely considered to be better to biopsy a few benign lesions than to miss any malignant lesion. Several limitations to our study bear mention. This was a retrospective review of data from a relatively limi- ted number of patients. However, it is the largest series of which we are aware, in which 18 small (less than 25 mm), clinically or histopathologically diagnosed metas- tatic adrenal tumors originating from HCC were evalu- ated. In our study, histological evidence was obtained in 10 of 18 metastatic tumors, whereas the majority of the adrenal masses were not pathologically investigated and thus required imaging follow-up for characterization, ac- cording to the accepted method of classifying benign and malignant lesions in previous studies [6,8,9,18]. We can- not eliminate the possibility of metastases from other sites, although we found no description of the existence of any malignancies other than HCC in the 8 cases of malignancy examined. No pheochromocytomas or adre- nal carcinomas were evaluated in our study, and there- fore it remains uncertain whether or not use of this pro- tocol will enable the differentiation of these rare tumors. When we consider that patients with chronic hepatitis and/or HCC commonly undergo regular follow-up ex- amination using dynamic CT or MR imaging, interval increase in adrenal size may be helpful in arriving at a diagnosis of a metastatic adrenal tumor originating from HCC. It is likely that using pre-contrast CT, the diagnos- tic criteria presented here may increase the confidence level for a diagnosis of a metastatic tumor originating from HCC, which may be of critical importance when encountering an incidentaloma upon an initial workup for HCC, i.e., when previous images would not typically be available for comparison. In conclusion, our results obtained with a multi-de- tector row CT protocol for HCC establish attenuation cri- teria for use in known HCC patients with adrenal inci- dentalomas; the present protocol and attenuation criteria will help optimize the differentiation between lipid-poor adenomas and metastatic adrenal masses originating from HCC in this group of patients. We therefore pro- pose the following principles for imaging studies of HCC patients with adrenal nodules exhibiting a largest diame- ter of less than 30 mm. First, all non-calcified, nonhem- orrhagic adrenal lesions with a pre-contrast attenuation of greater than 35 HU should be considered as suspicious for metastases originating from HCC, namely, as candi- dates for invasive interventions such as biopsy or resec- tion, even in the absence of a washout study with more than a 10-minute delay. Second, in adrenal lesions with a precontrast attenuation of less than 35 HU, the chance of a metastatic adrenal tumor originating from HCC is un- likely; however, a washout study with a delay of more than 10-minutes may be needed in such cases, because there remains the possibility of metastasis from another primary site, or that of a primary adrenal tumor such as an adrenal carcinoma, pheochromocytoma, or adrenal ade- noma. REFERENCES [1] F. Bosch and N. Munoz, “Hepatocellular Carcinoma in the World: Epidemiologic Questions,” In: E. Tabor, A. DiBisceglie and R. Purcell, Eds., Etiology, Pathology and Treatment of Hepatocellular Carcinoma in America. Ad- vances in Applied Technology Series, Gulf, Houston, 1991, p. 35. 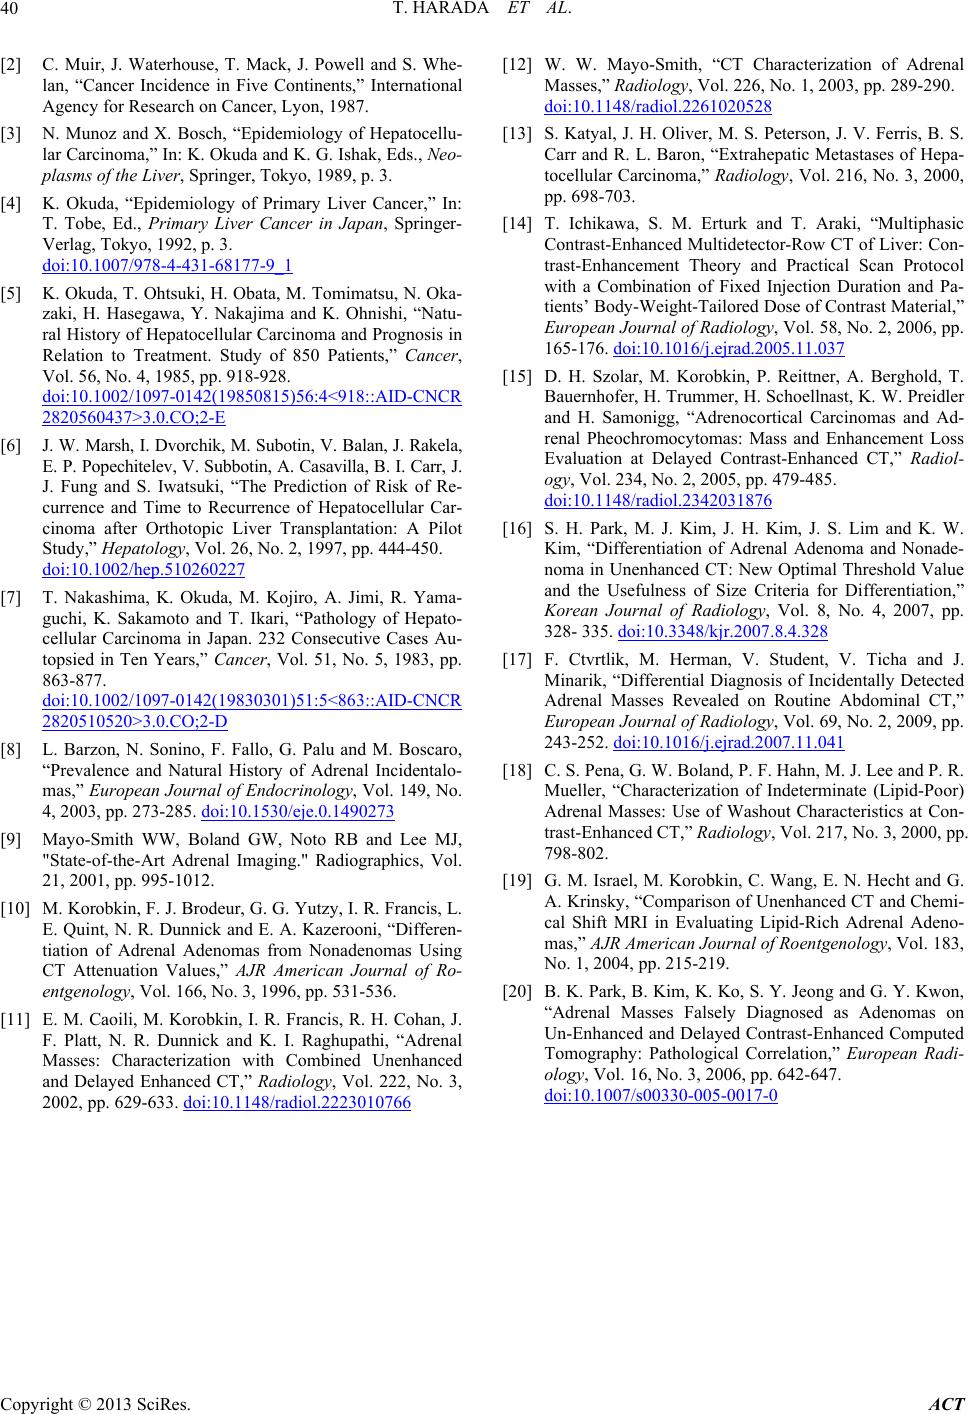 T. HARADA ET AL. 40 [2] C. Muir, J. Waterhouse, T. Mack, J. Powell and S. Whe- lan, “Cancer Incidence in Five Continents,” International Agency for Research on Cancer, Lyon, 1987. [3] N. Munoz and X. Bosch, “Epidemiology of Hepatocellu- lar Carcinoma,” In: K. Okuda and K. G. Ishak, Eds., Neo- plasms of the Liver, Springer, Tokyo, 1989, p. 3. [4] K. Okuda, “Epidemiology of Primary Liver Cancer,” In: T. Tobe, Ed., Primary Liver Cancer in Japan, Springer- Verlag, Tokyo, 1992, p. 3. doi:10.1007/978-4-431-68177-9_1 [5] K. Okuda, T. Ohtsuki, H. Obata, M. Tomimatsu, N. Oka- zaki, H. Hasegawa, Y. Nakajima and K. Ohnishi, “Natu- ral History of Hepatocellular Carcinoma and Prognosis in Relation to Treatment. Study of 850 Patients,” Cancer, Vol. 56, No. 4, 1985, pp. 918-928. doi:10.1002/1097-0142(19850815)56:4<918::AID-CNCR 2820560437>3.0.CO;2-E [6] J. W. Marsh, I. Dvorchik, M. Subotin, V. Balan, J. Rakela, E. P. Popechitelev, V. Subbotin, A. Casavilla, B. I. Carr, J. J. Fung and S. Iwatsuki, “The Prediction of Risk of Re- currence and Time to Recurrence of Hepatocellular Car- cinoma after Orthotopic Liver Transplantation: A Pilot Study,” Hepatology, Vol. 26, No. 2, 1997, pp. 444-450. doi:10.1002/hep.510260227 [7] T. Nakashima, K. Okuda, M. Kojiro, A. Jimi, R. Yama- guchi, K. Sakamoto and T. Ikari, “Pathology of Hepato- cellular Carcinoma in Japan. 232 Consecutive Cases Au- topsied in Ten Years,” Cancer, Vol. 51, No. 5, 1983, pp. 863-877. doi:10.1002/1097-0142(19830301)51:5<863::AID-CNCR 2820510520>3.0.CO;2-D [8] L. Barzon, N. Sonino, F. Fallo, G. Palu and M. Boscaro, “Prevalence and Natural History of Adrenal Incidentalo- mas,” European Journal of Endocrinology, Vol. 149, No. 4, 2003, pp. 273-285. doi:10.1530/eje.0.1490273 [9] Mayo-Smith WW, Boland GW, Noto RB and Lee MJ, "State-of-the-Art Adrenal Imaging." Radiographics, Vol. 21, 2001, pp. 995-1012. [10] M. Korobkin, F. J. Brodeur, G. G. Yutzy, I. R. Francis, L. E. Quint, N. R. Dunnick and E. A. Kazerooni, “Differen- tiation of Adrenal Adenomas from Nonadenomas Using CT Attenuation Values,” AJR American Journal of Ro- entgenology, Vol. 166, No. 3, 1996, pp. 531-536. [11] E. M. Caoili, M. Korobkin, I. R. Francis, R. H. Cohan, J. F. Platt, N. R. Dunnick and K. I. Raghupathi, “Adrenal Masses: Characterization with Combined Unenhanced and Delayed Enhanced CT,” Radiology, Vol. 222, No. 3, 2002, pp. 629-633. doi:10.1148/radiol.2223010766 [12] W. W. Mayo-Smith, “CT Characterization of Adrenal Masses,” Radiology, Vol. 226, No. 1, 2003, pp. 289-290. doi:10.1148/radiol.2261020528 [13] S. Katyal, J. H. Oliver, M. S. Peterson, J. V. Ferris, B. S. Carr and R. L. Baron, “Extrahepatic Metastases of Hepa- tocellular Carcinoma,” Radiology, Vol. 216, No. 3, 2000, pp. 698-703. [14] T. Ichikawa, S. M. Erturk and T. Araki, “Multiphasic Contrast-Enhanced Multidetector-Row CT of Liver: Con- trast-Enhancement Theory and Practical Scan Protocol with a Combination of Fixed Injection Duration and Pa- tients’ Body-Weight-Tailored Dose of Contrast Material,” European Journal of Radiology, Vol. 58, No. 2, 2006, pp. 165-176. doi:10.1016/j.ejrad.2005.11.037 [15] D. H. Szolar, M. Korobkin, P. Reittner, A. Berghold, T. Bauernhofer, H. Trummer, H. Schoellnast, K. W. Preidler and H. Samonigg, “Adrenocortical Carcinomas and Ad- renal Pheochromocytomas: Mass and Enhancement Loss Evaluation at Delayed Contrast-Enhanced CT,” Radiol- ogy, Vol. 234, No. 2, 2005, pp. 479-485. doi:10.1148/radiol.2342031876 [16] S. H. Park, M. J. Kim, J. H. Kim, J. S. Lim and K. W. Kim, “Differentiation of Adrenal Adenoma and Nonade- noma in Unenhanced CT: New Optimal Threshold Value and the Usefulness of Size Criteria for Differentiation,” Korean Journal of Radiology, Vol. 8, No. 4, 2007, pp. 328- 335. doi:10.3348/kjr.2007.8.4.328 [17] F. Ctvrtlik, M. Herman, V. Student, V. Ticha and J. Minarik, “Differential Diagnosis of Incidentally Detected Adrenal Masses Revealed on Routine Abdominal CT,” European Journal of Radiology, Vol. 69, No. 2, 2009, pp. 243-252. doi:10.1016/j.ejrad.2007.11.041 [18] C. S. Pena, G. W. Boland, P. F. Hahn, M. J. Lee and P. R. Mueller, “Characterization of Indeterminate (Lipid-Poor) Adrenal Masses: Use of Washout Characteristics at Con- trast-Enhanced CT,” Radiology, Vol. 217, No. 3, 2000, pp. 798-802. [19] G. M. Israel, M. Korobkin, C. Wang, E. N. Hecht and G. A. Krinsky, “Comparison of Unenhanced CT and Chemi- cal Shift MRI in Evaluating Lipid-Rich Adrenal Adeno- mas,” AJR American Journal of Roentgenology, Vol. 183, No. 1, 2004, pp. 215-219. [20] B. K. Park, B. Kim, K. Ko, S. Y. Jeong and G. Y. Kwon, “Adrenal Masses Falsely Diagnosed as Adenomas on Un-Enhanced and Delayed Contrast-Enhanced Computed Tomography: Pathological Correlation,” European Radi- ology, Vol. 16, No. 3, 2006, pp. 642-647. doi:10.1007/s00330-005-0017-0 Copyright © 2013 SciRes. ACT |