

Paper Menu >>
Journal Menu >>
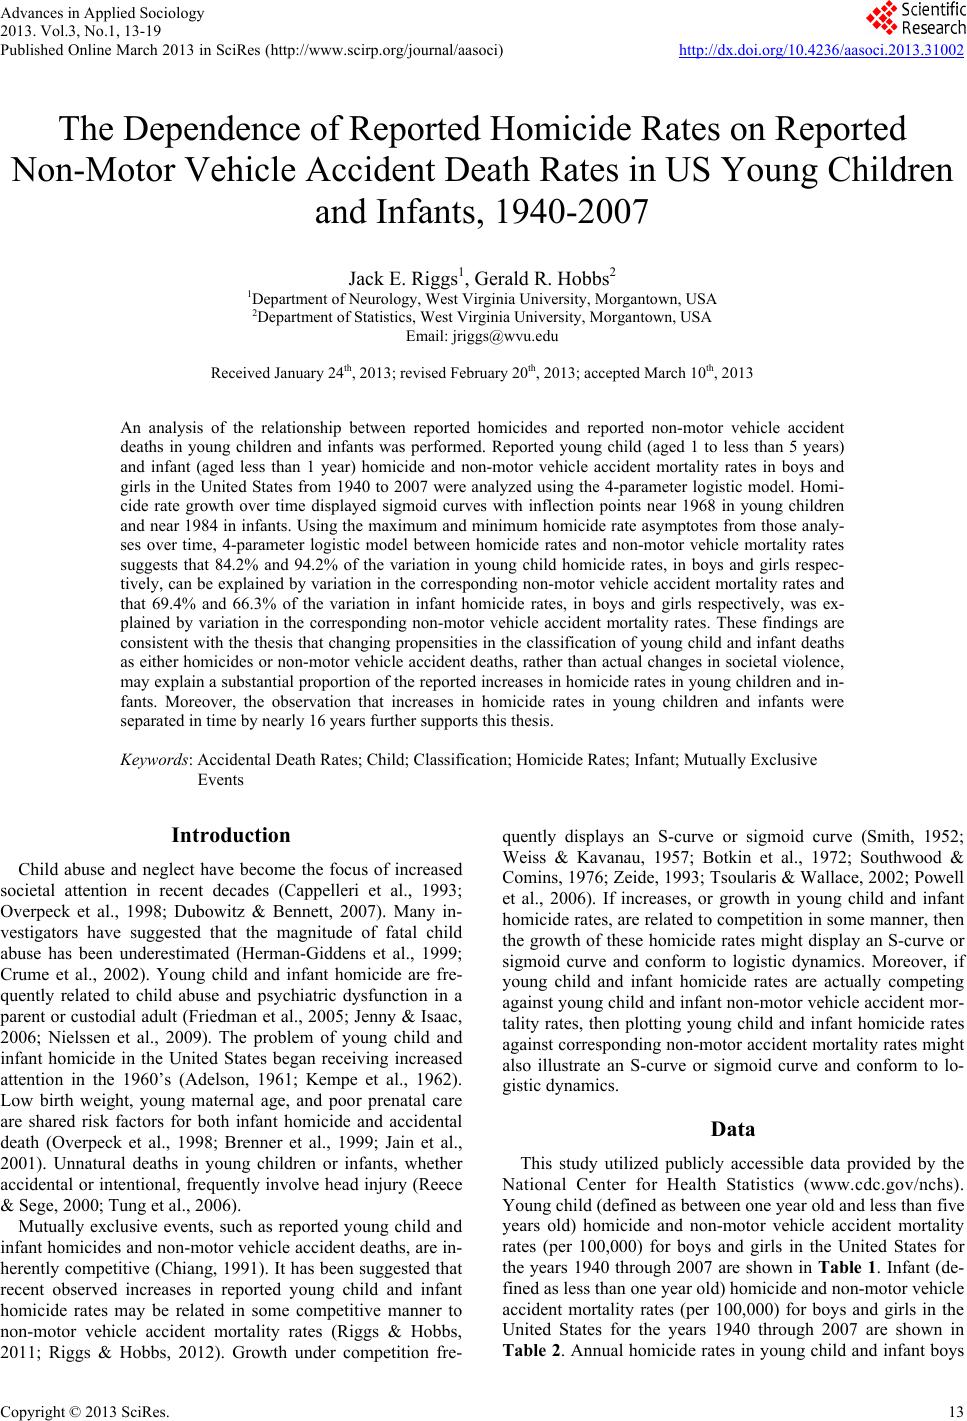 Advances in Applied Sociology 2013. Vol.3, No.1, 13-19 Published Online March 2013 in SciRes (http://www.scirp.org/journal/aasoci) http://dx.doi.org/10.4236/aasoci.2013.31002 Copyright © 2013 SciRes. 13 The Dependence of Reported Homicide Rates on Reported Non-Motor Vehicle Accident Death Rates in US Young Children and Infants, 1940-2007 Jack E. Riggs1, Gerald R. Hobbs2 1Department of Neurology, West Virginia University, Morgantown, USA 2Department of Statistics, West Virginia University, Morgantown, USA Email: [email protected] Received January 24th, 2013; revised February 20th, 2013; accepted March 10th, 2013 An analysis of the relationship between reported homicides and reported non-motor vehicle accident deaths in young children and infants was performed. Reported young child (aged 1 to less than 5 years) and infant (aged less than 1 year) homicide and non-motor vehicle accident mortality rates in boys and girls in the United States from 1940 to 2007 were analyzed using the 4-parameter logistic model. Homi- cide rate growth over time displayed sigmoid curves with inflection points near 1968 in young children and near 1984 in infants. Using the maximum and minimum homicide rate asymptotes from those analy- ses over time, 4-parameter logistic model between homicide rates and non-motor vehicle mortality rates suggests that 84.2% and 94.2% of the variation in young child homicide rates, in boys and girls respec- tively, can be explained by variation in the corresponding non-motor vehicle accident mortality rates and that 69.4% and 66.3% of the variation in infant homicide rates, in boys and girls respectively, was ex- plained by variation in the corresponding non-motor vehicle accident mortality rates. These findings are consistent with the thesis that changing propensities in the classification of young child and infant deaths as either homicides or non-motor vehicle accident deaths, rather than actual changes in societal violence, may explain a substantial proportion of the reported increases in homicide rates in young children and in- fants. Moreover, the observation that increases in homicide rates in young children and infants were separated in time by nearly 16 years further supports this thesis. Keywords: Accidental Death Rates; Child; Classification; Homicide Rates; Infant; Mutually Exclusive Events Introduction Child abuse and neglect have become the focus of increased societal attention in recent decades (Cappelleri et al., 1993; Overpeck et al., 1998; Dubowitz & Bennett, 2007). Many in- vestigators have suggested that the magnitude of fatal child abuse has been underestimated (Herman-Giddens et al., 1999; Crume et al., 2002). Young child and infant homicide are fre- quently related to child abuse and psychiatric dysfunction in a parent or custodial adult (Friedman et al., 2005; Jenny & Isaac, 2006; Nielssen et al., 2009). The problem of young child and infant homicide in the United States began receiving increased attention in the 1960’s (Adelson, 1961; Kempe et al., 1962). Low birth weight, young maternal age, and poor prenatal care are shared risk factors for both infant homicide and accidental death (Overpeck et al., 1998; Brenner et al., 1999; Jain et al., 2001). Unnatural deaths in young children or infants, whether accidental or intentional, frequently involve head injury (Reece & Sege, 2000; Tung et al., 2006). Mutually exclusive events, such as reported young child and infant homicides and non-motor vehicle accident deaths, are in- herently competitive (Chiang, 1991). It has been suggested that recent observed increases in reported young child and infant homicide rates may be related in some competitive manner to non-motor vehicle accident mortality rates (Riggs & Hobbs, 2011; Riggs & Hobbs, 2012). Growth under competition fre- quently displays an S-curve or sigmoid curve (Smith, 1952; Weiss & Kavanau, 1957; Botkin et al., 1972; Southwood & Comins, 1976; Zeide, 1993; Tsoularis & Wallace, 2002; Powell et al., 2006). If increases, or growth in young child and infant homicide rates, are related to competition in some manner, then the growth of these homicide rates might display an S-curve or sigmoid curve and conform to logistic dynamics. Moreover, if young child and infant homicide rates are actually competing against young child and infant non-motor vehicle accident mor- tality rates, then plotting young child and infant homicide rates against corresponding non-motor accident mortality rates might also illustrate an S-curve or sigmoid curve and conform to lo- gistic dynamics. Data This study utilized publicly accessible data provided by the National Center for Health Statistics (www.cdc.gov/nchs). Young child (defined as between one year old and less than five years old) homicide and non-motor vehicle accident mortality rates (per 100,000) for boys and girls in the United States for the years 1940 through 2007 are shown in Table 1. Infant (de- fined as less than one year old) homicide and non-motor vehicle accident mortality rates (per 100,000) for boys and girls in the United States for the years 1940 through 2007 are shown in Table 2. Annual homicide rates in young child and infant boys 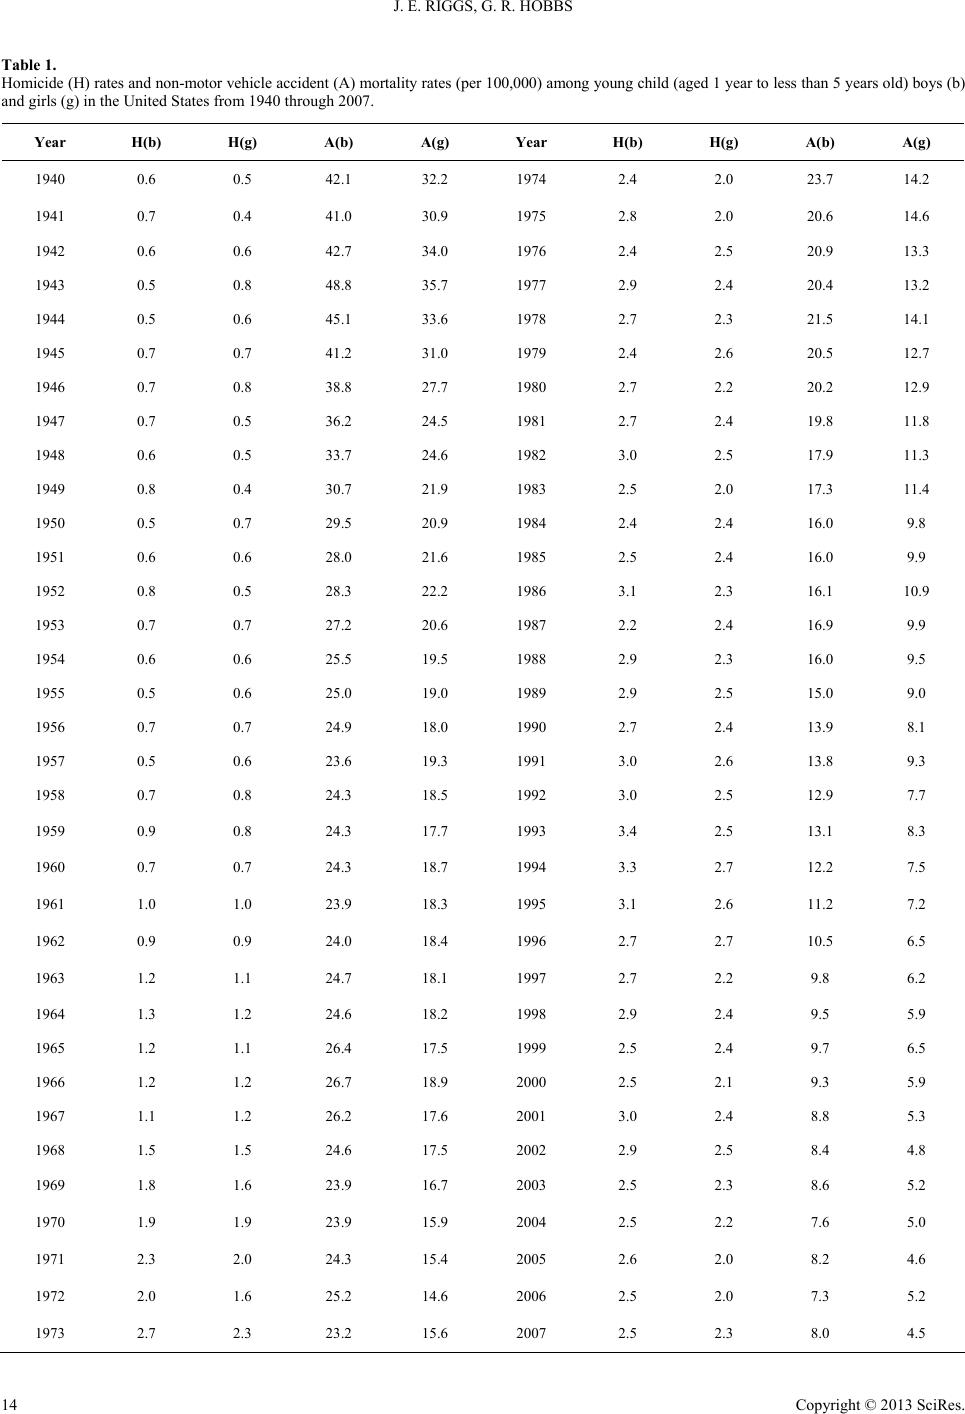 J. E. RIGGS, G. R. HOBBS Table 1. Homicide (H) rates and non-motor vehicle accident (A) mortality rates (per 100,000) among young child (aged 1 year to less than 5 years old) boys (b) and girls (g) in the United States from 1940 through 2007. Year H(b) H(g) A(b) A(g) Year H(b) H(g) A(b) A(g) 1940 0.6 0.5 42.1 32.2 1974 2.4 2.0 23.7 14.2 1941 0.7 0.4 41.0 30.9 1975 2.8 2.0 20.6 14.6 1942 0.6 0.6 42.7 34.0 1976 2.4 2.5 20.9 13.3 1943 0.5 0.8 48.8 35.7 1977 2.9 2.4 20.4 13.2 1944 0.5 0.6 45.1 33.6 1978 2.7 2.3 21.5 14.1 1945 0.7 0.7 41.2 31.0 1979 2.4 2.6 20.5 12.7 1946 0.7 0.8 38.8 27.7 1980 2.7 2.2 20.2 12.9 1947 0.7 0.5 36.2 24.5 1981 2.7 2.4 19.8 11.8 1948 0.6 0.5 33.7 24.6 1982 3.0 2.5 17.9 11.3 1949 0.8 0.4 30.7 21.9 1983 2.5 2.0 17.3 11.4 1950 0.5 0.7 29.5 20.9 1984 2.4 2.4 16.0 9.8 1951 0.6 0.6 28.0 21.6 1985 2.5 2.4 16.0 9.9 1952 0.8 0.5 28.3 22.2 1986 3.1 2.3 16.1 10.9 1953 0.7 0.7 27.2 20.6 1987 2.2 2.4 16.9 9.9 1954 0.6 0.6 25.5 19.5 1988 2.9 2.3 16.0 9.5 1955 0.5 0.6 25.0 19.0 1989 2.9 2.5 15.0 9.0 1956 0.7 0.7 24.9 18.0 1990 2.7 2.4 13.9 8.1 1957 0.5 0.6 23.6 19.3 1991 3.0 2.6 13.8 9.3 1958 0.7 0.8 24.3 18.5 1992 3.0 2.5 12.9 7.7 1959 0.9 0.8 24.3 17.7 1993 3.4 2.5 13.1 8.3 1960 0.7 0.7 24.3 18.7 1994 3.3 2.7 12.2 7.5 1961 1.0 1.0 23.9 18.3 1995 3.1 2.6 11.2 7.2 1962 0.9 0.9 24.0 18.4 1996 2.7 2.7 10.5 6.5 1963 1.2 1.1 24.7 18.1 1997 2.7 2.2 9.8 6.2 1964 1.3 1.2 24.6 18.2 1998 2.9 2.4 9.5 5.9 1965 1.2 1.1 26.4 17.5 1999 2.5 2.4 9.7 6.5 1966 1.2 1.2 26.7 18.9 2000 2.5 2.1 9.3 5.9 1967 1.1 1.2 26.2 17.6 2001 3.0 2.4 8.8 5.3 1968 1.5 1.5 24.6 17.5 2002 2.9 2.5 8.4 4.8 1969 1.8 1.6 23.9 16.7 2003 2.5 2.3 8.6 5.2 1970 1.9 1.9 23.9 15.9 2004 2.5 2.2 7.6 5.0 1971 2.3 2.0 24.3 15.4 2005 2.6 2.0 8.2 4.6 1972 2.0 1.6 25.2 14.6 2006 2.5 2.0 7.3 5.2 1973 2.7 2.3 23.2 15.6 2007 2.5 2.3 8.0 4.5 Copyright © 2013 SciRes. 14 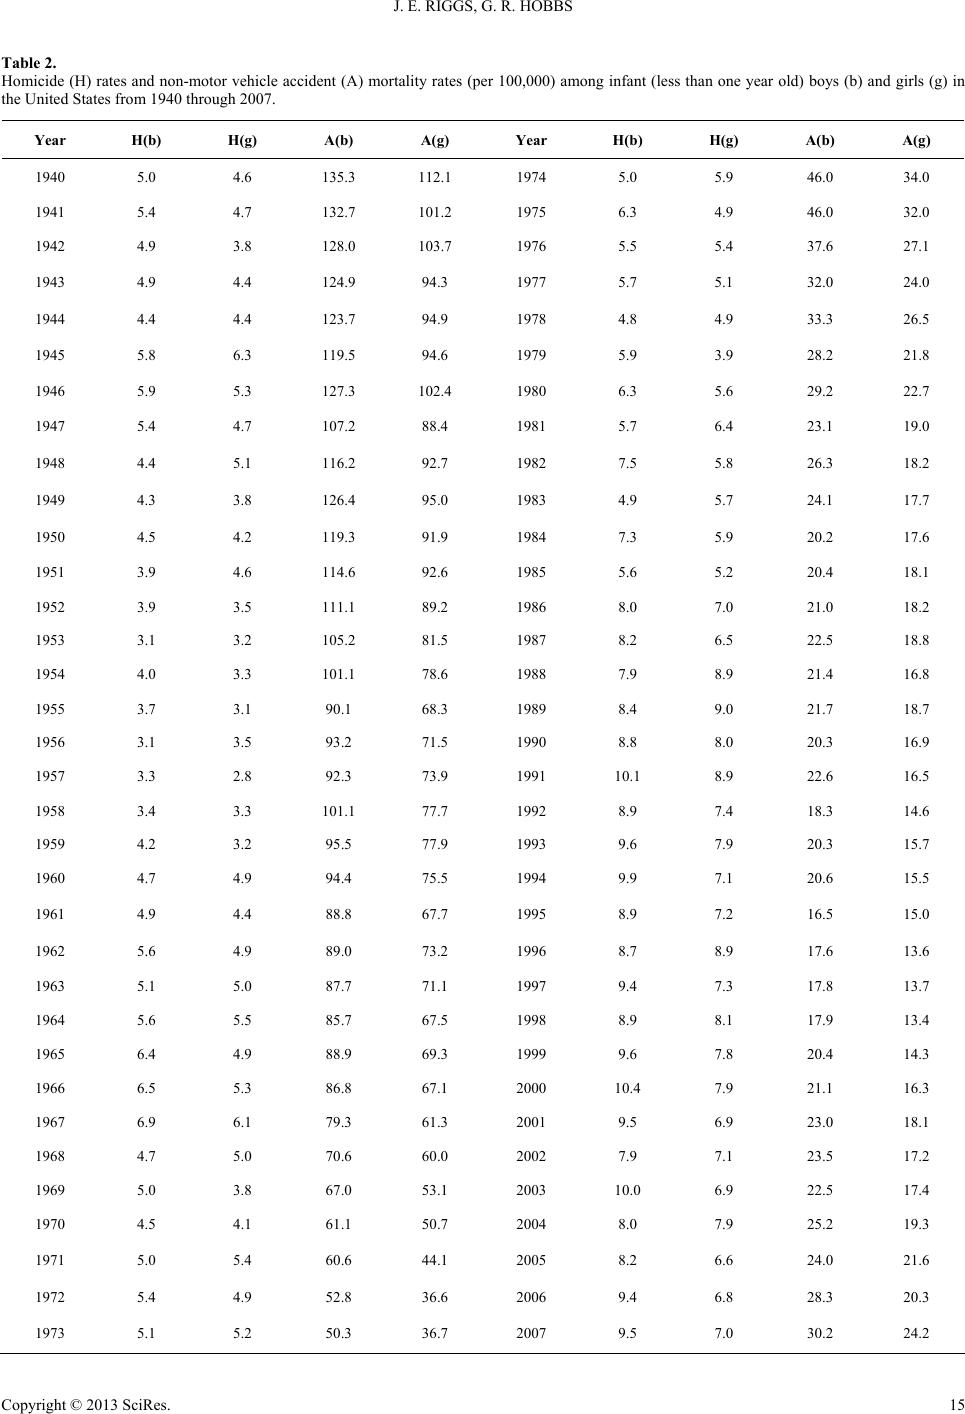 J. E. RIGGS, G. R. HOBBS Table 2. Homicide (H) rates and non-motor vehicle accident (A) mortality rates (per 100,000) among infant (less than one year old) boys (b) and girls (g) in the United States from 1940 through 2007. Year H(b) H(g) A(b) A(g) Year H(b) H(g) A(b) A(g) 1940 5.0 4.6 135.3 112.1 1974 5.0 5.9 46.0 34.0 1941 5.4 4.7 132.7 101.2 1975 6.3 4.9 46.0 32.0 1942 4.9 3.8 128.0 103.7 1976 5.5 5.4 37.6 27.1 1943 4.9 4.4 124.9 94.3 1977 5.7 5.1 32.0 24.0 1944 4.4 4.4 123.7 94.9 1978 4.8 4.9 33.3 26.5 1945 5.8 6.3 119.5 94.6 1979 5.9 3.9 28.2 21.8 1946 5.9 5.3 127.3 102.4 1980 6.3 5.6 29.2 22.7 1947 5.4 4.7 107.2 88.4 1981 5.7 6.4 23.1 19.0 1948 4.4 5.1 116.2 92.7 1982 7.5 5.8 26.3 18.2 1949 4.3 3.8 126.4 95.0 1983 4.9 5.7 24.1 17.7 1950 4.5 4.2 119.3 91.9 1984 7.3 5.9 20.2 17.6 1951 3.9 4.6 114.6 92.6 1985 5.6 5.2 20.4 18.1 1952 3.9 3.5 111.1 89.2 1986 8.0 7.0 21.0 18.2 1953 3.1 3.2 105.2 81.5 1987 8.2 6.5 22.5 18.8 1954 4.0 3.3 101.1 78.6 1988 7.9 8.9 21.4 16.8 1955 3.7 3.1 90.1 68.3 1989 8.4 9.0 21.7 18.7 1956 3.1 3.5 93.2 71.5 1990 8.8 8.0 20.3 16.9 1957 3.3 2.8 92.3 73.9 1991 10.1 8.9 22.6 16.5 1958 3.4 3.3 101.1 77.7 1992 8.9 7.4 18.3 14.6 1959 4.2 3.2 95.5 77.9 1993 9.6 7.9 20.3 15.7 1960 4.7 4.9 94.4 75.5 1994 9.9 7.1 20.6 15.5 1961 4.9 4.4 88.8 67.7 1995 8.9 7.2 16.5 15.0 1962 5.6 4.9 89.0 73.2 1996 8.7 8.9 17.6 13.6 1963 5.1 5.0 87.7 71.1 1997 9.4 7.3 17.8 13.7 1964 5.6 5.5 85.7 67.5 1998 8.9 8.1 17.9 13.4 1965 6.4 4.9 88.9 69.3 1999 9.6 7.8 20.4 14.3 1966 6.5 5.3 86.8 67.1 2000 10.4 7.9 21.1 16.3 1967 6.9 6.1 79.3 61.3 2001 9.5 6.9 23.0 18.1 1968 4.7 5.0 70.6 60.0 2002 7.9 7.1 23.5 17.2 1969 5.0 3.8 67.0 53.1 2003 10.0 6.9 22.5 17.4 1970 4.5 4.1 61.1 50.7 2004 8.0 7.9 25.2 19.3 1971 5.0 5.4 60.6 44.1 2005 8.2 6.6 24.0 21.6 1972 5.4 4.9 52.8 36.6 2006 9.4 6.8 28.3 20.3 1973 5.1 5.2 50.3 36.7 2007 9.5 7.0 30.2 24.2 Copyright © 2013 SciRes. 15 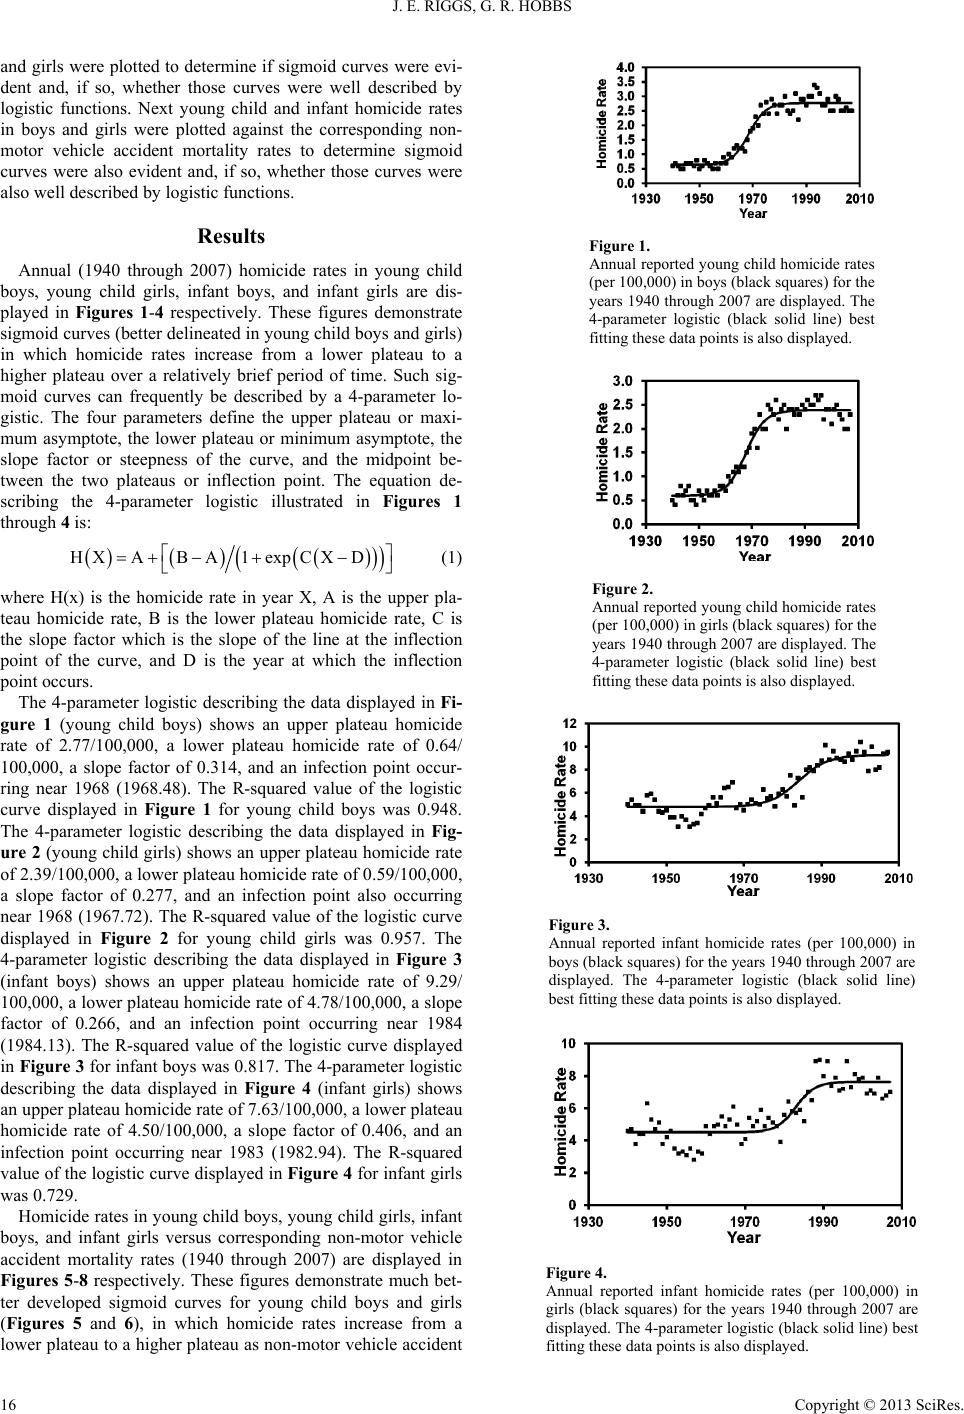 J. E. RIGGS, G. R. HOBBS Copyright © 2013 SciRes. 16 and girls were plotted to determine if sigmoid curves were evi- dent and, if so, whether those curves were well described by logistic functions. Next young child and infant homicide rates in boys and girls were plotted against the corresponding non- motor vehicle accident mortality rates to determine sigmoid curves were also evident and, if so, whether those curves were also well described by logistic functions. Results Figure 1. Annual reported young child homicide rates (per 100,000) in boys (black squares) for the years 1940 through 2007 are displayed. The 4-parameter logistic (black solid line) best fitting these data points is also displayed. Annual (1940 through 2007) homicide rates in young child boys, young child girls, infant boys, and infant girls are dis- played in Figures 1-4 respectively. These figures demonstrate sigmoid curves (better delineated in young child boys and girls) in which homicide rates increase from a lower plateau to a higher plateau over a relatively brief period of time. Such sig- moid curves can frequently be described by a 4-parameter lo- gistic. The four parameters define the upper plateau or maxi- mum asymptote, the lower plateau or minimum asymptote, the slope factor or steepness of the curve, and the midpoint be- tween the two plateaus or inflection point. The equation de- scribing the 4-parameter logistic illustrated in Figures 1 through 4 is: HXABA1 expCXD (1) Figure 2. Annual reported young child homicide rates (per 100,000) in girls (black squares) for the years 1940 through 2007 are displayed. The 4-parameter logistic (black solid line) best fitting these data points is also displayed. where H(x) is the homicide rate in year X, A is the upper pla- teau homicide rate, B is the lower plateau homicide rate, C is the slope factor which is the slope of the line at the inflection point of the curve, and D is the year at which the inflection point occurs. The 4-parameter logistic describing the data displayed in Fi- gure 1 (young child boys) shows an upper plateau homicide rate of 2.77/100,000, a lower plateau homicide rate of 0.64/ 100,000, a slope factor of 0.314, and an infection point occur- ring near 1968 (1968.48). The R-squared value of the logistic curve displayed in Figure 1 for young child boys was 0.948. The 4-parameter logistic describing the data displayed in Fig- ure 2 (young child girls) shows an upper plateau homicide rate of 2.39/100,000, a lower plateau homicide rate of 0.59/100,000, a slope factor of 0.277, and an infection point also occurring near 1968 (1967.72). The R-squared value of the logistic curve displayed in Figure 2 for young child girls was 0.957. The 4-parameter logistic describing the data displayed in Figure 3 (infant boys) shows an upper plateau homicide rate of 9.29/ 100,000, a lower plateau homicide rate of 4.78/100,000, a slope factor of 0.266, and an infection point occurring near 1984 (1984.13). The R-squared value of the logistic curve displayed in Figure 3 for infant boys was 0.817. The 4-parameter logistic describing the data displayed in Figure 4 (infant girls) shows an upper plateau homicide rate of 7.63/100,000, a lower plateau homicide rate of 4.50/100,000, a slope factor of 0.406, and an infection point occurring near 1983 (1982.94). The R-squared value of the logistic curve displayed in Figure 4 for infant girls was 0.729. Figure 3. Annual reported infant homicide rates (per 100,000) in boys (black squares) for the years 1940 through 2007 are displayed. The 4-parameter logistic (black solid line) best fitting these data points is also displayed. Homicide rates in young child boys, young child girls, infant boys, and infant girls versus corresponding non-motor vehicle accident mortality rates (1940 through 2007) are displayed in Figures 5-8 respectively. These figures demonstrate much bet- ter developed sigmoid curves for young child boys and girls (Figures 5 and 6), in which homicide rates increase from a lower plateau to a higher plateau as non-motor vehicle accident Figure 4. Annual reported infant homicide rates (per 100,000) in girls (black squares) for the years 1940 through 2007 are displayed. The 4-parameter logistic (black solid line) best fitting these data points is also displayed. 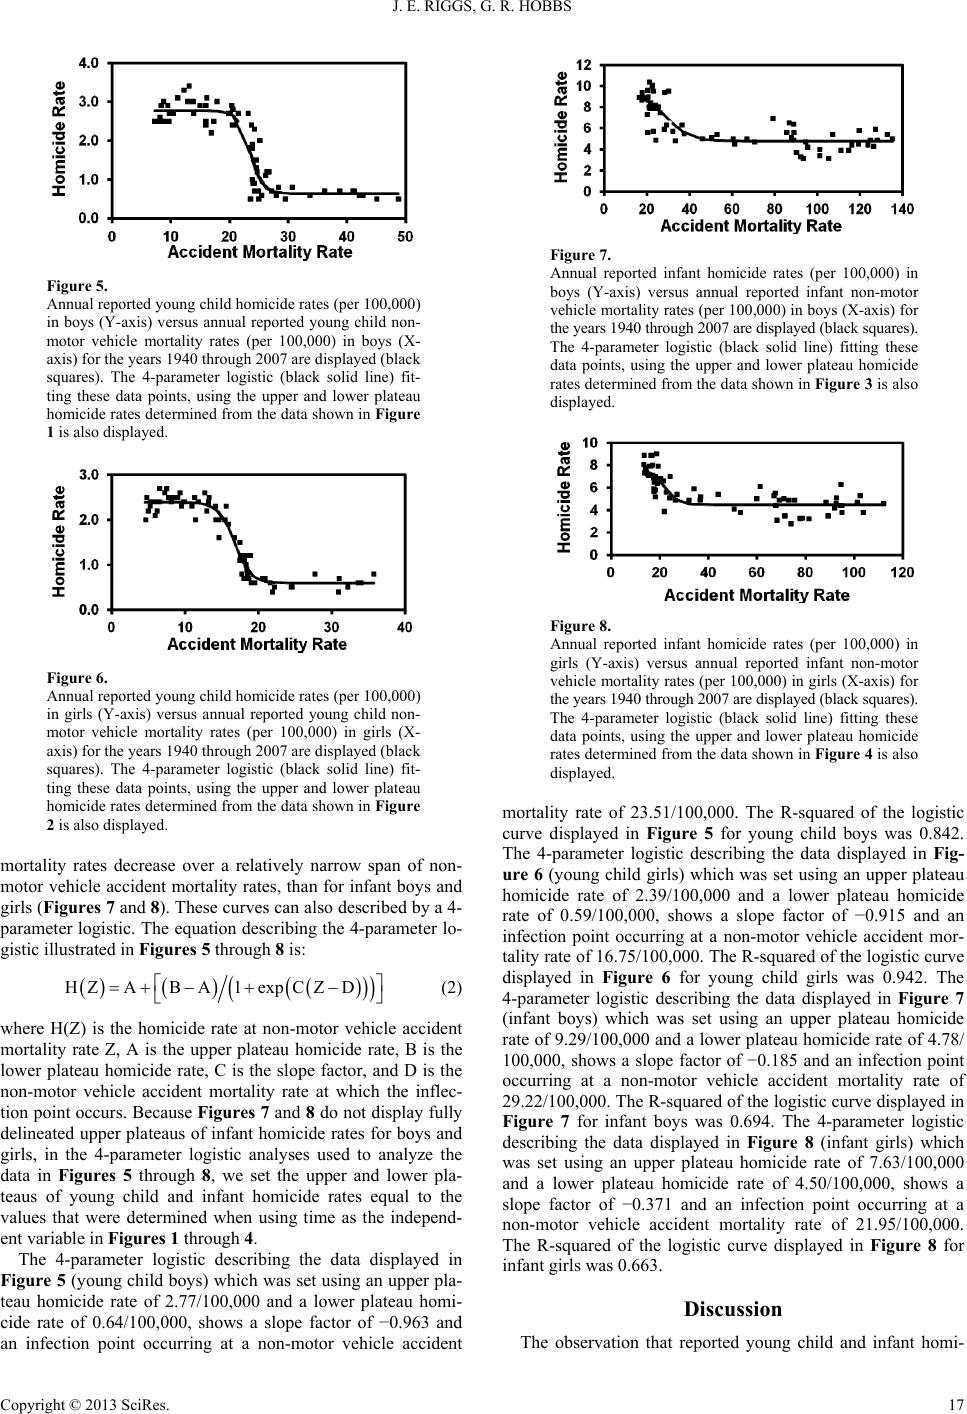 J. E. RIGGS, G. R. HOBBS Figure 5. Annual reported young child homicide rates (per 100,000) in boys (Y-axis) versus annual reported young child non- motor vehicle mortality rates (per 100,000) in boys (X- axis) for the years 1940 through 2007 are displayed (black squares). The 4-parameter logistic (black solid line) fit- ting these data points, using the upper and lower plateau homicide rates determined from the data shown in Figure 1 is also displayed. Figure 6. Annual reported young child homicide rates (per 100,000) in girls (Y-axis) versus annual reported young child non- motor vehicle mortality rates (per 100,000) in girls (X- axis) for the years 1940 through 2007 are displayed (black squares). The 4-parameter logistic (black solid line) fit- ting these data points, using the upper and lower plateau homicide rates determined from the data shown in Figure 2 is also displayed. mortality rates decrease over a relatively narrow span of non- motor vehicle accident mortality rates, than for infant boys and girls (Figures 7 and 8). These curves can also described by a 4- parameter logistic. The equation describing the 4-parameter lo- gistic illustrated in Figures 5 through 8 is: HZAB A1expCZD (2) where H(Z) is the homicide rate at non-motor vehicle accident mortality rate Z, A is the upper plateau homicide rate, B is the lower plateau homicide rate, C is the slope factor, and D is the non-motor vehicle accident mortality rate at which the inflec- tion point occurs. Because Figures 7 and 8 do not display fully delineated upper plateaus of infant homicide rates for boys and girls, in the 4-parameter logistic analyses used to analyze the data in Figures 5 through 8, we set the upper and lower pla- teaus of young child and infant homicide rates equal to the values that were determined when using time as the independ- ent variable in Figures 1 through 4. The 4-parameter logistic describing the data displayed in Figure 5 (young child boys) which was set using an upper pla- teau homicide rate of 2.77/100,000 and a lower plateau homi- cide rate of 0.64/100,000, shows a slope factor of −0.963 and an infection point occurring at a non-motor vehicle accident Figure 7. Annual reported infant homicide rates (per 100,000) in boys (Y-axis) versus annual reported infant non-motor vehicle mortality rates (per 100,000) in boys (X-axis) for the years 1940 through 2007 are displayed (black squares). The 4-parameter logistic (black solid line) fitting these data points, using the upper and lower plateau homicide rates determined from the data shown in Figure 3 is also displayed. Figure 8. Annual reported infant homicide rates (per 100,000) in girls (Y-axis) versus annual reported infant non-motor vehicle mortality rates (per 100,000) in girls (X-axis) for the years 1940 through 2007 are displayed (black squares). The 4-parameter logistic (black solid line) fitting these data points, using the upper and lower plateau homicide rates determined from the data shown in Figure 4 is also displayed. mortality rate of 23.51/100,000. The R-squared of the logistic curve displayed in Figure 5 for young child boys was 0.842. The 4-parameter logistic describing the data displayed in Fig- ure 6 (young child girls) which was set using an upper plateau homicide rate of 2.39/100,000 and a lower plateau homicide rate of 0.59/100,000, shows a slope factor of −0.915 and an infection point occurring at a non-motor vehicle accident mor- tality rate of 16.75/100,000. The R-squared of the logistic curve displayed in Figure 6 for young child girls was 0.942. The 4-parameter logistic describing the data displayed in Figure 7 (infant boys) which was set using an upper plateau homicide rate of 9.29/100,000 and a lower plateau homicide rate of 4.78/ 100,000, shows a slope factor of −0.185 and an infection point occurring at a non-motor vehicle accident mortality rate of 29.22/100,000. The R-squared of the logistic curve displayed in Figure 7 for infant boys was 0.694. The 4-parameter logistic describing the data displayed in Figure 8 (infant girls) which was set using an upper plateau homicide rate of 7.63/100,000 and a lower plateau homicide rate of 4.50/100,000, shows a slope factor of −0.371 and an infection point occurring at a non-motor vehicle accident mortality rate of 21.95/100,000. The R-squared of the logistic curve displayed in Figure 8 for infant girls was 0.663. Discussion The observation that reported young child and infant homi- Copyright © 2013 SciRes. 17 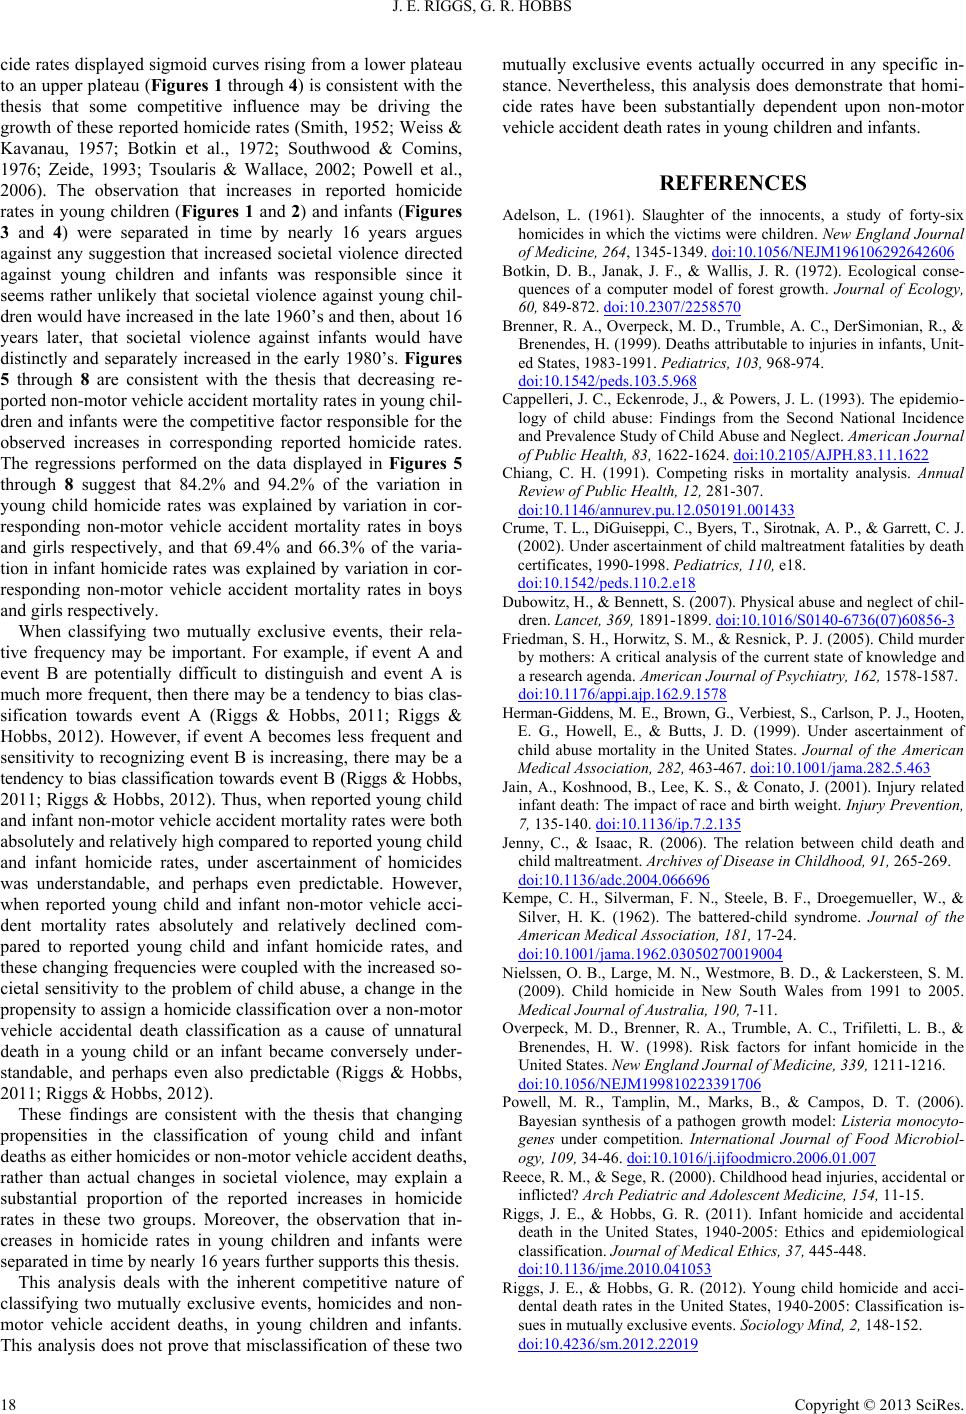 J. E. RIGGS, G. R. HOBBS cide rates displayed sigmoid curves rising from a lower plateau to an upper plateau (Figures 1 through 4) is consistent with the thesis that some competitive influence may be driving the growth of these reported homicide rates (Smith, 1952; Weiss & Kavanau, 1957; Botkin et al., 1972; Southwood & Comins, 1976; Zeide, 1993; Tsoularis & Wallace, 2002; Powell et al., 2006). The observation that increases in reported homicide rates in young children (Figures 1 and 2) and infants (Figures 3 and 4) were separated in time by nearly 16 years argues against any suggestion that increased societal violence directed against young children and infants was responsible since it seems rather unlikely that societal violence against young chil- dren would have increased in the late 1960’s and then, about 16 years later, that societal violence against infants would have distinctly and separately increased in the early 1980’s. Figures 5 through 8 are consistent with the thesis that decreasing re- ported non-motor vehicle accident mortality rates in young chil- dren and infants were the competitive factor responsible for the observed increases in corresponding reported homicide rates. The regressions performed on the data displayed in Figures 5 through 8 suggest that 84.2% and 94.2% of the variation in young child homicide rates was explained by variation in cor- responding non-motor vehicle accident mortality rates in boys and girls respectively, and that 69.4% and 66.3% of the varia- tion in infant homicide rates was explained by variation in cor- responding non-motor vehicle accident mortality rates in boys and girls respectively. When classifying two mutually exclusive events, their rela- tive frequency may be important. For example, if event A and event B are potentially difficult to distinguish and event A is much more frequent, then there may be a tendency to bias clas- sification towards event A (Riggs & Hobbs, 2011; Riggs & Hobbs, 2012). However, if event A becomes less frequent and sensitivity to recognizing event B is increasing, there may be a tendency to bias classification towards event B (Riggs & Hobbs, 2011; Riggs & Hobbs, 2012). Thus, when reported young child and infant non-motor vehicle accident mortality rates were both absolutely and relatively high compared to reported young child and infant homicide rates, under ascertainment of homicides was understandable, and perhaps even predictable. However, when reported young child and infant non-motor vehicle acci- dent mortality rates absolutely and relatively declined com- pared to reported young child and infant homicide rates, and these changing frequencies were coupled with the increased so- cietal sensitivity to the problem of child abuse, a change in the propensity to assign a homicide classification over a non-motor vehicle accidental death classification as a cause of unnatural death in a young child or an infant became conversely under- standable, and perhaps even also predictable (Riggs & Hobbs, 2011; Riggs & Hobbs, 2012). These findings are consistent with the thesis that changing propensities in the classification of young child and infant deaths as either homicides or non-motor vehicle accident deaths, rather than actual changes in societal violence, may explain a substantial proportion of the reported increases in homicide rates in these two groups. Moreover, the observation that in- creases in homicide rates in young children and infants were separated in time by nearly 16 years further supports this thesis. This analysis deals with the inherent competitive nature of classifying two mutually exclusive events, homicides and non- motor vehicle accident deaths, in young children and infants. This analysis does not prove that misclassification of these two mutually exclusive events actually occurred in any specific in- stance. Nevertheless, this analysis does demonstrate that homi- cide rates have been substantially dependent upon non-motor vehicle accident death rates in young children and infants. REFERENCES Adelson, L. (1961). Slaughter of the innocents, a study of forty-six homicides in which the victims were children. New England Journal of Medicine, 264, 1345-1349. doi:10.1056/NEJM196106292642606 Botkin, D. B., Janak, J. F., & Wallis, J. R. (1972). Ecological conse- quences of a computer model of forest growth. Journal of Ecology, 60, 849-872. doi:10.2307/2258570 Brenner, R. A., Overpeck, M. D., Trumble, A. C., DerSimonian, R., & Brenendes, H. (1999). Deaths attributable to injuries in infants, Unit- ed States, 1983-1991. Pediatrics, 103, 968-974. doi:10.1542/peds.103.5.968 Cappelleri, J. C., Eckenrode, J., & Powers, J. L. (1993). The epidemio- logy of child abuse: Findings from the Second National Incidence and Prevalence Study of Child Abuse and Neglect. American Journal of Public Health, 83, 1622-1624. doi:10.2105/AJPH.83.11.1622 Chiang, C. H. (1991). Competing risks in mortality analysis. Annual Review of Public Health, 12, 281-307. doi:10.1146/annurev.pu.12.050191.001433 Crume, T. L., DiGuiseppi, C., Byers, T., Sirotnak, A. P., & Garrett, C. J. (2002). Under ascertainment of child maltreatment fatalities by death certificates, 1990-1998. Pediatrics, 1 10 , e18. doi:10.1542/peds.110.2.e18 Dubowitz, H., & Bennett, S. (2007). Physical abuse and neglect of chil- dren. Lancet, 369, 1891-1899. doi:10.1016/S0140-6736(07)60856-3 Friedman, S. H., Horwitz, S. M., & Resnick, P. J. (2005). Child murder by mothers: A critical analysis of the current state of knowledge and a research agenda. American Journ al of Psychiatry, 162, 1578-1587. doi:10.1176/appi.ajp.162.9.1578 Herman-Giddens, M. E., Brown, G., Verbiest, S., Carlson, P. J., Hooten, E. G., Howell, E., & Butts, J. D. (1999). Under ascertainment of child abuse mortality in the United States. Journal of the American Medical Association, 282, 463-467. doi:10.1001/jama.282.5.463 Jain, A., Koshnood, B., Lee, K. S., & Conato, J. (2001). Injury related infant death: The impact of race and birth weight. Injury Prevention, 7, 135-140. doi:10.1136/ip.7.2.135 Jenny, C., & Isaac, R. (2006). The relation between child death and child maltreatment. Archives of Disease in Childhood, 9 1 , 265-269. doi:10.1136/adc.2004.066696 Kempe, C. H., Silverman, F. N., Steele, B. F., Droegemueller, W., & Silver, H. K. (1962). The battered-child syndrome. Journal of the American Medical Association, 181, 17-24. doi:10.1001/jama.1962.03050270019004 Nielssen, O. B., Large, M. N., Westmore, B. D., & Lackersteen, S. M. (2009). Child homicide in New South Wales from 1991 to 2005. Medical Journal of Austral i a, 190, 7-11. Overpeck, M. D., Brenner, R. A., Trumble, A. C., Trifiletti, L. B., & Brenendes, H. W. (1998). Risk factors for infant homicide in the United States. New England Journal of Medicine, 339, 1211-1216. doi:10.1056/NEJM199810223391706 Powell, M. R., Tamplin, M., Marks, B., & Campos, D. T. (2006). Bayesian synthesis of a pathogen growth model: Listeria monocyto- genes under competition. International Journal of Food Microbiol- ogy, 109, 34-46. doi:10.1016/j.ijfoodmicro.2006.01.007 Reece, R. M., & Sege, R. (2000). Childhood head injuries, accidental or inflicted? Arch Pediatric and Adolescent Medicine, 154, 11-15. Riggs, J. E., & Hobbs, G. R. (2011). Infant homicide and accidental death in the United States, 1940-2005: Ethics and epidemiological classification. Journal o f M e d i c a l Ethics, 37, 445-448. doi:10.1136/jme.2010.041053 Riggs, J. E., & Hobbs, G. R. (2012). Young child homicide and acci- dental death rates in the United States, 1940-2005: Classification is- sues in mutually exclusive events. Socio log y M ind , 2, 148-152. doi:10.4236/sm.2012.22019 Copyright © 2013 SciRes. 18  J. E. RIGGS, G. R. HOBBS Copyright © 2013 SciRes. 19 Smith, F. E. (1952). Experimental methods in population dynamics: A critique. Ecology, 33, 441-450. doi:10.2307/1931519 Southwood, T. R. E., & Comins, H. N. (1976). A syntopic population model. Journal of Anim a l Ecology, 45, 949-965. doi:10.2307/3591 Tsoularis, A., & Wallace, J. (2002). Analysis of logistic growth models. Mathamatical Biosc i e nces, 179, 21-55. doi:10.1016/S0025-5564(02)00096-2 Tung, G. A., Kumar, M., Richardson, R. C., Jenny, C., & Brown, W. D. (2006). Comparison of accidental and non-accidental head injury in children on noncontrast computed tomography. Pediatrics, 118, 626- 633. doi:10.1542/peds.2006-0130 Weiss, P., & Kavanau, J. L. (1957). A model of growth and growth control in mathematical terms. Journal of General Physiology, 41, 1-47. doi:10.1085/jgp.41.1.1 Zeide, B. (1993). Analysis of growth equations. Forest Science, 39, 594-616. |