

Paper Menu >>
Journal Menu >>
 Journal of Cancer Therapy, 2013, 4, 452-459 http://dx.doi.org/10.4236/jct.2013.43A055 Published Online March 2013 (http://www.scirp.org/journal/jct) Absolute Lymphocyte/Monocyte Ratio at Diagnosis and Interim Positron-Emission Tomography Predict Survival in Classical Hodgkin Lymphoma Luis F. Porrata*, Kay M. Ristow, Thomas M. Habermann, Thomas E. Witzig, Joseph P. Colgan, David J. Inwards, Stephen M. Ansell, Ivana N. Micallef, Patrick B. Johnston, Grzegorz Nowakowski, Carrie A.Thompson, Svetomir N. Markovic Division of Hematology, Internal Medicine, Mayo College of Medicine, Rochester, USA. Email: *[email protected] Received January 15th, 2013; revised February 17th, 2013; accepted February 26th, 2013 ABSTRACT Interim Positron-Emission Tomography (int-PET) and the peripheral blood absolute lymphocyte/monocyte ratio at di- agnosis (ALC/AMC-DX) have been shown to be predictors for progression-free survival (PFS) and time to progression (TTP) in classical Hodgkin lymphoma (cHL). Therefore, we studied if the combination of ALC/AMC-DX and the (int-PET) can further stratified PFS and TTP in cHL patients. Patients were required to be diagnosed, treated, and fol- lowed with int-PET at Mayo Clinic, Rochester, Minnesota. From 2000 until 2008, 111 cHL patients qualified for the study. The median follow-up was 2.8 years (range: 0.3 - 10.4 years). Patients with a negative int-PET (N = 98) pre- sented with a higher ALC/AMC-DX (median of 2.32, range: 0.26 - 37.5) compared with patients with a positive int-PET (N = 13) (median of 0.9, range: 0.29 - 3.10), p < 0.004. By multivariate analysis, ALC/AMC-DX and the int-PET were independent predictors for PFS and TTP, when compared with the International prognostic Score. Patients were stratified into four groups: group 1 included patients with a negative int-PET and ALC/AMC-DX ≥ 1.1; group 2 included positive int-PET and ALC/AMC-DX ≥ 1.1; group 3 included negative int-PET and ALC/AMC-DX < 1.1; and group 4 included positive int-PET and ALC/AMC-DX < 1.1. Group 1 experienced superior PFS and TTP in compari- son with the other groups. In conclusion, the combination of ALC/AMC-DX and the int-PET provides a simple model to assess clinical outcomes in cHL. Keywords: Classical Hodgkin Lymphoma; Absolute Lymphocyte/Monocyte Ratio at Diagnosis; Interim PET-Scan; Progression-Free Survival; Time to Progression 1. Introduction The peripheral blood absolute lymphocyte/monocyte ratio at diagnosis (ALC/AMC-DX), as a surrogate biomarker of host immunity (i.e., ALC) and tumor microenviron- ment (i.e., AMC), has been recently reported to be a pre- dictor for overall survival, lymphoma-specific survival, progression-free survival, and time to progression in clas- sical Hodgkin lymphoma (cHL) [1,2]. Interim Positron- Emission Tomography (int-PET), as a functional imaging test for tumor activity, has been shown to be a predictor for progression-free survival (PFS) and time to progres- sion (TTP) in cHL [3]. Romano et al. [4] reported that even though the ALC/AMC ratio correlated with prog- nosis, the int-PET was better discriminator of survival than the ALC/AMC ratio. Therefore, in an attempt to validate Romano’s findings, we studied if the ALC/AMC-DX is an independent pre- dictor in comparison with the int-PET for PFS and TTP and if the combination of ALC/AMC-DX and the int- PET can further stratified the clinical outcomes of PFS and TTP in patients with cHL. 2. Patients and Methods 2.1. Patient Population In order to participate in the study patients were required to have newly diagnosed cHL, treated with adriamycin, bleomycin, vinblastine, and dacarbazine (ABVD) with or without radiation, had an int-PET before cycle number 3, and be followed at the Mayo Clinic, Rochester, Minne- sota. Patients diagnosed with nodular lymphocyte predomi- nant Hodgkin’s lymphoma, treated only with radiation or palliative care, positive for human immunodeficiency *Corresponding author. Copyright © 2013 SciRes. JCT  Absolute Lymphocyte/Monocyte Ratio at Diagnosis and Interim Positron-Emission Tomography Predict Survival in Classical Hodgkin Lymphoma 453 virus and with concomitant autoimmune disease receiv- ing immunosuppressive therapy were excluded. From 2000 to 2008, 111 consecutive cHL qualified for the study. No patients refused authorization to use their me- dical records for research and none was lost to follow-up. Approval for the retrospective review of these patients’ records was obtained from the Mayo Clinic Institutional Review Board and the research was conducted in accor- dance with the USA federal regulations and the Declara- tion of Helsinki. 2.2. End-Point The primary end-point of the study was to assess if the combination of ALC/AMC-DX and the int-PET can fur- ther stratified the clinical outcomes of PFS and TTP in patients with cHL. The cut-off for the ALC/AMC-DX ≥ 1.1 used in this study was based on our previous publication [1] and ob- tained from the complete blood cell count (CBC) at diag- nosis of cHL. The ALC/AMC ratio was obtained by di- viding the absolute lymphocyte count (ALC) over the ab- solute monocyte count (AMC) from the CBC at diagno- sis [5]. 2.3. Prognostic Factors The prognostic factors evaluated in the study included the International Prognostic Score (IPS) [6] at diagnosis for advanced stage patients : [age > 45 years, albumin < 4 g/dl, ALC < 600/µl or < 8% of white cell count, hemo- globin < 10.5 g/dl, male gender, stage IV, and white blood cell count ≥ 15,000/µl]; treatment modality (com- bination chemotherapy plus radiation versus chemother- apy alone), limited versus advanced disease, AMC at diag- nosis, ALC/AMC ratio at diagnosis, and interim PET- scan. 2.4. Response and Survival Definitions of response criteria, PFS, and TTP were ba- sed on the guidelines from the International Harmoniza- tion Project Lymphoma [7]. PFS was defined as the time from cHL diagnosis to the time to progression, relapse from complete response, death as a result of any cause, or last follow-up. TTP was defined as the time from cHL diagnosis to the time of lymphoma progression, death as a result of lymphoma, or last follow-up. 2.5. Statistical Analysis PFS and TTP were analyzed using the approach of Kap- lan and Meier [8]. Differences between survival curves were tested for statistical significance using the two- tailed log-rank test. The Cox proportional hazard model [9] was used for the univariate and multivariate analyses to evaluate the variables under the prognostic factors’ section to assess their impact on PFS and TTP. Chi- square tests were used to determine relationships be- tween categorical variables. The Wilcoxon-rank test was used to determine associations between continuous vari- ables and categories, and Spearman’s correlation coeffi- cients were used to evaluate associations for continuous variables. All p values are two-sided associations and p values less than 0.5 are considered statistically signifi- cant. 3. Results 3.1. Patients Characteristics The median age at diagnosis for this cohort of 111 cHL patients was 37 years (range: 18 - 83 years). The distri- bution of additional baseline characteristics for these pa- tients is presented in Table 1. The median follow-up pe- riod for the cohort was 2.8 years (range: 0.3 - 10.4 years) and for living patients (N = 99) was 3.0 years (range: 0.3 - 10.4 years). Six patients died of causes not related to lymphoma or the treatment of lymphoma, and 6 patients did secondary to relapse/progression of lymphoma. 3.2. ALC/AMC-DX, Int-PET, and Progression-Free Survival and Time to Progression Kaplan-Meier analysis was used to study the PFS and TTP based on the ALC/AMC-DX and int-PET. Patients with an ALC/AMC-DX ≥ 1.1 experienced superior PFS (Figure 1(a)) and TTP (Figure 1(b)) compared with patients with an ALC/AMC-DX < 1.1 [PFS: median was not reached vs 8.6 years, 3-year PFS rates of 92% (95% CI, 83% - 99%) vs 50% (95% CI, 18% - 80%), p < 0.0001, respectively; and TTP: median was not reached vs not reached, 3-year TTP rates of 96% (95% CI, 87% - 100%) vs 55% (95% CI, 20% - 77%), p < 0.0001, re- spectively]. Similarly, patients with a negative int-PET also experienced superior PFS (Figure 1(c)) and TTP (Figure 1(d)) compared with patients with a positive int- PET [PFS: median was not reached vs 2.1 years, 3-year PFS rates of 91% (95% CI, 85% - 98%) vs 45% (95% CI, 10% - 80%), p < 0.0001, respectively; and TTP: median was not reached vs 2.1 years, 3-year TTP rates of 98% (95% CI, 84% - 100%) vs 45% (95% CI, 10% - 82%), p < 0.0001, respectively]. By univariate analysis (Table 2), both ALC/AMC-DX and int-PET were predictors for PFS and TTP. Due to the strong correlation between ALC (r = 0.5, p < 0.0001) and AMC (r = −0.4, p < 0.0001), we only included the ALC/AMC-DX in the multivariate analysis to prevent co-linearity. Similarly, both age and stage are included in Copyright © 2013 SciRes. JCT 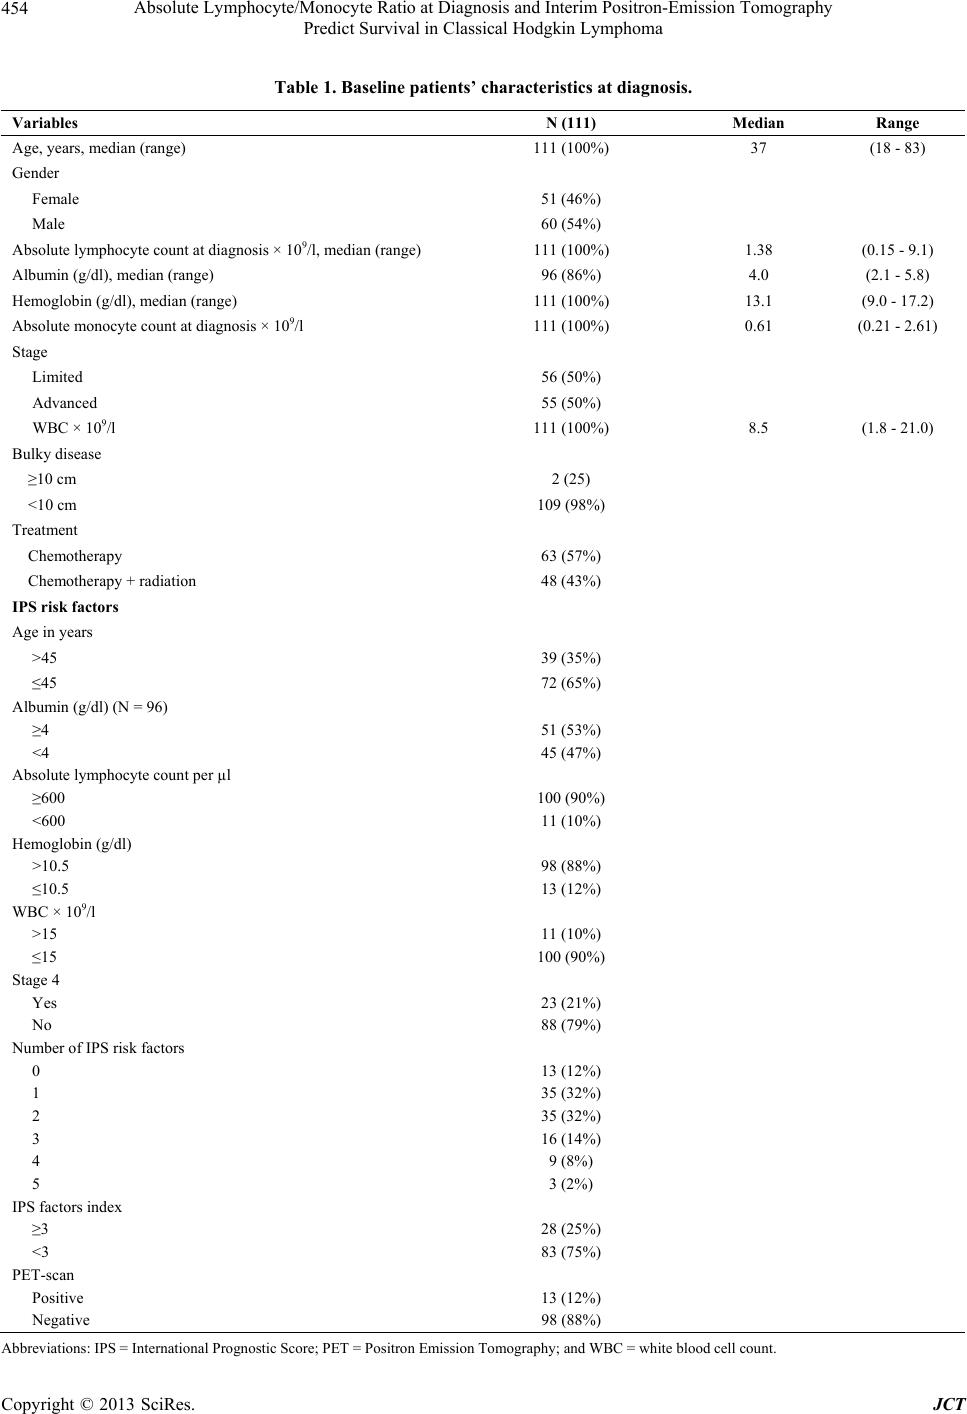 Absolute Lymphocyte/Monocyte Ratio at Diagnosis and Interim Positron-Emission Tomography Predict Survival in Classical Hodgkin Lymphoma Copyright © 2013 SciRes. JCT 454 Table 1. Baseline patients’ characteristics at diagnosis. Variables N (111) Median Range Age, years, median (range) 111 (100%) 37 (18 - 83) Gender Female 51 (46%) Male 60 (54%) Absolute lymphocyte count at diagnosis × 109/l, median (range) 111 (100%) 1.38 (0.15 - 9.1) Albumin (g/dl), median (range) 96 (86%) 4.0 (2.1 - 5.8) Hemoglobin (g/dl), median (range) 111 (100%) 13.1 (9.0 - 17.2) Absolute monocyte count at diagnosis × 109/l 111 (100%) 0.61 (0.21 - 2.61) Stage Limited 56 (50%) Advanced 55 (50%) WBC × 109/l 111 (100%) 8.5 (1.8 - 21.0) Bulky disease ≥10 cm 2 (25) <10 cm 109 (98%) Treatment Chemotherapy 63 (57%) Chemotherapy + radiation 48 (43%) IPS risk factors Age in years >45 39 (35%) ≤45 72 (65%) Albumin (g/dl) (N = 96) ≥4 51 (53%) <4 45 (47%) Absolute lymphocyte count per µl ≥600 100 (90%) <600 11 (10%) Hemoglobin (g/dl) >10.5 98 (88%) ≤10.5 13 (12%) WBC × 109/l >15 11 (10%) ≤15 100 (90%) Stage 4 Yes 23 (21%) No 88 (79%) Number of IPS risk factors 0 13 (12%) 1 35 (32%) 2 35 (32%) 3 16 (14%) 4 9 (8%) 5 3 (2%) IPS factors index ≥3 28 (25%) <3 83 (75%) PET-scan Positive 13 (12%) Negative 98 (88%) Abbreviations: IPS = International Prognostic Score; PET = Positron Emission Tomography; and WBC = white blood cell count. 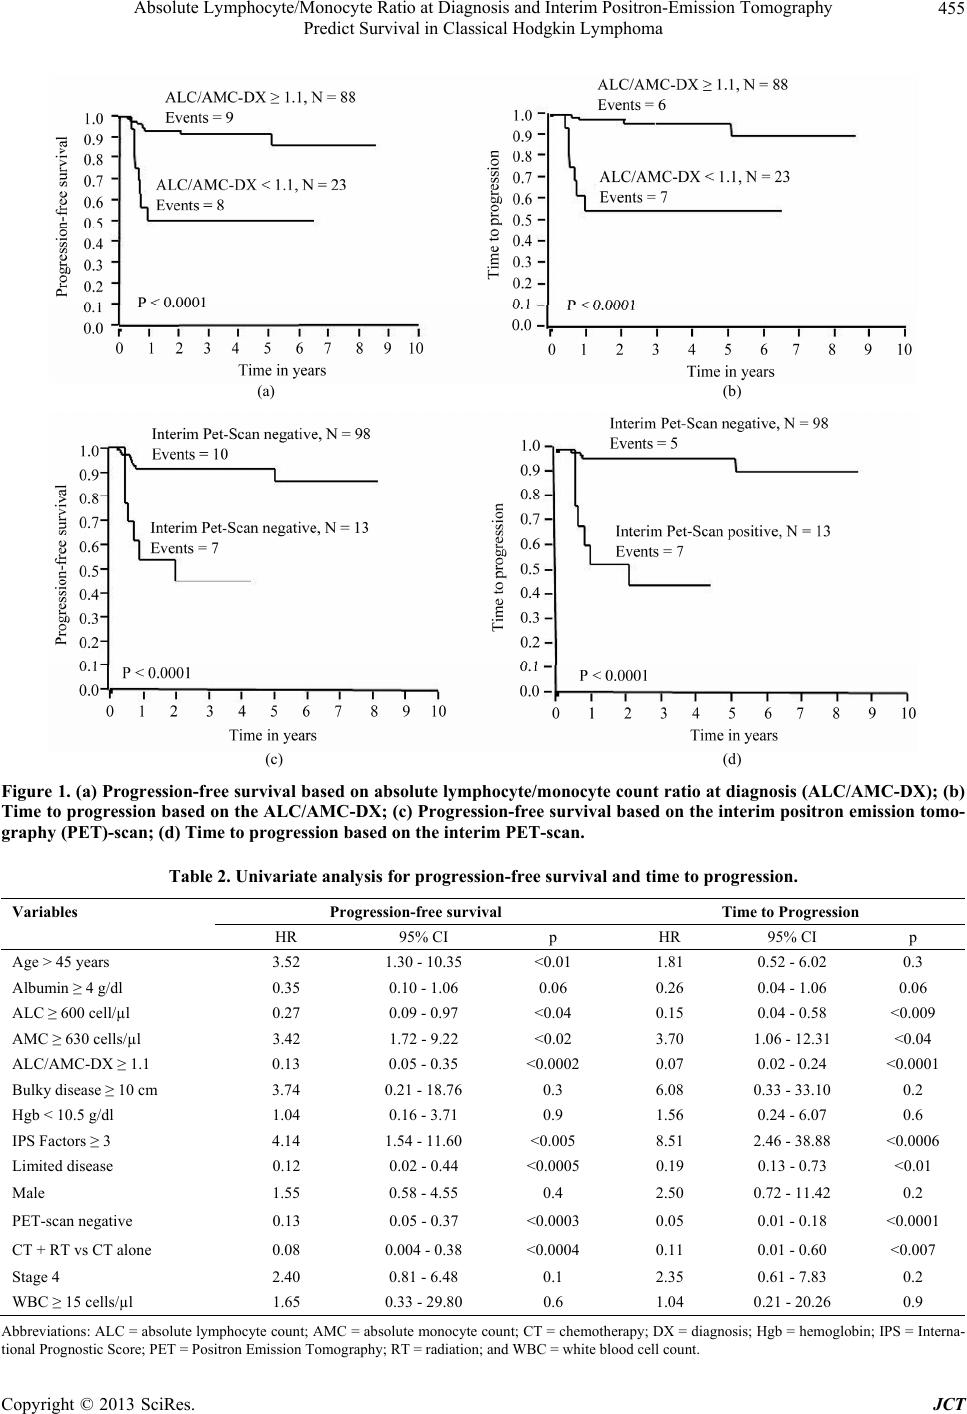 Absolute Lymphocyte/Monocyte Ratio at Diagnosis and Interim Positron-Emission Tomography Predict Survival in Classical Hodgkin Lymphoma 455 (a) (b) (c) (d) Figure 1. (a) Progression-free survival based on absolute lymphocyte/monocyte count ratio at diagnosis (ALC/AMC-DX); (b) Time to progression based on the ALC/AMC-DX; (c) Progression-free survival based on the interim positron emission tomo- graphy (PET)-scan; (d) Time to progression based on the interim PET-scan. Table 2. Univariate analysis for progression-free survival and time to progression. Variables Progression-free survival Time to Progression HR 95% CI p HR 95% CI p Age > 45 years 3.52 1.30 - 10.35 <0.01 1.81 0.52 - 6.02 0.3 Albumin ≥ 4 g/dl 0.35 0.10 - 1.06 0.06 0.26 0.04 - 1.06 0.06 ALC ≥ 600 cell/µl 0.27 0.09 - 0.97 <0.04 0.15 0.04 - 0.58 <0.009 AMC ≥ 630 cells/µl 3.42 1.72 - 9.22 <0.02 3.70 1.06 - 12.31 <0.04 ALC/AMC-DX ≥ 1.1 0.13 0.05 - 0.35 <0.0002 0.07 0.02 - 0.24 <0.0001 Bulky disease ≥ 10 cm 3.74 0.21 - 18.76 0.3 6.08 0.33 - 33.10 0.2 Hgb < 10.5 g/dl 1.04 0.16 - 3.71 0.9 1.56 0.24 - 6.07 0.6 IPS Factors ≥ 3 4.14 1.54 - 11.60 <0.005 8.51 2.46 - 38.88 <0.0006 Limited disease 0.12 0.02 - 0.44 <0.0005 0.19 0.13 - 0.73 <0.01 Male 1.55 0.58 - 4.55 0.4 2.50 0.72 - 11.42 0.2 PET-scan negative 0.13 0.05 - 0.37 <0.0003 0.05 0.01 - 0.18 <0.0001 CT + RT vs CT alone 0.08 0.004 - 0.38 <0.0004 0.11 0.01 - 0.60 <0.007 Stage 4 2.40 0.81 - 6.48 0.1 2.35 0.61 - 7.83 0.2 WBC ≥ 15 cells/µl 1.65 0.33 - 29.80 0.6 1.04 0.21 - 20.26 0.9 Abbreviations: ALC = absolute lymphocyte count; AMC = absolute monocyte count; CT = chemotherapy; DX = diagnosis; Hgb = hemoglobin; IPS = Interna- tional Prognostic Score; PET = Positron Emission Tomography; RT = radiation; and WBC = white blood cell count. Copyright © 2013 SciRes. JCT  Absolute Lymphocyte/Monocyte Ratio at Diagnosis and Interim Positron-Emission Tomography Predict Survival in Classical Hodgkin Lymphoma Copyright © 2013 SciRes. JCT 456 the IPS, we only included IPS in the multivariate analysis. In a multivariate Cox regression model (Table 3), both ALC/AMC-DX and int-PET were the only two statisti- cally significant independent predictors for PFS and TTP. Since ALC/AMC-DX and int-PET were the only inde- pendent predictors in the initial multivariate analysis, we compared them in a subsequent multivariate analysis adjusting for each of them separately. Both remained still independent predictors for PFS [ALC/AMC-DX: HR = 0.51, 95% CI, 0.27 - 0.85, p < 0.005 and int-PET: HR = 0.24, 95% CI, 0.07 - 0.76, p < 0.02] and for TTP [ALC/ AMC-DX: HR = 0.42, 95% CI, 0.17 - 0.83, p < 0.006 and int-PET: HR = 0.11, 95% CI, 0.02 - 0.44, p < 0.002]. 3.3. Association between ALC/AMC-DX and Int-PET Because in this cohort of patients, only the ALC/AMC- DX and int-PET were the only independent predictors for PFS and TTP, we set out to investigate if there was any association between the ALC/ACM-DX and int-PET. By the Wilcoxon-rant test, patients with a negative int-PET (n = 98) presented with higher ALC/ AMC-DX (median of 2.32, range: 0.26 - 37.5) compared with patients with a positive int-PET (n = 13) (median of 0.9, range: 0.29 - 3.10), p < 0.004 (Figure 2). Ninety percent (88/98) of patients with an ALC/AMC-DX ≥ 1.1 achieved a nega- tive int-PET compared to only 10% (10/98) of patients with an ALC/AMC-DX < 1.1, p < 0.0006. 3.4. ALC/AMC-DX and Int-PET Stratified Groups Because both the ALC/AMC-DX and int-PET were in- dependent predictors for PFS and TTP, patients were stratified into four groups: group 1 included patients with a negative int-PET and ALC/AMC-DX ≥ 1.1; group 2 included positive int-PET and ALC/AMC-DX ≥ 1.1; group 3 included negative int-PET and ALC/AMC-DX < 1.1; and group 4 included positive int-PET and ALC/ AMC-DX < 1.1. The three year PFS rates (Figure 3(a)) for each group were: 95% (group 1); 45% (group 2); 56% (group 3); and 50% (group 4), p < 0.0001. The three year TTP rates (Figure 3(b)) for each group were: 100% (group 1); 40% (group 2); 65% (group 3); and 50% (group 4), p < 0.0001. 3.5. PFS and TTP Based on ALC/AMC-DX and Int-PET by Limited/Advanced Stage Because the IPS is only limited to advance stage cHL, we analyzed if both the ALC/AMC-DX and int-PET are pre- dictors for PFS and TTP based on limited/advanced stage. Table 4 summarizes the univariate analysis for PFS and TTP based on ALC/AMC-DX and int-PET according to the sub-groups of limited stage and advanced stage. The ALC/AMC-DX and int-PET were predictors for PFS and TTP regardless of limited stage or advanced stage. We also compared group 1 (negative int-PET and ALC/AMC- Table 3. Multivariate analysis progression-free survival and time to progression. Variables Progression-free survival Time to progression ALC/AMC-DX ≥ 1.1 0.63 0.33 - 0.90 <0.04 0.16 0.03 - 0.63 <0.004 IPS Factors ≥ 3 2.47 0.83 - 7.60 0.1 1.72 0.58 - 8.80 0.5 PET-scan negative 0.22 0.07 - 0.71 <0.02 0.07 0.01 - 0.31 <0.0004 CT + RT vs CT alone 0.22 0.01 - 2.89 0.4 0.17 0.01 - 2.79 0.2 Abbreviations: ALC = absolute lymphocyte count; AMC = absolute monocyte count; CT = chemotherapy; DX = diagnosis; IPS = International Prognostic Score; PET = Positron Emission Tomography; and RT = radiation. Table 4. Univariate analysis based on ALC/AMC-DX and int-PET according to limited stage and advanced stage. Limited stage Advanced stage Progression-free survival ALC/AMC-DX ≥ 1.1 0.07 0.01 - 0.21 <0.0007 0.58 0.33 - 0.95 <0.02 Int-PET negative 0.10 0.02 - 0.20 <0.002 0.26 0.09 - 0.82 <0.03 Group 1 versus other 0.04 0.01 - 0.18 <0.002 0.26 0.08 - 0.76 <0.01 Time to progression ALC/AMC-DX ≥ 1.1 0.06 0.01 - 0.22 <0.0007 0.41 0.11 - 0.82 <0.007 Int-PET negative 0.11 0.03 - 0.21 <0.002 0.10 0.20 - 0.30 <0.002 Group 1 versus other 0.05 0.02-0.17 <0.002 0.05 0.01 - 0.30 <0.0003 Abbreviations: ALC = absolute lymphocyte count; AMC = absolute monocyte count; DX = diagnosis; group 1= negative int-PET and ALC/AMC-DX ≥ 1.1; and PET = Positron Emission Tomography.  Absolute Lymphocyte/Monocyte Ratio at Diagnosis and Interim Positron-Emission Tomography Predict Survival in Classical Hodgkin Lymphoma 457 Figure 2. Box plot showing patients with a negative interim positron emission tomography (PET)-scan presented with higher absolute lymphocyte/monocyte count at diagnosis (ALC/AMC-DX) (median of 2.32, range: 0.26 - 37.5) com- pared with patients with a positive interim PET-scan (me- dian of 0.9, range: 0.29 - 3.10). DX ≥ 1.1) versus other stratified groups described in the above 3.4 sub-heading. The stratified group 1 was also a predictor for PFS and TTP regardless of limited or ad- vanced stage. Due to the small numbers of events by each sub-group, multivariate analysis was not performed. 4. Discussion The int-PET representing a functional imaging test for tumor burden activity and the ALC/AMC-DX represent- ing a surrogate biomarker for the interaction between host immunity and tumor microenvironment have been reported to predict clinical outcomes, specifically PFS and TTP in cHL. We, therefore, combined the int-PET and the ALC/AMC-DX as representative markers of the interaction between tumor burden, host immunity, and tumor microenvironment to further stratified clinical out- comes in cHL. To support the hypothesis that the combination of the int-PET and the ALC/AMC-DX can further stratified PFS and TTP in CHL patients, it was necessary to de- monstrate that both int-PET and the ALC/AMC-DX were independent predictors of PFS and TTP in cHL. In our cohort, by univariate analysis, both the int-PET and the ALC/AMC-DX were predictors for PFS and TTP. By multivariate analysis, both the int-PET and the ALC/ AMC-DX remained independent predictors for PFS and TTP when compared with the International Prognostic Score, limited or advanced disease, and chemotherapy with or without radiation. Because the int-PET and the ALC/AMC-DX in cohort of patients were the only two (a) (b) Figure 3. (a) Superior progression-free survival observed in patients in group 1 compared with the other groups; (b) Superior time to progression observed in patients in group 1 compared with the other groups. Group 1 = negative in- terim positron emission tomography (PET)-scan and abso- lute lymphocyte/monocyte count ratio at diagnosis (ALC/ AMC-DX) ≥ 1.1; group 2 = positive interim PET-scan and ALC/AMCDX ≥ 1.1; group 3 = negative interim PET-scan and ALC/AMC-DX < 1.1; and group 4 = positive interim PET-scan and ALC/AMC-DX< 1.1. independent predictors for PFS and TTP, this finding led to investigate if there was any association between them. Patients with a negative int-PET presented with higher ALC/AMC-DX compared with patients with a positive int-PET. Furthermore, ninety percent of patients with an ALC/AMC-DX ≥ 1.1 achieved a negative int-PET. The strong association between the int-PET and the ALC/ AMC-DX indirectly supports the crucial interaction be- tween host immunity (i.e., ALC), tumor microenviron- ment (i.e., AMC) and tumor burden (i.e., int-PET). To further clinically support the importance of the interac- tion between host immunity, tumor microenvironment and tumor burden using the int-PET and the ALC/AMC- Copyright © 2013 SciRes. JCT  Absolute Lymphocyte/Monocyte Ratio at Diagnosis and Interim Positron-Emission Tomography Predict Survival in Classical Hodgkin Lymphoma 458 DX, we categorized the patients into four groups based on positive versus negative int-PET and ALC/ AMC-DX ≥ 1.1 versus ALC/AMC-DX < 1.1. Patients in the group with negative int-PET (low tumor burden) and ALC/ AMC-DX ≥ 1.1 (high host immunity and low immuno- suppressive tumor microenvironment) experienced supe- rior PFS and TTP in comparison with any other group with any negative marker of high tumor burden, low host immunity and/or immunosuppressive microenvironment. A limitation of the IPS is that it only applies to cHL patients with advanced stage and not to limited stage cHL patients. Thus, we investigated if the ALC/AMC- DX and the int-PET are prognostic factor for PFS and TTP according to the stage at diagnosis. We identified that both the ALC/AMC-DX and int-PET were predic- tors for PFS and TTP for cHL patients with limited stage and advanced stage. Furthermore, the prognosis for PFS and TTP for patients with a negative int-PET and an ALC/AMC-DX ≥ 1.1 was superior to any group regard- less of limited or advanced stage, suggesting that the combination of ALC/AMC-DX and int-PET can help to predict clinical outcomes in cHL patients by stage at pre- sentation. Further studies are warrant to support this ob- servation. In contrast to Romano’s article [4], the ALC/AMC-DX was found to be an independent of the int-PET to predict PFS and TTP. A difference between Romano’s article and this study is that in Romano’s study only 9% (11/115) cHL patients presented with an ALC/AMC-DX < 1.1 and in our study it was 21%, suggesting as Romano stated that in difference series, a different cut-off value should be calculated. This is well-documented by the paper of Koh et al. [3] where they used a cut-off of 2.9, instead of 1.1 to confirm that the ALC/AMC-DX was an inde- pendent predictor of survival in cHL. It is important to point out that even though statistical methods are useful to identify cut-off values of new prognostic bio-markers, new bio-markers need to be biologically sound to help us understand and improve clinical outcomes. This current study in addition to our previous publication [1], the studies by Koh [3] and Romano [4] continue to add more information to understand the role of the ALC/AMC-DX on survival in cHL. To minimize the inherent biases of a retrospective study, the following steps were taken. With regards to selection bias, we included only patients with cHL and excluded patients with nodular lymphocyte predominant Hodgkin’s lymphoma who are considered to have a dif- ferent disease entity. We excluded patients treated up- front with palliative care or radiation alone, as chemo- therapy and combination chemotherapy and radiation are considered the current standard of care for cHL patients. All patients were treated with the same chemotherapy regimen: ABVD. Patients who were positive for human immunodeficiency virus and concomitant autoimmune disease treated with immunosuppressive therapies were also excluded as these diseases and treatment directly in- fluence ALC and AMC values. A strength of the study is the long-term follow-up of a well-defined group of pa- tients with cHL. Secondly, the ALC/AMC-DX is simple, easily determined clinical biomarker that can be used to assess clinical outcomes in cHL in conjunction with the routine use of int-PET. 5. Conclusion The combination of ALC/AMC-DX and int-PET as rep- resentative markers of host immunity, tumor microenvi- ronment, and tumor burden can stratified clinical out- comes in cHL and further studies are warranted to con- firm our findings. REFERENCES [1] L. F. Porrata, K. Ristow, J. P. Colgan, T. M. Habermann, T. E. Witzig, D. J. Inwards, et al., “Peripheral Blood Lym- phocyte/Monocyte Ratio at Diagnosis and Survival in Classical Hodgkin’s Lymphoma,” Hematologica, Vol. 97, No 2, 2012, pp. 262-269. doi:10.3324/haematol.2011.050138 [2] Y. W. Koh, H. J. Kang, C. Park, D. H. Yoon, S. Kim, et al., “The Ratio of the Absolute Lymphocyte Count to the Absolute Monocyte Count Is Associated with Prognosis in Hodgkin’s Lymphoma: Correlation with Tumor Asso- ciated Macrophages,” Oncologist, Vol. 17, No. 6, 2012, pp. 871-880. [3] T. Terasawa, J. Lau, S. Bardet, O. Couturier, T. Hotta, M. Hutchings, et al., “Fluorine-18-Fluorodeoxyglucose Posi- tron Emission Tomography for Interim Response Assess- ment of Advanced-Stage Hodgkin’s Lymphoma and Dif- fuse Large B-Cell Lymphoma: A Systemic Review,” Jour- nal of Clinical Oncology Vol. 27, No. 11, 2009, pp. 1906- 1914. doi:10.1200/JCO.2008.16.0861 [4] A. Romano, C. Vetro, D. Donnarumma, S. Forte, M. Ip- polito and F. Di Raimondo, “Early Interim 2-(1)Fluoro-2- deoxy-D-glucose Positron Emission Tomography Is Prog- nostically Superior to Peripheral Blood Lymphocyte/Mo- nocyte Ratio at Diagnosis in Classical Hodgkin’s Lym- phoma,” Hae matologica, Vol. 97, No. 6, 2012, pp. e22-e23. doi:10.3324/haematol.2012.064576 [5] C. J. Cox, T. M. Habermann, B. A. Payne, G. G. Klee, and R. V. Pierre. “Evaluation of the Coulter Counter Model S-Puls IV,” American Journal of Clinical Pathol- ogy, Vol. 84, No. 3, 1985, pp. 297-306. [6] D. Hasenclever, V. Diehl, J. O. Armitage, D. Assouline, M. Bjorkholm, E. Brusamolino, et al., “A Prognostic Score for Advanced Hodgkin’s Disease,” New England Journal of Medicine, Vol. 339, No. 21, 1998, pp. 1506- 1514. doi:10.1056/NEJM199811193392104 [7] B. D. Chelson, B. Pfistner, M. E. Juweid, R. D. Gascoyne, Copyright © 2013 SciRes. JCT  Absolute Lymphocyte/Monocyte Ratio at Diagnosis and Interim Positron-Emission Tomography Predict Survival in Classical Hodgkin Lymphoma Copyright © 2013 SciRes. JCT 459 L. Specht, S. J. Horning, et al., “Revised Response Crite- ria for Malignant Lymphoma,” Journal of Clinical On- cology, Vol. 25, No. 5, 2007, pp. 579-586. [8] E. Kaplan and P. Meier, “Nonparametric Estimation from Incomplete Observations,” Journal of the American Sta- tistical Association Vol. 53, No. 282, 1958, pp. 457-481. doi:10.1080/01621459.1958.10501452 [9] D. R. Cox, “Regression Models and Life-Tables,” Jour- nal of the Royal Statistical Society series B, Vol. 34, No. 2, 1972, pp. 187-202. |