

Paper Menu >>
Journal Menu >>
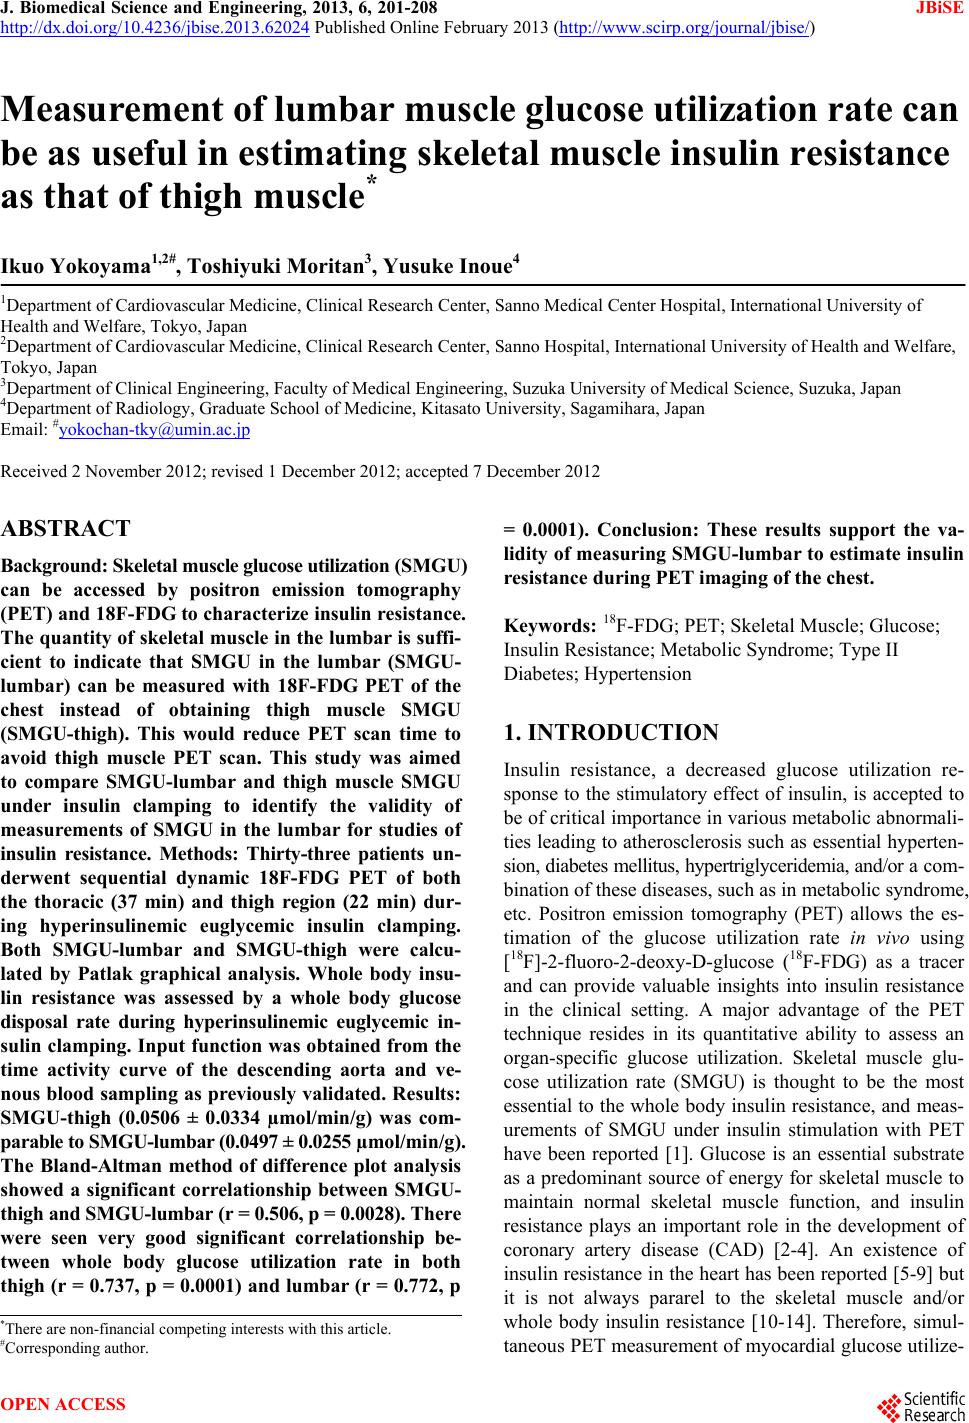 J. Biomedical Science and Engineering, 2013, 6, 201-208 JBiSE http://dx.doi.org/10.4236/jbise.2013.62024 Published Online February 2013 (http://www.scirp.org/journal/jbise/) Measurement of lumbar muscle glucose utilization rate can be as useful in estimating skeletal muscle insulin resistance as that of thigh muscle* Ikuo Yokoyama1,2#, Toshiyuki Moritan3, Yusuke Inoue4 1Department of Cardiovascular Medicine, Clinical Research Center, Sanno Medical Center Hospital, International University of Health and Welfare, Tokyo, Japan 2Department of Cardiovascular Medicine, Clinical Research Center, Sanno Hospital, International University of Health and Welfare, Tokyo, Japan 3Department of Clinical Engineering, Faculty of Medical Engineering, Suzuka University of Medical Science, Suzuka, Japan 4Department of Radiology, Graduate School of Medicine, Kitasato University, Sagamihara, Japan Email: #[email protected] Received 2 November 2012; revised 1 December 2012; accepted 7 December 2012 ABSTRACT Background: Skeletal muscle glucose utilization (SMGU) can be accessed by positron emission tomography (PET) and 18F-FDG to characterize insulin resistance. The quantity of skeletal muscle in the lumbar is suffi- cient to indicate that SMGU in the lumbar (SMGU- lumbar) can be measured with 18F-FDG PET of the chest instead of obtaining thigh muscle SMGU (SMGU-thigh). This would reduce PET scan time to avoid thigh muscle PET scan. This study was aimed to compare SMGU-lumbar and thigh muscle SMGU under insulin clamping to identify the validity of measurements of SMGU in the lumbar for studies of insulin resistance. Methods: Thirty-three patients un- derwent sequential dynamic 18F-FDG PET of both the thoracic (37 min) and thigh region (22 min) dur- ing hyperinsulinemic euglycemic insulin clamping. Both SMGU-lumbar and SMGU-thigh were calcu- lated by Patlak graphical analysis. Whole body insu- lin resistance was assessed by a whole body glucose disposal rate during hyperinsulinemic euglycemic in- sulin clamping. Input function was obtained from the time activity curve of the descending aorta and ve- nous blood sampling as previously validated. Results: SMGU-thigh (0.0506 ± 0.0334 µmol/min/g) was com- parable to SMGU-lumbar (0.0497 ± 0.0255 µmol/min/g). The Bland-Altman method of difference plot analysis showed a significant correlationship between SMGU- thigh and SMGU-lumbar (r = 0.506, p = 0.0028). There were seen very good significant correlationship be- tween whole body glucose utilization rate in both thigh (r = 0.737, p = 0.0001) and lumbar (r = 0.772, p = 0.0001). Conclusion: These results support the va- lidity of measuring SMGU-lumbar to estimate insulin resistance during PET imaging of the chest. Keywords: 18F-FDG; PET; Skeletal Muscle; Glucose; Insulin Resistance; Metabolic Syndrome; Type II Diabetes; Hypertension 1. INTRODUCTION Insulin resistance, a decreased glucose utilization re- sponse to the stimulatory effect of insulin, is accepted to be of critical importance in various metabolic abnormali- ties leading to atherosclerosis such as essential hyperten- sion, diabetes mellitus, hypertriglyceridemia, and/or a com- bination of these diseases, such as in metabolic syndrome, etc. Positron emission tomography (PET) allows the es- timation of the glucose utilization rate in vivo using [18F]-2-fluoro-2-deoxy-D-glucose (18F-FDG) as a tracer and can provide valuable insights into insulin resistance in the clinical setting. A major advantage of the PET technique resides in its quantitative ability to assess an organ-specific glucose utilization. Skeletal muscle glu- cose utilization rate (SMGU) is thought to be the most essential to the whole body insulin resistance, and meas- urements of SMGU under insulin stimulation with PET have been reported [1]. Glucose is an essential substrate as a predominant source of energy for skeletal muscle to maintain normal skeletal muscle function, and insulin resistance plays an important role in the development of coronary artery disease (CAD) [2-4]. An existence of insulin resistance in the heart has been reported [5-9] but it is not always pararel to the skeletal muscle and/or whole body insulin resistance [10-14]. Therefore, simul- taneous PET measurement of myocardial glucose utilize- *There are non-financial competing interests with this article. #Corresponding author. OPEN ACCESS 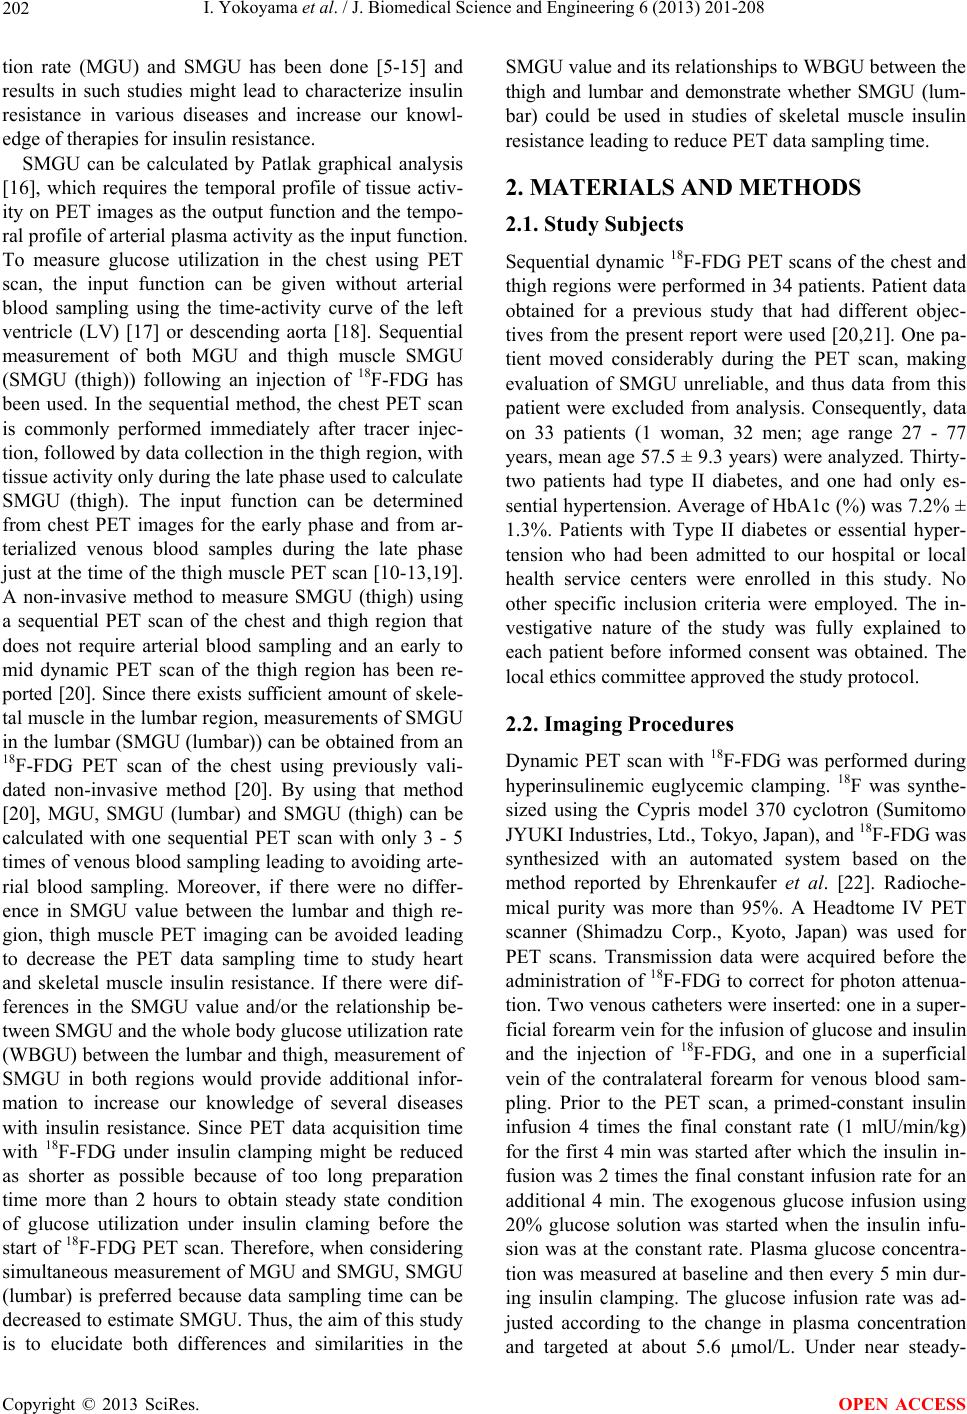 I. Yokoyama et al. / J. Biomedical Science and Engineering 6 (2013) 201-208 202 tion rate (MGU) and SMGU has been done [5-15] and results in such studies might lead to characterize insulin resistance in various diseases and increase our knowl- edge of therapies for insulin resistance. SMGU can be calculated by Patlak graphical analysis [16], which requires the temporal profile of tissue activ- ity on PET images as the output function and the tempo- ral profile of arterial plasma activity as the input function. To measure glucose utilization in the chest using PET scan, the input function can be given without arterial blood sampling using the time-activity curve of the left ventricle (LV) [17] or descending aorta [18]. Sequential measurement of both MGU and thigh muscle SMGU (SMGU (thigh)) following an injection of 18F-FDG has been used. In the sequential method, the chest PET scan is commonly performed immediately after tracer injec- tion, followed by data collection in the thigh region, with tissue activity only during the late phase used to calculate SMGU (thigh). The input function can be determined from chest PET images for the early phase and from ar- terialized venous blood samples during the late phase just at the time of the thigh muscle PET scan [10-13,19]. A non-invasive method to measure SMGU (thigh) using a sequential PET scan of the chest and thigh region that does not require arterial blood sampling and an early to mid dynamic PET scan of the thigh region has been re- ported [20]. Since there exists sufficient amount of skele- tal muscle in the lumbar region, measurements of SMGU in the lumbar (SMGU (lumbar)) can be obtained from an 18F-FDG PET scan of the chest using previously vali- dated non-invasive method [20]. By using that method [20], MGU, SMGU (lumbar) and SMGU (thigh) can be calculated with one sequential PET scan with only 3 - 5 times of venous blood sampling leading to avoiding arte- rial blood sampling. Moreover, if there were no differ- ence in SMGU value between the lumbar and thigh re- gion, thigh muscle PET imaging can be avoided leading to decrease the PET data sampling time to study heart and skeletal muscle insulin resistance. If there were dif- ferences in the SMGU value and/or the relationship be- tween SMGU and the whole body glucose utilization rate (WBGU) between the lumbar and thigh, measurement of SMGU in both regions would provide additional infor- mation to increase our knowledge of several diseases with insulin resistance. Since PET data acquisition time with 18F-FDG under insulin clamping might be reduced as shorter as possible because of too long preparation time more than 2 hours to obtain steady state condition of glucose utilization under insulin claming before the start of 18F-FDG PET scan. Therefore, when considering simultaneous measurement of MGU and SMGU, SMGU (lumbar) is preferred because data sampling time can be decreased to estimate SMGU. Thus, the aim of this study is to elucidate both differences and similarities in the SMGU value and its relationships to WBGU between the thigh and lumbar and demonstrate whether SMGU (lum- bar) could be used in studies of skeletal muscle insulin resistance leading to reduce PET data sampling time. 2. MATERIALS AND METHODS 2.1. Study Subjects Sequential dynamic 18F-FDG PET scans of the chest and thigh regions were performed in 34 patients. Patient data obtained for a previous study that had different objec- tives from the present report were used [20,21]. One pa- tient moved considerably during the PET scan, making evaluation of SMGU unreliable, and thus data from this patient were excluded from analysis. Consequently, data on 33 patients (1 woman, 32 men; age range 27 - 77 years, mean age 57.5 ± 9.3 years) were analyzed. Thirty- two patients had type II diabetes, and one had only es- sential hypertension. Average of HbA1c (%) was 7.2% ± 1.3%. Patients with Type II diabetes or essential hyper- tension who had been admitted to our hospital or local health service centers were enrolled in this study. No other specific inclusion criteria were employed. The in- vestigative nature of the study was fully explained to each patient before informed consent was obtained. The local ethics committee approved the study protocol. 2.2. Imaging Procedures Dynamic PET scan with 18F-FDG was performed during hyperinsulinemic euglycemic clamping. 18F was synthe- sized using the Cypris model 370 cyclotron (Sumitomo JYUKI Industries, Ltd., Tokyo, Japan), and 18F-FDG was synthesized with an automated system based on the method reported by Ehrenkaufer et al. [22]. Radioche- mical purity was more than 95%. A Headtome IV PET scanner (Shimadzu Corp., Kyoto, Japan) was used for PET scans. Transmission data were acquired before the administration of 18F-FDG to correct for photon attenua- tion. Two venous catheters were inserted: one in a super- ficial forearm vein for the infusion of glucose and insulin and the injection of 18F-FDG, and one in a superficial vein of the contralateral forearm for venous blood sam- pling. Prior to the PET scan, a primed-constant insulin infusion 4 times the final constant rate (1 mlU/min/kg) for the first 4 min was started after which the insulin in- fusion was 2 times the final constant infusion rate for an additional 4 min. The exogenous glucose infusion using 20% glucose solution was started when the insulin infu- sion was at the constant rate. Plasma glucose concentra- tion was measured at baseline and then every 5 min dur- ing insulin clamping. The glucose infusion rate was ad- justed according to the change in plasma concentration and targeted at about 5.6 µmol/L. Under near steady- Copyright © 2013 SciRes. OPEN ACCESS 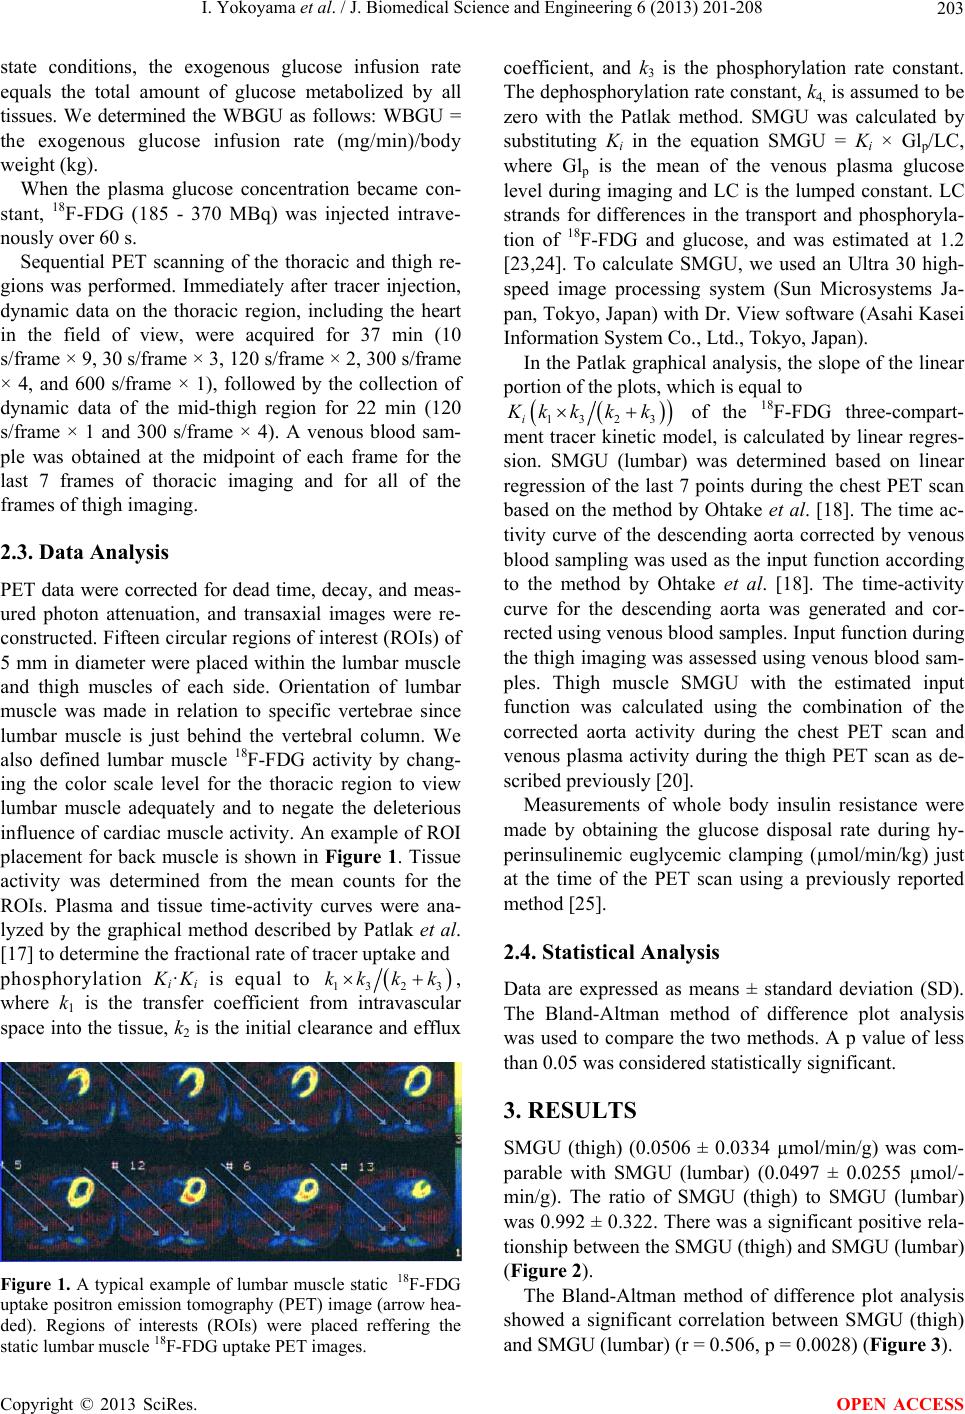 I. Yokoyama et al. / J. Biomedical Science and Engineering 6 (2013) 201-208 203 state conditions, the exogenous glucose infusion rate equals the total amount of glucose metabolized by all tissues. We determined the WBGU as follows: WBGU = the exogenous glucose infusion rate (mg/min)/body weight (kg). When the plasma glucose concentration became con- stant, 18F-FDG (185 - 370 MBq) was injected intrave- nously over 60 s. Sequential PET scanning of the thoracic and thigh re- gions was performed. Immediately after tracer injection, dynamic data on the thoracic region, including the heart in the field of view, were acquired for 37 min (10 s/frame × 9, 30 s/frame × 3, 120 s/frame × 2, 300 s/frame × 4, and 600 s/frame × 1), followed by the collection of dynamic data of the mid-thigh region for 22 min (120 s/frame × 1 and 300 s/frame × 4). A venous blood sam- ple was obtained at the midpoint of each frame for the last 7 frames of thoracic imaging and for all of the frames of thigh imaging. 2.3. Data Analysis PET data were corrected for dead time, decay, and meas- ured photon attenuation, and transaxial images were re- constructed. Fifteen circular regions of interest (ROIs) of 5 mm in diameter were placed within the lumbar muscle and thigh muscles of each side. Orientation of lumbar muscle was made in relation to specific vertebrae since lumbar muscle is just behind the vertebral column. We also defined lumbar muscle 18F-FDG activity by chang- ing the color scale level for the thoracic region to view lumbar muscle adequately and to negate the deleterious influence of cardiac muscle activity. An example of ROI placement for back muscle is shown in Figure 1. Tissue activity was determined from the mean counts for the ROIs. Plasma and tissue time-activity curves were ana- lyzed by the graphical method described by Patlak et al. [17] to determine the fractional rate of tracer uptake and phosphorylation Ki·Ki is equal to 13 2 3 kk kk , where k1 is the transfer coefficient from intravascular space into the tissue, k2 is the initial clearance and efflux Figure 1. A typical example of lumbar muscle static 18F-FDG uptake positron emission tomography (PET) image (arrow hea- ded). Regions of interests (ROIs) were placed reffering the static lumbar muscle 18F-FDG uptake PET images. coefficient, and k3 is the phosphorylation rate constant. The dephosphorylation rate constant, k4, is assumed to be zero with the Patlak method. SMGU was calculated by substituting Ki in the equation SMGU = Ki × Glp/LC, where Glp is the mean of the venous plasma glucose level during imaging and LC is the lumped constant. LC strands for differences in the transport and phosphoryla- tion of 18F-FDG and glucose, and was estimated at 1.2 [23,24]. To calculate SMGU, we used an Ultra 30 high- speed image processing system (Sun Microsystems Ja- pan, Tokyo, Japan) with Dr. View software (Asahi Kasei Information System Co., Ltd., Tokyo, Japan). In the Patlak graphical analysis, the slope of the linear portion of the plots, which is equal to 13 2 3i K kk kk of the 18F-FDG three-compart- ment tracer kinetic model, is calculated by linear regres- sion. SMGU (lumbar) was determined based on linear regression of the last 7 points during the chest PET scan based on the method by Ohtake et al. [18]. The time ac- tivity curve of the descending aorta corrected by venous blood sampling was used as the input function according to the method by Ohtake et al. [18]. The time-activity curve for the descending aorta was generated and cor- rected using venous blood samples. Input function during the thigh imaging was assessed using venous blood sam- ples. Thigh muscle SMGU with the estimated input function was calculated using the combination of the corrected aorta activity during the chest PET scan and venous plasma activity during the thigh PET scan as de- scribed previously [20]. Measurements of whole body insulin resistance were made by obtaining the glucose disposal rate during hy- perinsulinemic euglycemic clamping (µmol/min/kg) just at the time of the PET scan using a previously reported method [25]. 2.4. Statistical Analysis Data are expressed as means ± standard deviation (SD). The Bland-Altman method of difference plot analysis was used to compare the two methods. A p value of less than 0.05 was considered statistically significant. 3. RESULTS SMGU (thigh) (0.0506 ± 0.0334 µmol/min/g) was com- parable with SMGU (lumbar) (0.0497 ± 0.0255 µmol/- min/g). The ratio of SMGU (thigh) to SMGU (lumbar) was 0.992 ± 0.322. There was a significant positive rela- tionship between the SMGU (thigh) and SMGU (lumbar) (Figure 2). The Bland-Altman method of difference plot analysis showed a significant correlation between SMGU (thigh) and SMGU (lumbar) (r = 0.506, p = 0.0028) (Figure 3). Copyright © 2013 SciRes. OPEN ACCESS 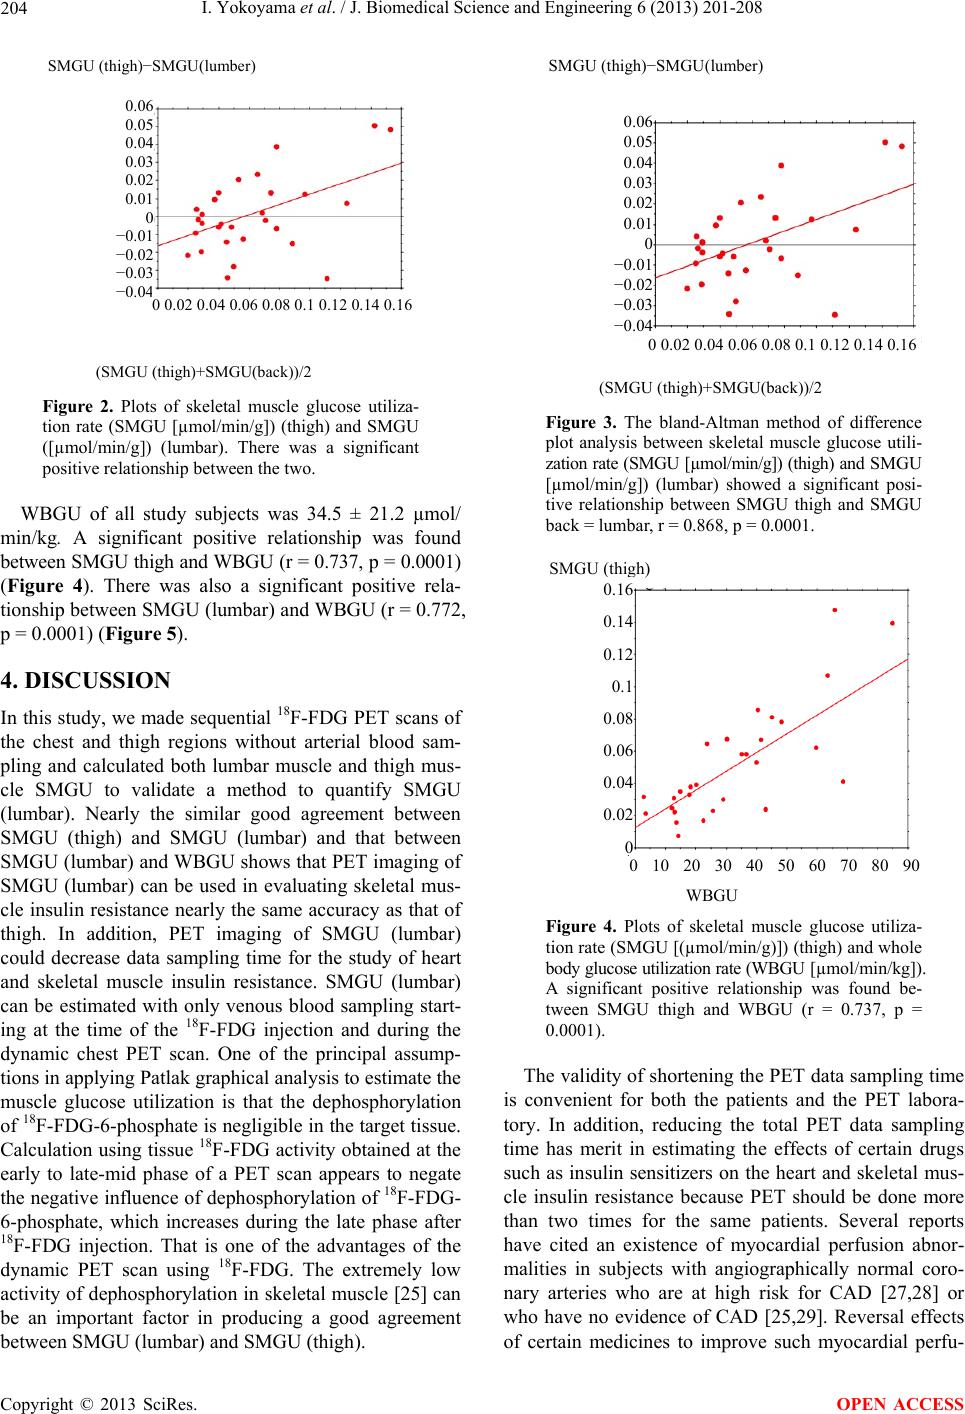 I. Yokoyama et al. / J. Biomedical Science and Engineering 6 (2013) 201-208 204 (SMGU (thigh)+SMGU(back))/2 0.06 0.05 0.04 0.03 0.02 0.01 0 −0.01 −0.02 −0.03 −0.04 0 0.02 0.04 0.06 0.08 0.1 0.12 0.14 0.16 SMGU (thigh)−SMGU(lumber) Figure 2. Plots of skeletal muscle glucose utiliza- tion rate (SMGU [µmol/min/g]) (thigh) and SMGU ([µmol/min/g]) (lumbar). There was a significant positive relationship between the two. WBGU of all study subjects was 34.5 ± 21.2 µmol/ min/kg. A significant positive relationship was found between SMGU thigh and WBGU (r = 0.737, p = 0.0001) (Figure 4). There was also a significant positive rela- tionship between SMGU (lumbar) and WBGU (r = 0.772, p = 0.0001) (Figure 5). 4. DISCUSSION In this study, we made sequential 18F-FDG PET scans of the chest and thigh regions without arterial blood sam- pling and calculated both lumbar muscle and thigh mus- cle SMGU to validate a method to quantify SMGU (lumbar). Nearly the similar good agreement between SMGU (thigh) and SMGU (lumbar) and that between SMGU (lumbar) and WBGU shows that PET imaging of SMGU (lumbar) can be used in evaluating skeletal mus- cle insulin resistance nearly the same accuracy as that of thigh. In addition, PET imaging of SMGU (lumbar) could decrease data sampling time for the study of heart and skeletal muscle insulin resistance. SMGU (lumbar) can be estimated with only venous blood sampling start- ing at the time of the 18F-FDG injection and during the dynamic chest PET scan. One of the principal assump- tions in applying Patlak graphical analysis to estimate the muscle glucose utilization is that the dephosphorylation of 18F-FDG-6-phosphate is negligible in the target tissue. Calculation using tissue 18F-FDG activity obtained at the early to late-mid phase of a PET scan appears to negate the negative influence of dephosphorylation of 18F-FDG- 6-phosphate, which increases during the late phase after 18F-FDG injection. That is one of the advantages of the dynamic PET scan using 18F-FDG. The extremely low activity of dephosphorylation in skeletal muscle [25] can be an important factor in producing a good agreement between SMGU (lumbar) and SMGU (thigh). (SMGU (thigh)+SMGU(back))/2 0.06 0.05 0.04 0.03 0.02 0.01 0 −0.01 −0.02 −0.03 −0.04 0 0.02 0.04 0.06 0.08 0.1 0.12 0.14 0.16 SMGU (thigh)−SMGU(lumber) Figure 3. The bland-Altman method of difference plot analysis between skeletal muscle glucose utili- zation rate (SMGU [µmol/min/g]) (thigh) and SMGU [µmol/min/g]) (lumbar) showed a significant posi- tive relationship between SMGU thigh and SMGU back = lumbar, r = 0.868, p = 0.0001. WBGU SMGU (thigh) 0 10 20 30 40 50 60 70 80 90 0.16 0.14 0.12 0.1 0.08 0.06 0.04 0.02 0 Figure 4. Plots of skeletal muscle glucose utiliza- tion rate (SMGU [(µmol/min/g)]) (thigh) and whole body glucose utilization rate (WBGU [µmol/min/kg]). A significant positive relationship was found be- tween SMGU thigh and WBGU (r = 0.737, p = 0.0001). The validity of shortening the PET data sampling time is convenient for both the patients and the PET labora- tory. In addition, reducing the total PET data sampling time has merit in estimating the effects of certain drugs such as insulin sensitizers on the heart and skeletal mus- cle insulin resistance because PET should be done more than two times for the same patients. Several reports have cited an existence of myocardial perfusion abnor- malities in subjects with angiographically normal coro- nary arteries who are at high risk for CAD [27,28] or who have no evidence of CAD [25,29]. Reversal effects of certain medicines to improve such myocardial perfu- Copyright © 2013 SciRes. OPEN ACCESS 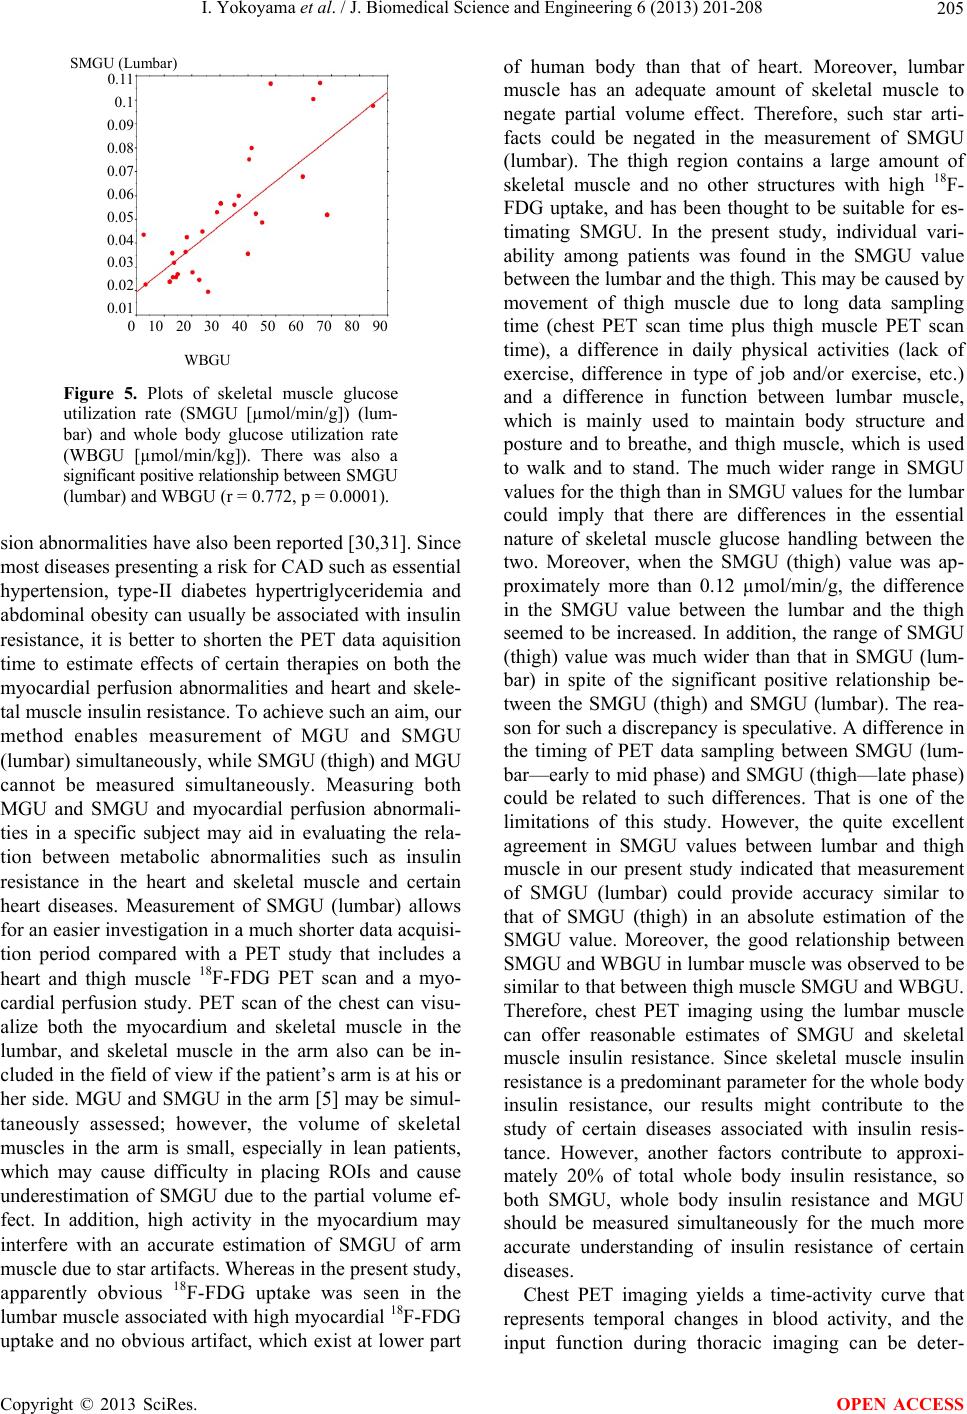 I. Yokoyama et al. / J. Biomedical Science and Engineering 6 (2013) 201-208 205 SMGU (Lumbar) 0.11 0.1 0.09 0.08 0.07 0.06 0.05 0.04 0.03 0.02 0.01 0 10 20 30 40 50 60 70 80 90 WBGU Figure 5. Plots of skeletal muscle glucose utilization rate (SMGU [µmol/min/g]) (lum- bar) and whole body glucose utilization rate (WBGU [µmol/min/kg]). There was also a significant positive relationship between SMGU (lumbar) and WBGU (r = 0.772, p = 0.0001). sion abnormalities have also been reported [30,31]. Since most diseases presenting a risk for CAD such as essential hypertension, type-II diabetes hypertriglyceridemia and abdominal obesity can usually be associated with insulin resistance, it is better to shorten the PET data aquisition time to estimate effects of certain therapies on both the myocardial perfusion abnormalities and heart and skele- tal muscle insulin resistance. To achieve such an aim, our method enables measurement of MGU and SMGU (lumbar) simultaneously, while SMGU (thigh) and MGU cannot be measured simultaneously. Measuring both MGU and SMGU and myocardial perfusion abnormali- ties in a specific subject may aid in evaluating the rela- tion between metabolic abnormalities such as insulin resistance in the heart and skeletal muscle and certain heart diseases. Measurement of SMGU (lumbar) allows for an easier investigation in a much shorter data acquisi- tion period compared with a PET study that includes a heart and thigh muscle 18F-FDG PET scan and a myo- cardial perfusion study. PET scan of the chest can visu- alize both the myocardium and skeletal muscle in the lumbar, and skeletal muscle in the arm also can be in- cluded in the field of view if the patient’s arm is at his or her side. MGU and SMGU in the arm [5] may be simul- taneously assessed; however, the volume of skeletal muscles in the arm is small, especially in lean patients, which may cause difficulty in placing ROIs and cause underestimation of SMGU due to the partial volume ef- fect. In addition, high activity in the myocardium may interfere with an accurate estimation of SMGU of arm muscle due to star artifacts. Whereas in the present study, apparently obvious 18F-FDG uptake was seen in the lumbar muscle associated with high myocardial 18F-FDG uptake and no obvious artifact, which exist at lower part of human body than that of heart. Moreover, lumbar muscle has an adequate amount of skeletal muscle to negate partial volume effect. Therefore, such star arti- facts could be negated in the measurement of SMGU (lumbar). The thigh region contains a large amount of skeletal muscle and no other structures with high 18F- FDG uptake, and has been thought to be suitable for es- timating SMGU. In the present study, individual vari- ability among patients was found in the SMGU value between the lumbar and the thigh. This may be caused by movement of thigh muscle due to long data sampling time (chest PET scan time plus thigh muscle PET scan time), a difference in daily physical activities (lack of exercise, difference in type of job and/or exercise, etc.) and a difference in function between lumbar muscle, which is mainly used to maintain body structure and posture and to breathe, and thigh muscle, which is used to walk and to stand. The much wider range in SMGU values for the thigh than in SMGU values for the lumbar could imply that there are differences in the essential nature of skeletal muscle glucose handling between the two. Moreover, when the SMGU (thigh) value was ap- proximately more than 0.12 µmol/min/g, the difference in the SMGU value between the lumbar and the thigh seemed to be increased. In addition, the range of SMGU (thigh) value was much wider than that in SMGU (lum- bar) in spite of the significant positive relationship be- tween the SMGU (thigh) and SMGU (lumbar). The rea- son for such a discrepancy is speculative. A difference in the timing of PET data sampling between SMGU (lum- bar—early to mid phase) and SMGU (thigh—late phase) could be related to such differences. That is one of the limitations of this study. However, the quite excellent agreement in SMGU values between lumbar and thigh muscle in our present study indicated that measurement of SMGU (lumbar) could provide accuracy similar to that of SMGU (thigh) in an absolute estimation of the SMGU value. Moreover, the good relationship between SMGU and WBGU in lumbar muscle was observed to be similar to that between thigh muscle SMGU and WBGU. Therefore, chest PET imaging using the lumbar muscle can offer reasonable estimates of SMGU and skeletal muscle insulin resistance. Since skeletal muscle insulin resistance is a predominant parameter for the whole body insulin resistance, our results might contribute to the study of certain diseases associated with insulin resis- tance. However, another factors contribute to approxi- mately 20% of total whole body insulin resistance, so both SMGU, whole body insulin resistance and MGU should be measured simultaneously for the much more accurate understanding of insulin resistance of certain diseases. Chest PET imaging yields a time-activity curve that represents temporal changes in blood activity, and the input function during thoracic imaging can be deter- Copyright © 2013 SciRes. OPEN ACCESS 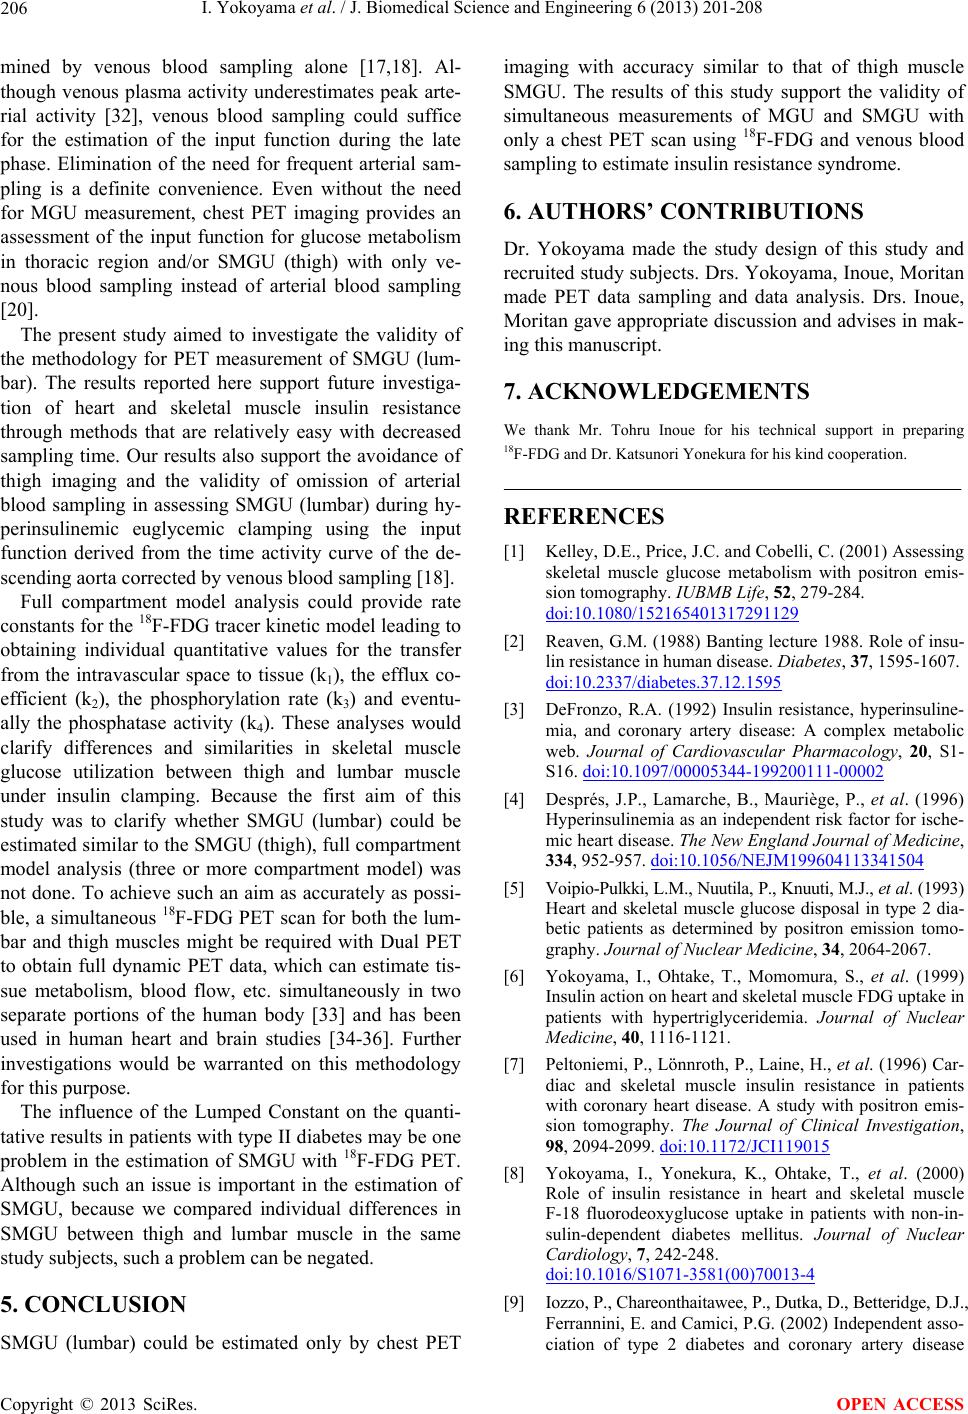 I. Yokoyama et al. / J. Biomedical Science and Engineering 6 (2013) 201-208 206 mined by venous blood sampling alone [17,18]. Al- though venous plasma activity underestimates peak arte- rial activity [32], venous blood sampling could suffice for the estimation of the input function during the late phase. Elimination of the need for frequent arterial sam- pling is a definite convenience. Even without the need for MGU measurement, chest PET imaging provides an assessment of the input function for glucose metabolism in thoracic region and/or SMGU (thigh) with only ve- nous blood sampling instead of arterial blood sampling [20]. The present study aimed to investigate the validity of the methodology for PET measurement of SMGU (lum- bar). The results reported here support future investiga- tion of heart and skeletal muscle insulin resistance through methods that are relatively easy with decreased sampling time. Our results also support the avoidance of thigh imaging and the validity of omission of arterial blood sampling in assessing SMGU (lumbar) during hy- perinsulinemic euglycemic clamping using the input function derived from the time activity curve of the de- scending aorta corrected by venous blood sampling [18]. Full compartment model analysis could provide rate constants for the 18F-FDG tracer kinetic model leading to obtaining individual quantitative values for the transfer from the intravascular space to tissue (k1), the efflux co- efficient (k2), the phosphorylation rate (k3) and eventu- ally the phosphatase activity (k4). These analyses would clarify differences and similarities in skeletal muscle glucose utilization between thigh and lumbar muscle under insulin clamping. Because the first aim of this study was to clarify whether SMGU (lumbar) could be estimated similar to the SMGU (thigh), full compartment model analysis (three or more compartment model) was not done. To achieve such an aim as accurately as possi- ble, a simultaneous 18F-FDG PET scan for both the lum- bar and thigh muscles might be required with Dual PET to obtain full dynamic PET data, which can estimate tis- sue metabolism, blood flow, etc. simultaneously in two separate portions of the human body [33] and has been used in human heart and brain studies [34-36]. Further investigations would be warranted on this methodology for this purpose. The influence of the Lumped Constant on the quanti- tative results in patients with type II diabetes may be one problem in the estimation of SMGU with 18F-FDG PET. Although such an issue is important in the estimation of SMGU, because we compared individual differences in SMGU between thigh and lumbar muscle in the same study subjects, such a problem can be negated. 5. CONCLUSION SMGU (lumbar) could be estimated only by chest PET imaging with accuracy similar to that of thigh muscle SMGU. The results of this study support the validity of simultaneous measurements of MGU and SMGU with only a chest PET scan using 18F-FDG and venous blood sampling to estimate insulin resistance syndrome. 6. AUTHORS’ CONTRIBUTIONS Dr. Yokoyama made the study design of this study and recruited study subjects. Drs. Yokoyama, Inoue, Moritan made PET data sampling and data analysis. Drs. Inoue, Moritan gave appropriate discussion and advises in mak- ing this manuscript. 7. ACKNOWLEDGEMENTS We thank Mr. Tohru Inoue for his technical support in preparing 18F-FDG and Dr. Katsunori Yonekura for his kind cooperation. REFERENCES [1] Kelley, D.E., Price, J.C. and Cobelli, C. (2001) Assessing skeletal muscle glucose metabolism with positron emis- sion tomography. IUBMB Life, 52, 279-284. doi:10.1080/152165401317291129 [2] Reaven, G.M. (1988) Banting lecture 1988. Role of insu- lin resistance in human disease. Diabetes, 37, 1595-1607. doi:10.2337/diabetes.37.12.1595 [3] DeFronzo, R.A. (1992) Insulin resistance, hyperinsuline- mia, and coronary artery disease: A complex metabolic web. Journal of Cardiovascular Pharmacology, 20, S1- S16. doi:10.1097/00005344-199200111-00002 [4] Després, J.P., Lamarche, B., Mauriège, P., et al. (1996) Hyperinsulinemia as an independent risk factor for ische- mic heart disease. The New England Journal of Medicine, 334, 952-957. doi:10.1056/NEJM199604113341504 [5] Voipio-Pulkki, L.M., Nuutila, P., Knuuti, M.J., et al. (1993) Heart and skeletal muscle glucose disposal in type 2 dia- betic patients as determined by positron emission tomo- graphy. Journal of Nuclear Medicine, 34, 2064-2067. [6] Yokoyama, I., Ohtake, T., Momomura, S., et al. (1999) Insulin action on heart and skeletal muscle FDG uptake in patients with hypertriglyceridemia. Journal of Nuclear Medicine, 40, 1116-1121. [7] Peltoniemi, P., Lönnroth, P., Laine, H., et al. (1996) Car- diac and skeletal muscle insulin resistance in patients with coronary heart disease. A study with positron emis- sion tomography. The Journal of Clinical Investigation, 98, 2094-2099. doi:10.1172/JCI119015 [8] Yokoyama, I., Yonekura, K., Ohtake, T., et al. (2000) Role of insulin resistance in heart and skeletal muscle F-18 fluorodeoxyglucose uptake in patients with non-in- sulin-dependent diabetes mellitus. Journal of Nuclear Cardiology, 7, 242-248. doi:10.1016/S1071-3581(00)70013-4 [9] Iozzo, P., Chareonthaitawee, P., Dutka, D., Betteridge, D.J., Ferrannini, E. and Camici, P.G. (2002) Independent asso- ciation of type 2 diabetes and coronary artery disease Copyright © 2013 SciRes. OPEN ACCESS  I. Yokoyama et al. / J. Biomedical Science and Engineering 6 (2013) 201-208 207 with myocardial insulin resistance. Diabetes, 51, 3020- 3024. doi:10.2337/diabetes.51.10.3020 [10] Nuutila, P., Knuuti, J., Ruotsalainen, U., et al. (1993) Insulin resistance is localized to skeletal but not heart muscle in type 1 diabetes. American Journal of Physiol- ogy, 264, E756-E762. [11] Nuutila, P., Mäki, M., Laine, H., et al. (1995) Insulin action on heart and skeletal muscle glucose uptake in es- sential hypertension. The Journal of Clinical Investiga- tion, 96, 1003-1009. doi:10.1172/JCI118085 [12] Yokoyama, I., Ohtake, T., Momomura, S., et al. (1998) Organ-specific insulin resistance in patients with nonin- sulin-dependent diabetes mellitus and hypertension. Jour- nal of Nuclear Medicine, 39, 884-889. [13] Utriainen, T., Takala, T., Luotolahti, M., et al. (1998) Insulin resistance characterizes glucose uptake in skeletal muscle but not in the heart in NIDDM. Diabetologia, 41, 555-559. doi:10.1007/s001250050946 [14] Yokoyama, I. (2013) Myocardial insulin resistance is not always pararell skeletal muscle and whole body insulin resistance: A mini review—Myocardial insulin resistance. Journal of Biomedical Science and Engineering, 6, 31- 35. doi:10.4236/jbise.2013.61005 [15] Nuutila, P., Koivisto, V.A., Knuuti, J., et al. (1992) Glu- cose-free fatty acid cycle operates in human heart and skeletal muscle in vivo. The Journal of Clinical Investiga- tion, 89, 1767-1774. doi:10.1172/JCI115780 [16] Patlak, C.S., Blasberg, R.G. and Fenstermacher, J.D. (1983) Graphical evaluation of blood-to-brain transfer constants from multiple-time uptake data. Journal of Cerebral Blood Flow & Metabolism, 3, 1-7. doi:10.1038/jcbfm.1983.1 [17] Gambhir, S.S., Schwaiger, M., Huang, S.C., et al. (1989) Simple noninvasive quantification method for measuring myocardial glucose utilization in humans employing po- sitron emission tomography and fluorine-18 deoxyglu- cose. Journal of Nuclear Medicine, 30, 359-366. [18] Ohtake, T., Kosaka, N., Watanabe, T., et al . (1991) Non- invasive method to obtain input function for measuring tissue glucose utilization of thoracic and abdominal or- gans. Journal of Nuclear Medicine, 32, 1432-1438. [19] Yokoyama, I., Yonekura, K., Moritan, T., et al. (2001) Toroglitazone can improve impaired femoral muscle glu- cose utilization in type II diabetics with or without hy- pertension. Journal of Nuclear Medicine, 42, 1005-1010. [20] Yokoyama, I., Inoue, Y., Moritan, T., Ohtomo, K. and Na- gai, R. (2005) Measurement of skeletal muscle glucose utilization by dynamic 18F-FDG PET without arterial blood sampling. Nuclear Medicine Communications, 26, 31-37. doi:10.1097/00006231-200501000-00006 [21] Yokoyama, I., Inoue, Y., Moritan, T., Ohtomo, K. and Na- gai, R. (2003) Simple quantification of skeletal muscle glucose utilization by static 18F-FDG PET. Journal of Nuclear Medicine, 44, 1592-1598. [22] Ehrenkaufer, R.E., Potocki, J.F. and Jewett, D.M. (1984) Simple synthesis of F-18-labeled 2-fluoro-2-deoxy-D-glu- cose: Concise communication. Journal of Nuclear Medi- cine, 25, 333-337. [23] Kelley, D.E., Williams, K.V., Price, J.C. and Goodpaster, B. (1999) Determination of the lumped constant for [18F] fluorodeoxyglucose in human skeletal muscle. Journal of Nuclear Medicine, 40, 1798-1804. [24] Peltoniemi, P., Lönnroth, P., Laine, H., et al. (2000) Lum- ped constant for [18F]fluorodeoxyglucose in skeletal mus- cles of obese and nonobese humans. American Journal of Physiology. Endocrinology M etabo lism, 279, E1122-E1130. [25] Yokoyama, I., Ohtake, T., Momomura, S., et al. (1998) Hyperglycemia rather than insulin resistance is related to coronary flow reserve in patients with non-insulin de- pendent diabetes mellitus. Diabetes, 47, 119-124. doi:10.2337/diabetes.47.1.119 [26] Lackner, R., Challiss, R.A., West, D. and Newsholme, E.A. (1984) A problem in the radiochemical assay of glucose- 6-phosphatase in muscle. The Biochemical Journal, 218, 649-651. [27] Yokoyama, I., Ohtake, T., Momomura, S., Nishikawa, J., Sasaki, Y. and Omata, M. (1996) Reduced coronary flow reserve in hypercholesterolemic patients without overt coronary stenosis. Circulation, 94, 3232-3238. doi:10.1161/01.CIR.94.12.3232 [28] Yokoyama, I., Momomura, S., Ohtake, T., et al. (1998) Altered myocardial vasodilatation in patients with hy- periglyceridemia in anatomically normal coronary arter- ies. Arteriosclerosis Thrombosis and Vascular Biology, 18, 294-299. doi:10.1161/01.ATV.18.2.294 [29] Yokoyama, I., Ohtake, T., Momomura, S., et al. (1997) Reduced myocardial flow reserve in patients with non- insulin dependent diabetes mellitus. Journal of the Ame- rican College of Cardiology, 30, 1472-1477. doi:10.1016/S0735-1097(97)00327-6 [30] Yokoyama, I., Momomura, S., Ohtake, T., et al. (1999) Improvement of myocardial vasodilatation in hypelipi- demics due to diffuse coronary arterosclerosis after lipid lowering therapy. Circulation, 100, 117-122. doi:10.1161/01.CIR.100.2.117 [31] Yokoyama, I., Inoue, Y., Moritan, T., Ohtomo, K. and Nagai, R. (2004) Impaired myocardial vasodilatation dur- ing hyperaemic stress is improved by simvastatin but not by pravastatin in patients with hypercholesterolaemia. European Heart Journal, 25, 671-679. doi:10.1016/j.ehj.2004.02.017 [32] Van der Weerdt, A.P., Klein, L.J., Visser, C.A., Visser, F.C. and Lammertsma, A.A. (2002) Use of arterialised venous instead of arterial blood for measurement of myo- cardial glucose metabolism during euglycaemic-hyperi- nsulinaemic clamping. European Journal of Nuclear Me- dicine and Molecular Imaging, 29, 663-669. doi:10.1007/s00259-002-0772-y [33] Iida, H., Miura, S., Shoji, Y., et al. (1998) Non-invasive quantitation of CBF using oxygen-15-water and a dual- PET system. Journal of Nuclear Medicine, 39, 1789- 1798. [34] Ito, H., Kinoshita, T., Tamura, Y., Yokoyama, I. and Iida, H. (1999) Effect of intravenous dipyridamole on cerebral blood flow in humans: A PET study. Stroke, 30, 1616- 1620. doi:10.1161/01.STR.30.8.1616 [35] Ito, H., Yokoyama, I., Iida, H., et al. (2000) Regional differences in cerebral vascular response to PaCO2 Copyright © 2013 SciRes. OPEN ACCESS  I. Yokoyama et al. / J. Biomedical Science and Engineering 6 (2013) 201-208 Copyright © 2013 SciRes. 208 OPEN ACCESS changes in humans measured by PET. Journal of Cere- bral Blood Flow & Metabolism, 20, 1264-1270. [36] Yokoyama, I., Inoue, Y., Kinoshita, T., Itoh, H., Kanno, I. and Iida, H. (2008) Heart and brain circulation and CO2 in healthy men. Acta Physiologica, 193, 303-308. doi:10.1111/j.1748-1716.2008.01846.x ABBREVIATIONS SMGU: Skeletal muscle glucose utilization; PET: Positron emission tomography; 18F-FDG: 18Fluorine-fluoro-2-deoxy-D-glucose; CAD: Coronary artery disease; WBGR: Whole body glucose disposal rate; MGU: Myocardial glucose utilization; ROIs: Regions of interest; FWHM: Full width at half maximum; LC: Lumped constant; Glp: Mean of the venous plasma glucose level during imaging; RC: Recovery coefficients. |