

Paper Menu >>
Journal Menu >>
 J. Biomedical Science and Engineering, 2013, 6, 185-191 JBiSE http://dx.doi.org/10.4236/jbise.2013.62022 Published Online February 2013 (http://www.scirp.org/journal/jbise/) Effects of dietary CoQ10 and α-lipoic acid on CoQ10 levels in plasma and tissues of eggs laying hens Petra Jazbec Krizman, Andrej Smidovnik, Alenka Golc Wondra, Mitja Krizman, Mirko Prosek National Institute of Chemistry, Ljubljana, Slovenia Email: [email protected] Received 17 December 2012; revised 17 January 2013; accepted 23 January 2013 ABSTRACT In this paper we described the effect of administrated CoQ10, and alfa-lipoic acid on the concentration of total CoQ10 in plasma end body tissues of eggs laying hens. Organisms raise a complex network of enzymes, metabolites and molecules with antioxidant activities in order to prevent oxidative damage of theirs bodies. Adequate blood concentrations of small weight mole- cules ingested with food and food additives are im- portant for the proper functioning of the antioxidant defense. To test this hypothesis we prepared following experiment. Forty weeks old hens were selected from two genotypes; Ross 308 broiler mothers and Loh- mann breed hens. Animals were fed for a period of 84 days. Concentrations of supplemented CoQ10 and A L A were calculated from feed instruction tables so each hen received an average of approximately 5 mg of CoQ10 and 50 mg of ALA per kg of animal weight per day. During the experiment blood samples were taken and at the end of the experiment different body tis- sues (heart, liver, breast, legs) were collected and ana- lyzed with ori gina lly d eveloped HPLC-MS/MS metho d based selective ionization with LiCl on MRM scan- ning. We found a number of interesting and unex- pected results. Supplemented CoQ10 increased con- centrations of coenzyme CoQ10 in plasma and differ- ent hen’s tissues. Increased concentration of CoQ10 is the result of its transfer with chylomicrons from the digestive tract to various organs of the body and to the liver where exogenous and endogenous CoQ10 has been re-redistributed through lipoproteins. Supple- mented ALA caused much greater concentration of CoQ10 in different tissues and plasma then CoQ10. Plausible explanation of our results is such that ALA may regenerates the antioxidants and accelerate the formation of endogenous CoQ10 which is distributed with lipoprotein carriers and increases overall con- centration of CoQ10. Our experiments definitely show that Lipoic acid beside glutathione promotes also a synthesis of CoQ10 and increases the total concentra- tion especially in liver and heart tissues. Keywords: Laying Hens; Coenzyme Q10; α-Lipoic Acid; Antioxidant Network; Fodder Additive 1. INTRODUCTION Living organisms have to raise a complex system of en- zymes, metabolites and molecules with antioxidant ac- tivities in order to prevent oxidative damage of theirs bodies [1,2]. Until recently, scientists believed that each antioxidant worked separately, independently of the oth- ers. Research performed at the Packer Lab at the Univer- sity of California at Berkeley showed that there is a dy- namic connection among certain key antioxidants. These special antioxidants operate together and represent a dy- namic defense of an organism. Antioxidants in this net- work terminate oxidation processes by removing or quenching free radicals and are capable of slowing or preventing the oxidation [3]. The expression antioxidant network was first pre- sented by Packer [4], who stated that antioxidants do not act alone but are linked together into a network. Interac- tion of antioxidants had been already noticed before Packer, but he was the first who outlined a concept of a network based on the five molecules; CoQ10, ascorbic acid (vitamin C), tocopherol (vitamin E), glutathione and lipoic acid. The diagram of the antioxidant network built from reduced and oxidized forms of: lipoic acid, glu- tathione, CoQ10, vitamin C and vitamin E is presented in Figure 1. On the top at standard redox potential of less than –0.315 V is the net supplied with protons from NADH (the reduced form of Nicotinamide adenine dinu- cleotide NAD+ a coenzyme found in all living cells), and NADPH (the reduced form of Nicotinamide adenine di- nucleotide phosphate NADP+). At –0.220 V FADH2 (the reduced form of a redox cofactor flavin adenine dinu- cleotide FAD involved in several important reactions in metabolism) supports reduced form of CoQ10. In hydro- philic phases a considerable protection is produced from degradation product with antioxidant activity, like uric OPEN ACCESS 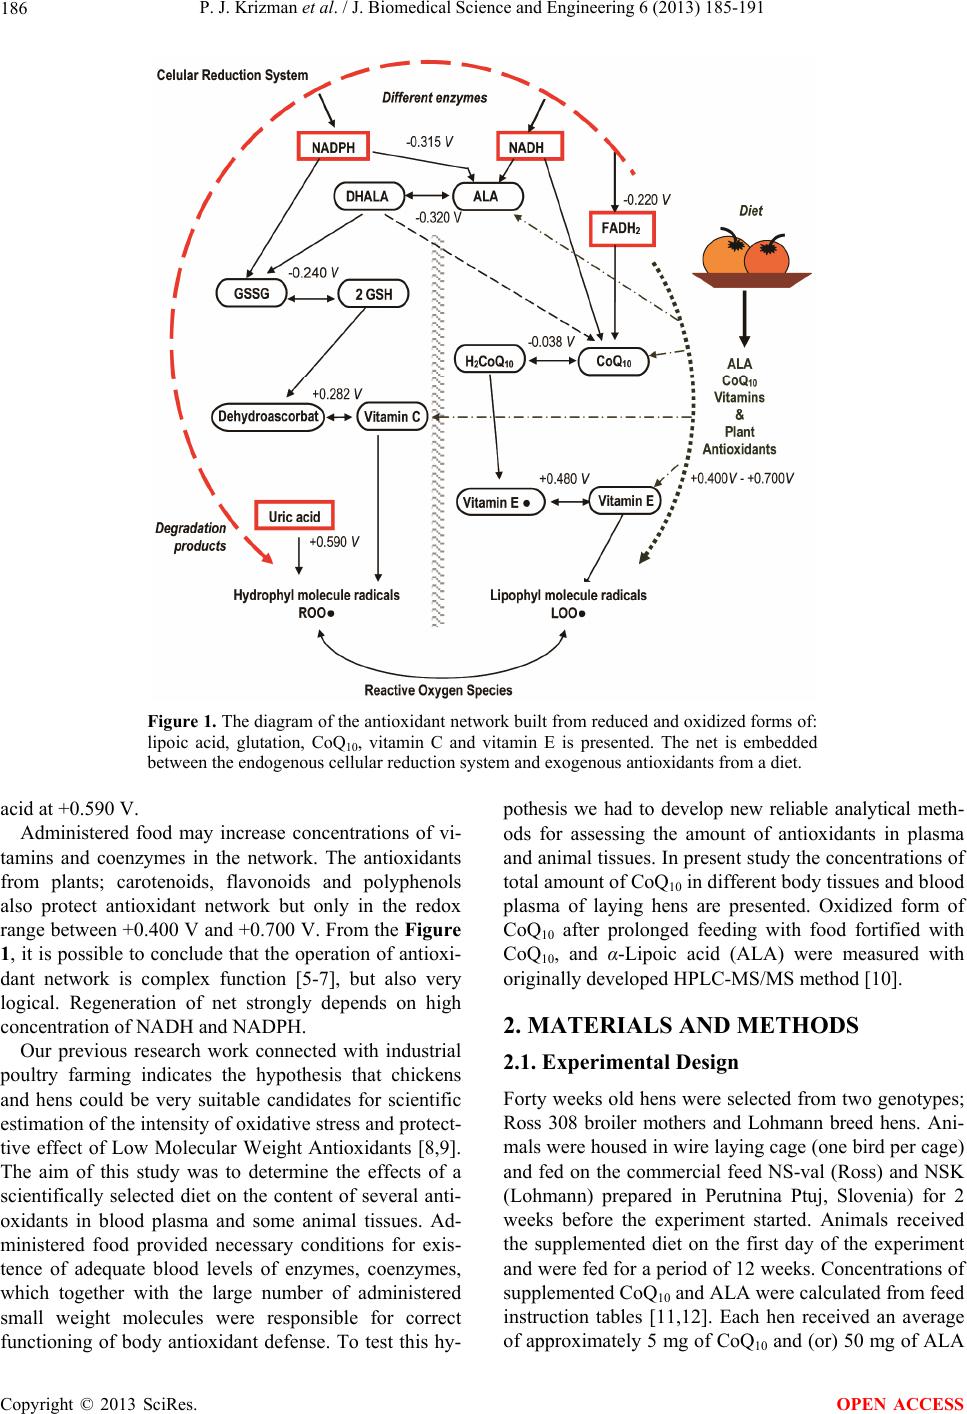 P. J. Krizman et al. / J. Biomedical Science and Engineering 6 (2013) 185-191 186 Figure 1. The diagram of the antioxidant network built from reduced and oxidized forms of: lipoic acid, glutation, CoQ10, vitamin C and vitamin E is presented. The net is embedded between the endogenous cellular reduction system and exogenous antioxidants from a diet. acid at +0.590 V. Administered food may increase concentrations of vi- tamins and coenzymes in the network. The antioxidants from plants; carotenoids, flavonoids and polyphenols also protect antioxidant network but only in the redox range between +0.400 V and +0.700 V. From the Figure 1, it is possible to conclude that the operation of antioxi- dant network is complex function [5-7], but also very logical. Regeneration of net strongly depends on high concentration of NADH and NADPH. Our previous research work connected with industrial poultry farming indicates the hypothesis that chickens and hens could be very suitable candidates for scientific estimation of the intensity of oxidative stress and protect- tive effect of Low Molecular Weight Antioxidants [8,9]. The aim of this study was to determine the effects of a scientifically selected diet on the content of several anti- oxidants in blood plasma and some animal tissues. Ad- ministered food provided necessary conditions for exis- tence of adequate blood levels of enzymes, coenzymes, which together with the large number of administered small weight molecules were responsible for correct functioning of body antioxidant defense. To test this hy- pothesis we had to develop new reliable analytical meth- ods for assessing the amount of antioxidants in plasma and animal tissues. In present study the concentrations of total amount of CoQ10 in different body tissues and blood plasma of laying hens are presented. Oxidized form of CoQ10 after prolonged feeding with food fortified with CoQ10, and α-Lipoic acid (ALA) were measured with originally developed HPLC-MS/MS method [10]. 2. MATERIALS AND METHODS 2.1. Experimental Design Forty weeks old hens were selected from two genotypes; Ross 308 broiler mothers and Lohmann breed hens. Ani- mals were housed in wire laying cage (one bird per cage) and fed on the commercial feed NS-val (Ross) and NSK (Lohmann) prepared in Perutnina Ptuj, Slovenia) for 2 weeks before the experiment started. Animals received the supplemented diet on the first day of the experiment and were fed for a period of 12 weeks. Concentrations of supplemented CoQ10 and ALA were calculated from feed instruction tables [11,12]. Each hen received an average of approximately 5 mg of CoQ10 and (or) 50 mg of ALA Copyright © 2013 SciRes. OPEN ACCESS  P. J. Krizman et al. / J. Biomedical Science and Engineering 6 (2013) 185-191 187 per kg of animal weight per day. During the 84 days pilot raise, all animals were treated under identical environ- mental and growing conditions. Tests were done in op- timal breeding and healthy conditions. The required amount of CoQ10 was provided as the water soluble addi- tive originally synthesized in our laboratory (Laboratory for Food Chemistry, National Institute of Chemistry, Ljubljana, Slovenia) by in-capsulation of CoQ10 into corn dextrin. The applied food grade alfa-lipoic acid and raw CoQ10 were purchased from Linyi Tianliheng Trade Co (China). During the experiment the blood samples were taken five times, at the start (day 1) and 21, 42, 63, and 84 days after the experiment was introduced. Up to 2 ml of blood were taken from vene cutaneae ulnaris. After the end of the experiment hens were sacrificed and different body tissues (heart, liver, breast, leg) were separated and stored together with plasma end blood samples in cool storage at −80˚C until the start of analyses. All experimental procedures were done according to the guidelines for the care and use of experimental ani- mals at Biotechnical faculty, Department of Animal Sci- ence, University of Ljubljana, Slovenia. Experiments on animals were approved by Ethic Committee of the Min- istry of Agriculture, Forestry and Food of the Republic of Slovenia. 2.2. Materials and Methods 2.2.1. Che mi c al s Methanol, ethanol, 2-propanol, 1,4-dioxane, acetonitrile, hexane, perchloric acid and acetic acid (LC grade) were supplied by Merck (Darmstadt, Germany). CoQ10 stan- dard and Sodium borohydride were purchased from Sigma Aldrich (Steinheim, Germany). -Cyclodextrin (food grade) was supplied by Xi’an Hong Chang Pharmaceuticals Co. (China), and CoQ10 (pharmaceuticals grade) by Linyi Tianliheng Trade Co (China). 2.2.2. Experimental Procedures Samples were prepared with following procedures: 400 µL of heparined blood was denaturated with 200 µL of 10% perchloric acid in ethanol. Analites were extracted three times with 2 mL of n-hexane and the combined organic extracts were concentrated with rotary evapora- tor (Rotavapor R-144 Büchi, Switzerland). The residue was dissolved again in 200 µL of 2-propanol and ana- lyzed with HPLC-ESI-MS/MS. Part of chicken breasts, legs, wings, whole hearts and livers were mixed with H2O and homogenized for 3 min- utes with Ultraturax at 20.000 rpm into a homogenous paste. 10 g of the homogenized sample were weighed into 50 mL centrifuge tube. 15 mL of warm (35˚C - 40 ˚C) distilled water was added and intensively mixed for 5 minutes. Fat was extracted twice with 20 mL of solvent mixture consisting of chloroform and methanol (2:1, v/v). The combined extracts were concentrated and dried in a stream of nitrogen. The oil residue was dissolved again in 5 mL of 2-propanol. Plasma and tissues concentrations of total CoQ10 were quantified with Sciex API-4000 QTRAP LC/MS/MS sys- tem from Applied Biosystems /MDS (Sciex Concord, ON, Canada), equipped with TurboIonSprayTM ioniza- tion system and connected to HPLC system constructed from LDC Constametric 4100 pump, and SpectraSystem AS3000 autosampler. The reduced and oxidized form of CoQ10 were suc- cessfully separated by LC column-LUNA C18 (2), 3 μm, 100 × 4.6 mm (Phenomenex, Torrance, CA, USA). Both forms were eluted with an isocratic mobile phase (ace- tonitrile: 2-propanol, 55:45) at a flow rate of 0.5 mL/min. The injection volume was 2.0 µL. For efficient ionization a solution of 0.5 µM LiCl (0.5 mL LiCl/L mobile phase) was added directly into container of mobile phase. Sciex Analyst software was used to perform data analysis and peak integration. 2.2.3. Stati stical Anal ysi s All statistics were run using Statgraphic plus Ver. 4. An analysis of variance (ANOVA) and a Student t-test were employed to evaluate differences between groups with respect to plasma levels, and the relationship between concentration levels and supplementation time. 3. RESULTS Reliable quantitative determination of CoQ10 in biologi- cal samples presented in Tables 1 and 2 was enabled with HPLC-MS/MS analytical method based on im- proved selective ionization of reduced and oxidized form of CoQ10 with added LiCl, and scanning in MRM scan mode. A quasi-molecular ion was formed with the added lithium ion in positive ESI-MS ionization mode. The parent ion for CoQ10 was 869.7 m/z (M + Li)+ and se- lected fragment ion was 241.1 m/z. The linearity rang, was from 0.02 to 5.0 mg/L (ppm), LOD was lower than 0.02 mg/kg and LOQ was 0.04 mg/kg. Obtained sensi- tivity is nearly 50 times higher than the sensitivity of our previously used analytical methods, mostly single step HPLC-MS. Nevertheless the new analytical method enables si- multaneous determination of reduced and oxidized form, we selected sample preparation with an oxidation step and measured the total CoQ10. In this way effects of un- controlled oxidation were eliminated [13]. The plasma levels of total CoQ10 in chicken’s and hen’s plasma are shown in Table 1 and Figure 2. Some results are taken from one of our previous study with Copyright © 2013 SciRes. OPEN ACCESS 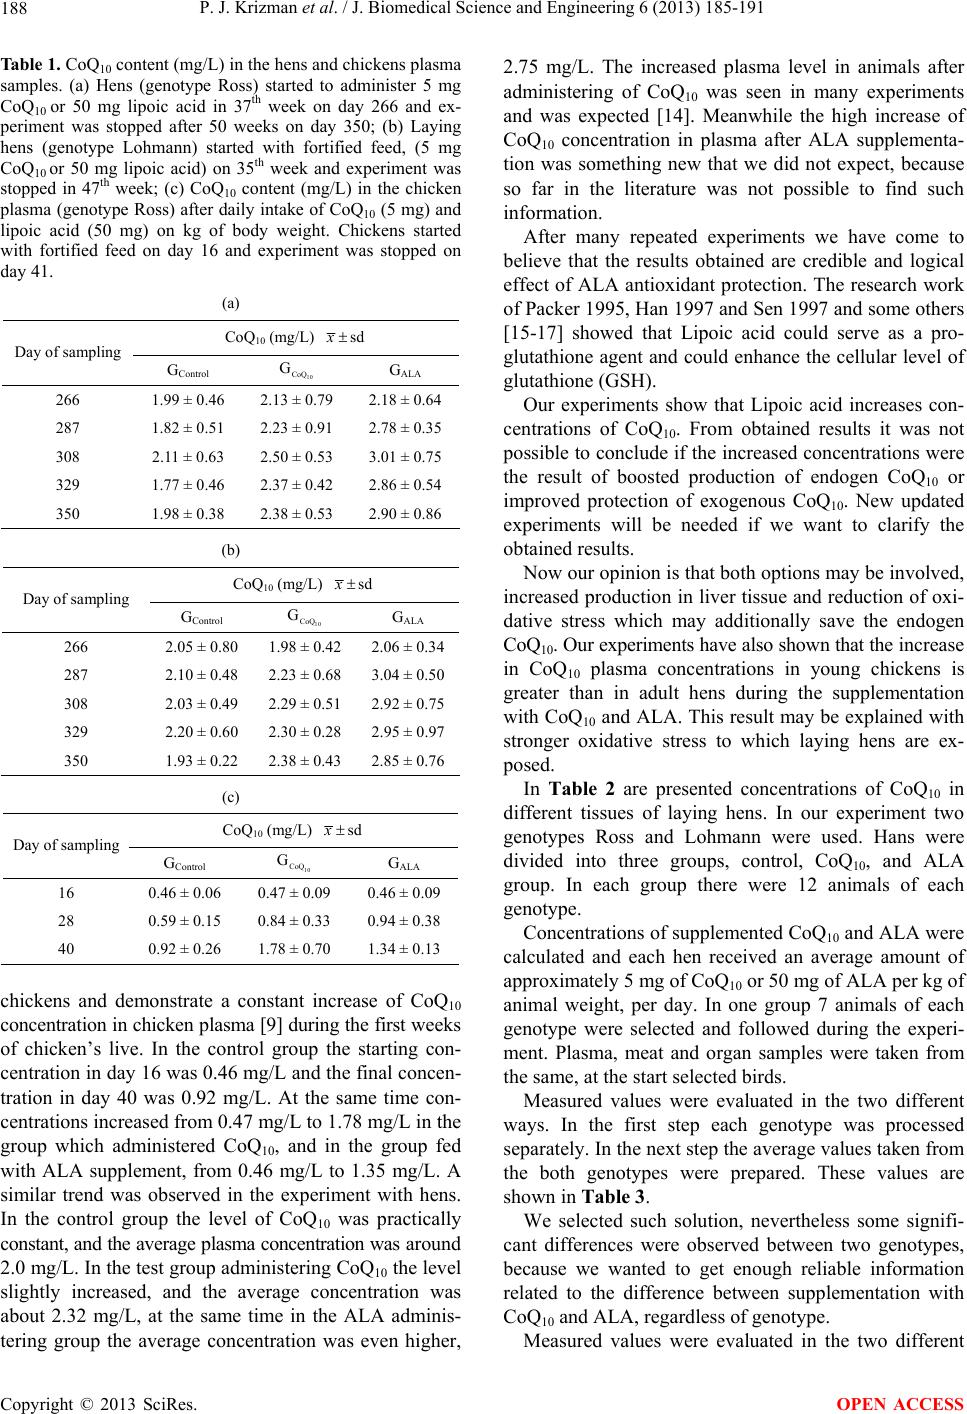 P. J. Krizman et al. / J. Biomedical Science and Engineering 6 (2013) 185-191 188 Table 1. CoQ10 content (mg/L) in the hens and chickens plasma samples. (a) Hens (genotype Ross) started to administer 5 mg CoQ10 or 50 mg lipoic acid in 37th week on day 266 and ex- periment was stopped after 50 weeks on day 350; (b) Laying hens (genotype Lohmann) started with fortified feed, (5 mg CoQ10 or 50 mg lipoic acid) on 35th week and experiment was stopped in 47th week; (c) CoQ10 content (mg/L) in the chicken plasma (genotype Ross) after daily intake of CoQ10 (5 mg) and lipoic acid (50 mg) on kg of body weight. Chickens started with fortified feed on day 16 and experiment was stopped on day 41. (a) CoQ10 (mg/L) sdx Day of sampling GControl 10 CoQ G GALA 266 1.99 ± 0.46 2.13 ± 0.79 2.18 ± 0.64 287 1.82 ± 0.51 2.23 ± 0.91 2.78 ± 0.35 308 2.11 ± 0.63 2.50 ± 0.53 3.01 ± 0.75 329 1.77 ± 0.46 2.37 ± 0.42 2.86 ± 0.54 350 1.98 ± 0.38 2.38 ± 0.53 2.90 ± 0.86 (b) CoQ10 (mg/L) sdx Day of sampling GControl 10 CoQ G GALA 266 2.05 ± 0.801.98 ± 0.42 2.06 ± 0.34 287 2.10 ± 0.482.23 ± 0.68 3.04 ± 0.50 308 2.03 ± 0.492.29 ± 0.51 2.92 ± 0.75 329 2.20 ± 0.602.30 ± 0.28 2.95 ± 0.97 350 1.93 ± 0.222.38 ± 0.43 2.85 ± 0.76 (c) CoQ10 (mg/L) sdx Day of sampling GControl 10 CoQ G GALA 16 0.46 ± 0.06 0.47 ± 0.09 0.46 ± 0.09 28 0.59 ± 0.15 0.84 ± 0.33 0.94 ± 0.38 40 0.92 ± 0.26 1.78 ± 0.70 1.34 ± 0.13 chickens and demonstrate a constant increase of CoQ10 concentration in chicken plasma [9] during the first weeks of chicken’s live. In the control group the starting con- centration in day 16 was 0.46 mg/L and the final concen- tration in day 40 was 0.92 mg/L. At the same time con- centrations increased from 0.47 mg/L to 1.78 mg/L in the group which administered CoQ10, and in the group fed with ALA supplement, from 0.46 mg/L to 1.35 mg/L. A similar trend was observed in the experiment with hens. In the control group the level of CoQ10 was practically constant, and the average plasma concentration was around 2.0 mg/L. In the test group administering CoQ10 the level slightly increased, and the average concentration was about 2.32 mg/L, at the same time in the ALA adminis- tering group the average concentration was even higher, 2.75 mg/L. The increased plasma level in animals after administering of CoQ10 was seen in many experiments and was expected [14]. Meanwhile the high increase of CoQ10 concentration in plasma after ALA supplementa- tion was something new that we did not expect, because so far in the literature was not possible to find such information. After many repeated experiments we have come to believe that the results obtained are credible and logical effect of ALA antioxidant protection. The research work of Packer 1995, Han 1997 and Sen 1997 and some others [15-17] showed that Lipoic acid could serve as a pro- glutathione agent and could enhance the cellular level of glutathione (GSH). Our experiments show that Lipoic acid increases con- centrations of CoQ10. From obtained results it was not possible to conclude if the increased concentrations were the result of boosted production of endogen CoQ10 or improved protection of exogenous CoQ10. New updated experiments will be needed if we want to clarify the obtained results. Now our opinion is that both options may be involved, increased production in liver tissue and reduction of oxi- dative stress which may additionally save the endogen CoQ10. Our experiments have also shown that the increase in CoQ10 plasma concentrations in young chickens is greater than in adult hens during the supplementation with CoQ10 and ALA. This result may be explained with stronger oxidative stress to which laying hens are ex- posed. In Table 2 are presented concentrations of CoQ10 in different tissues of laying hens. In our experiment two genotypes Ross and Lohmann were used. Hans were divided into three groups, control, CoQ10, and ALA group. In each group there were 12 animals of each genotype. Concentrations of supplemented CoQ10 and ALA were calculated and each hen received an average amount of approximately 5 mg of CoQ10 or 50 mg of ALA per kg of animal weight, per day. In one group 7 animals of each genotype were selected and followed during the experi- ment. Plasma, meat and organ samples were taken from the same, at the start selected birds. Measured values were evaluated in the two different ways. In the first step each genotype was processed separately. In the next step the average values taken from the both genotypes were prepared. These values are shown in Table 3. We selected such solution, nevertheless some signifi- cant differences were observed between two genotypes, because we wanted to get enough reliable information related to the difference between supplementation with CoQ10 and ALA, regardless of genotype. Measured values were evaluated in the two different Copyright © 2013 SciRes. OPEN ACCESS 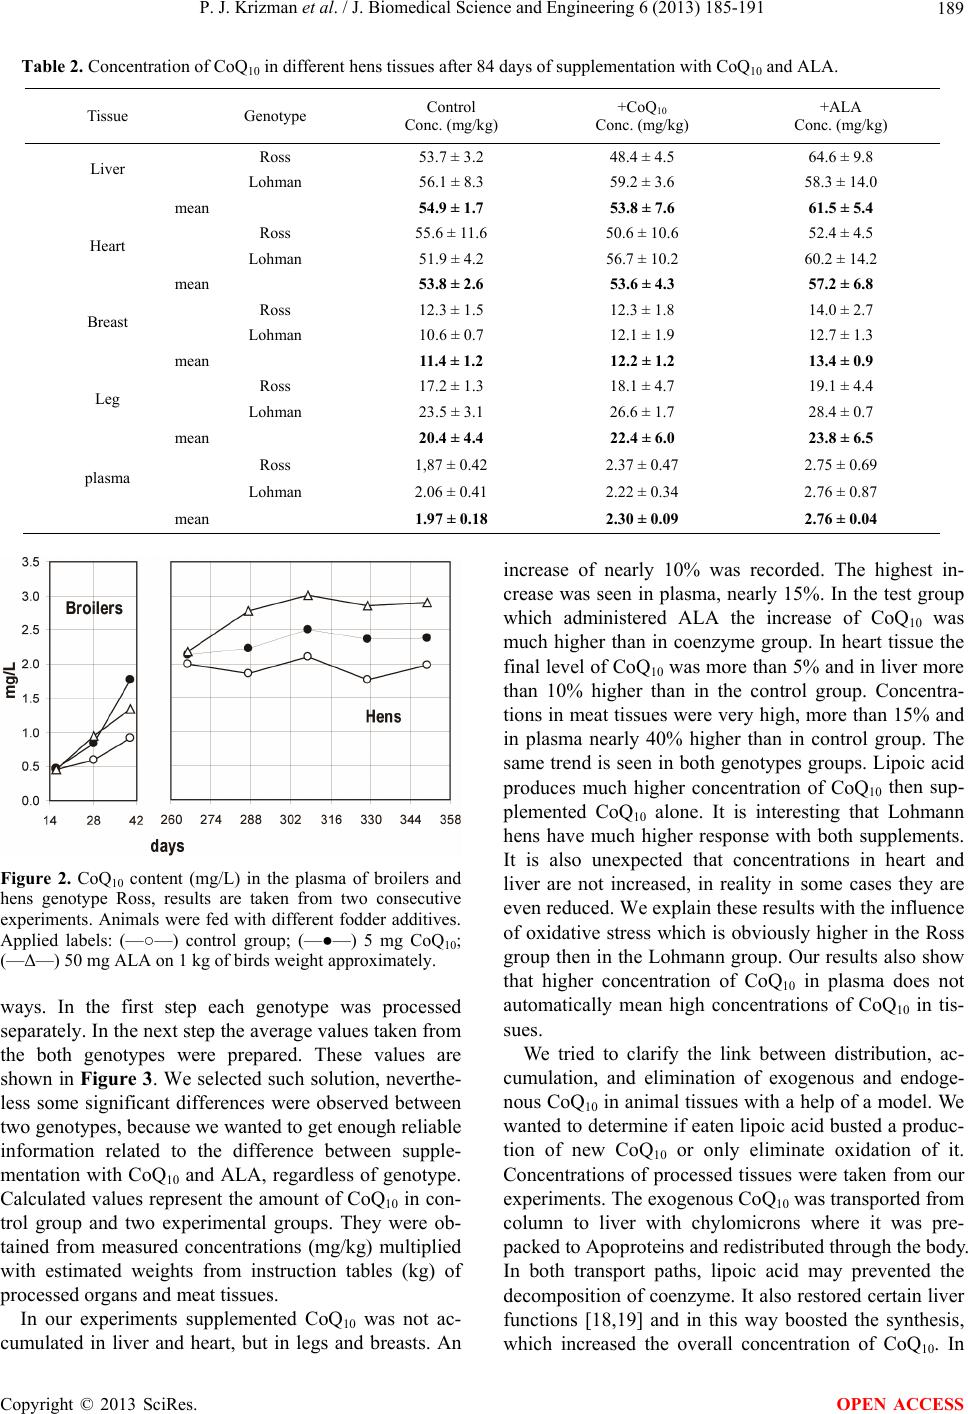 P. J. Krizman et al. / J. Biomedical Science and Engineering 6 (2013) 185-191 Copyright © 2013 SciRes. 189 Table 2. Concentration of CoQ10 in different hens tissues after 84 days of supplementation with CoQ10 and ALA. Tissue Genotype Control Conc. (mg/kg) +CoQ10 Conc. (mg/kg) +ALA Conc. (mg/kg) Ross 53.7 ± 3.2 48.4 ± 4.5 64.6 ± 9.8 Liver Lohman 56.1 ± 8.3 59.2 ± 3.6 58.3 ± 14.0 mean 54.9 ± 1.7 53.8 ± 7.6 61.5 ± 5.4 Ross 55.6 ± 11.6 50.6 ± 10.6 52.4 ± 4.5 Heart Lohman 51.9 ± 4.2 56.7 ± 10.2 60.2 ± 14.2 mean 53.8 ± 2.6 53.6 ± 4.3 57.2 ± 6.8 Ross 12.3 ± 1.5 12.3 ± 1.8 14.0 ± 2.7 Breast Lohman 10.6 ± 0.7 12.1 ± 1.9 12.7 ± 1.3 mean 11.4 ± 1.2 12.2 ± 1.2 13.4 ± 0.9 Ross 17.2 ± 1.3 18.1 ± 4.7 19.1 ± 4.4 Leg Lohman 23.5 ± 3.1 26.6 ± 1.7 28.4 ± 0.7 mean 20.4 ± 4.4 22.4 ± 6.0 23.8 ± 6.5 Ross 1,87 ± 0.42 2.37 ± 0.47 2.75 ± 0.69 plasma Lohman 2.06 ± 0.41 2.22 ± 0.34 2.76 ± 0.87 mean 1.97 ± 0.18 2.30 ± 0.09 2.76 ± 0.04 increase of nearly 10% was recorded. The highest in- crease was seen in plasma, nearly 15%. In the test group which administered ALA the increase of CoQ10 was much higher than in coenzyme group. In heart tissue the final level of CoQ10 was more than 5% and in liver more than 10% higher than in the control group. Concentra- tions in meat tissues were very high, more than 15% and in plasma nearly 40% higher than in control group. The same trend is seen in both genotypes groups. Lipoic acid produces much higher concentration of CoQ10 then sup- plemented CoQ10 alone. It is interesting that Lohmann hens have much higher response with both supplements. It is also unexpected that concentrations in heart and liver are not increased, in reality in some cases they are even reduced. We explain these results with the influence of oxidative stress which is obviously higher in the Ross group then in the Lohmann group. Our results also show that higher concentration of CoQ10 in plasma does not automatically mean high concentrations of CoQ10 in tis- sues. Figure 2. CoQ10 content (mg/L) in the plasma of broilers and hens genotype Ross, results are taken from two consecutive experiments. Animals were fed with different fodder additives. Applied labels: (—○—) control group; (—●—) 5 mg CoQ10; (—Δ—) 50 mg ALA on 1 kg of birds weight approximately. ways. In the first step each genotype was processed separately. In the next step the average values taken from the both genotypes were prepared. These values are shown in Figure 3. We selected such solution, neverthe- less some significant differences were observed between two genotypes, because we wanted to get enough reliable information related to the difference between supple- mentation with CoQ10 and ALA, regardless of genotype. Calculated values represent the amount of CoQ10 in con- trol group and two experimental groups. They were ob- tained from measured concentrations (mg/kg) multiplied with estimated weights from instruction tables (kg) of processed organs and meat tissues. We tried to clarify the link between distribution, ac- cumulation, and elimination of exogenous and endoge- nous CoQ10 in animal tissues with a help of a model. We wanted to determine if eaten lipoic acid busted a produc- tion of new CoQ10 or only eliminate oxidation of it. Concentrations of processed tissues were taken from our experiments. The exogenous CoQ10 was transported from column to liver with chylomicrons where it was pre- packed to Apoproteins and redistributed through the body. In both transport paths, lipoic acid may prevented the decomposition of coenzyme. It also restored certain liver functions [18,19] and in this way boosted the synthesis, which increased the overall concentration of CoQ10. In In our experiments supplemented CoQ10 was not ac- cumulated in liver and heart, but in legs and breasts. An OPEN ACCESS 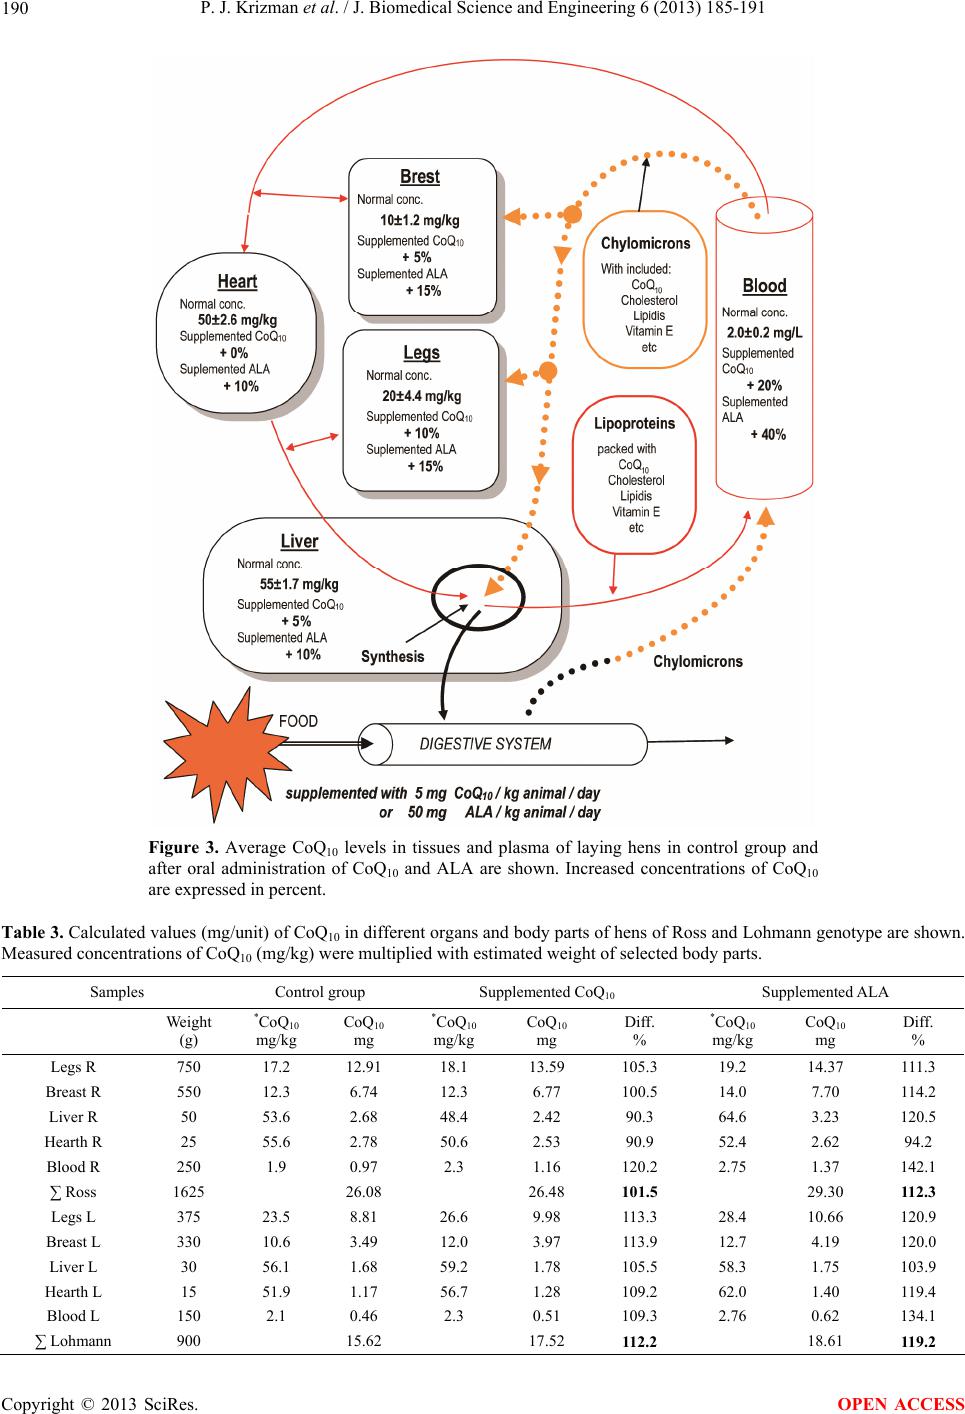 P. J. Krizman et al. / J. Biomedical Science and Engineering 6 (2013) 185-191 190 Figure 3. Average CoQ10 levels in tissues and plasma of laying hens in control group and after oral administration of CoQ10 and ALA are shown. Increased concentrations of CoQ10 are expressed in percent. Table 3. Calculated values (mg/unit) of CoQ10 in different organs and body parts of hens of Ross and Lohmann genotype are shown. Measured concentrations of CoQ10 (mg/kg) were multiplied with estimated weight of selected body parts. Samples Control group Supplemented CoQ10 Supplemented ALA Weight (g) *CoQ10 mg/kg CoQ10 mg *CoQ10 mg/kg CoQ10 mg Diff. % *CoQ10 mg/kg CoQ10 mg Diff. % Legs R 750 17.2 12.91 18.1 13.59 105.3 19.2 14.37 111.3 Breast R 550 12.3 6.74 12.3 6.77 100.5 14.0 7.70 114.2 Liver R 50 53.6 2.68 48.4 2.42 90.3 64.6 3.23 120.5 Hearth R 25 55.6 2.78 50.6 2.53 90.9 52.4 2.62 94.2 Blood R 250 1.9 0.97 2.3 1.16 120.2 2.75 1.37 142.1 ∑ Ross 1625 26.08 26.48 101.5 29.30 112.3 Legs L 375 23.5 8.81 26.6 9.98 113.3 28.4 10.66 120.9 Breast L 330 10.6 3.49 12.0 3.97 113.9 12.7 4.19 120.0 Liver L 30 56.1 1.68 59.2 1.78 105.5 58.3 1.75 103.9 Hearth L 15 51.9 1.17 56.7 1.28 109.2 62.0 1.40 119.4 Blood L 150 2.1 0.46 2.3 0.51 109.3 2.76 0.62 134.1 ∑ Lohmann 900 15.62 17.52 112.2 18.61 119.2 Copyright © 2013 SciRes. OPEN ACCESS 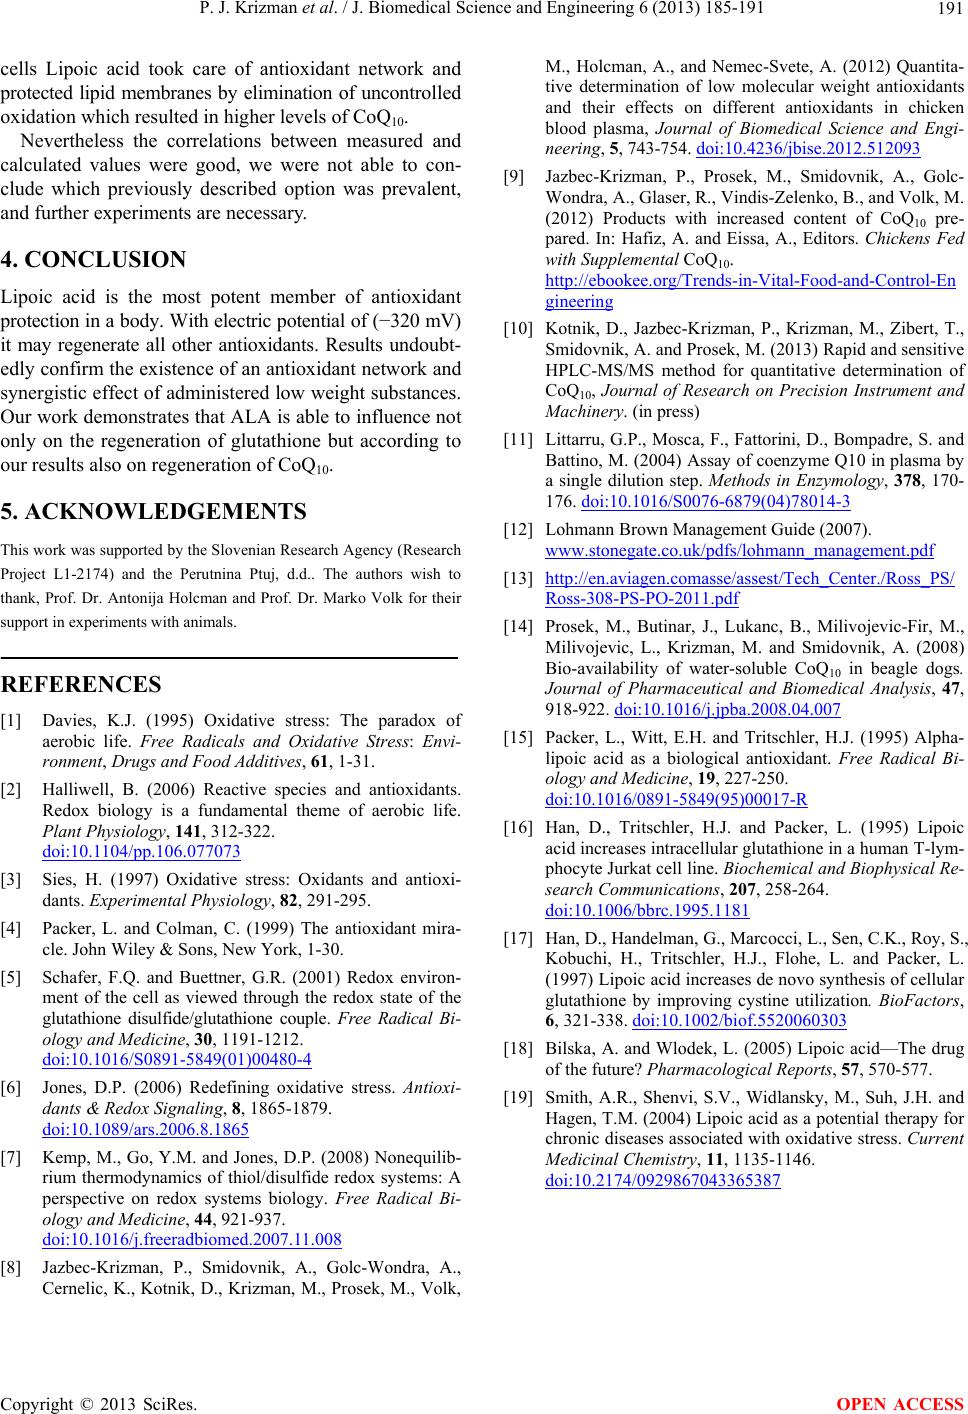 P. J. Krizman et al. / J. Biomedical Science and Engineering 6 (2013) 185-191 191 cells Lipoic acid took care of antioxidant network and protected lipid membranes by elimination of uncontrolled oxidation which resulted in higher levels of CoQ10. Nevertheless the correlations between measured and calculated values were good, we were not able to con- clude which previously described option was prevalent, and further experiments are necessary. 4. CONCLUSION Lipoic acid is the most potent member of antioxidant protection in a body. With electric potential of (−320 mV) it may regenerate all other antioxidants. Results undoubt- edly confirm the existence of an antioxidant network and synergistic effect of administered low weight substances. Our work demonstrates that ALA is able to influence not only on the regeneration of glutathione but according to our results also on regeneration of CoQ10. 5. ACKNOWLEDGEMENTS This work was supported by the Slovenian Research Agency (Research Project L1-2174) and the Perutnina Ptuj, d.d.. The authors wish to thank, Prof. Dr. Antonija Holcman and Prof. Dr. Marko Volk for their support in experiments with animals. REFERENCES [1] Davies, K.J. (1995) Oxidative stress: The paradox of aerobic life. Free Radicals and Oxidative Stress: Envi- ronment, Drugs and Food Additives, 61, 1-31. [2] Halliwell, B. (2006) Reactive species and antioxidants. Redox biology is a fundamental theme of aerobic life. Plant Physiology, 141, 312-322. doi:10.1104/pp.106.077073 [3] Sies, H. (1997) Oxidative stress: Oxidants and antioxi- dants. Experimental Physiology, 82, 291-295. [4] Packer, L. and Colman, C. (1999) The antioxidant mira- cle. John Wiley & Sons, New York, 1-30. [5] Schafer, F.Q. and Buettner, G.R. (2001) Redox environ- ment of the cell as viewed through the redox state of the glutathione disulfide/glutathione couple. Free Radical Bi- ology and Medicine, 30, 1191-1212. doi:10.1016/S0891-5849(01)00480-4 [6] Jones, D.P. (2006) Redefining oxidative stress. Antioxi- dants & Redox Signaling, 8, 1865-1879. doi:10.1089/ars.2006.8.1865 [7] Kemp, M., Go, Y.M. and Jones, D.P. (2008) Nonequilib- rium thermodynamics of thiol/disulfide redox systems: A perspective on redox systems biology. Free Radical Bi- ology and Medicine, 44, 921-937. doi:10.1016/j.freeradbiomed.2007.11.008 [8] Jazbec-Krizman, P., Smidovnik, A., Golc-Wondra, A., Cernelic, K., Kotnik, D., Krizman, M., Prosek, M., Volk, M., Holcman, A., and Nemec-Svete, A. (2012) Quantita- tive determination of low molecular weight antioxidants and their effects on different antioxidants in chicken blood plasma, Journal of Biomedical Science and Engi- neering, 5, 743-754. doi:10.4236/jbise.2012.512093 [9] Jazbec-Krizman, P., Prosek, M., Smidovnik, A., Golc- Wondra, A., Glaser, R., Vindis-Zelenko, B., and Volk, M. (2012) Products with increased content of CoQ10 pre- pared. In: Hafiz, A. and Eissa, A., Editors. Chickens Fed with Supplemental CoQ10. http://ebookee.org/Trends-in-Vital-Food-and-Control-En gineering [10] Kotnik, D., Jazbec-Krizman, P., Krizman, M., Zibert, T., Smidovnik, A. and Prosek, M. (2013) Rapid and sensitive HPLC-MS/MS method for quantitative determination of CoQ10, Journal of Research on Precision Instrument and Machinery. (in press) [11] Littarru, G.P., Mosca, F., Fattorini, D., Bompadre, S. and Battino, M. (2004) Assay of coenzyme Q10 in plasma by a single dilution step. Methods in Enzymology, 378, 170- 176. doi:10.1016/S0076-6879(04)78014-3 [12] Lohmann Brown Management Guide (2007). www.stonegate.co.uk/pdfs/lohmann_management.pdf [13] http://en.aviagen.comasse/assest/Tech_Center./Ross_PS/ Ross-308-PS-PO-2011.pdf [14] Prosek, M., Butinar, J., Lukanc, B., Milivojevic-Fir, M., Milivojevic, L., Krizman, M. and Smidovnik, A. (2008) Bio-availability of water-soluble CoQ10 in beagle dogs. Journal of Pharmaceutical and Biomedical Analysis, 47, 918-922. doi:10.1016/j.jpba.2008.04.007 [15] Packer, L., Witt, E.H. and Tritschler, H.J. (1995) Alpha- lipoic acid as a biological antioxidant. Free Radical Bi- ology and Medicine, 19, 227-250. doi:10.1016/0891-5849(95)00017-R [16] Han, D., Tritschler, H.J. and Packer, L. (1995) Lipoic acid increases intracellular glutathione in a human T-lym- phocyte Jurkat cell line. Biochemical and Biophysical Re- search Communications, 207, 258-264. doi:10.1006/bbrc.1995.1181 [17] Han, D., Handelman, G., Marcocci, L., Sen, C.K., Roy, S., Kobuchi, H., Tritschler, H.J., Flohe, L. and Packer, L. (1997) Lipoic acid increases de novo synthesis of cellular glutathione by improving cystine utilization. BioFactors, 6, 321-338. doi:10.1002/biof.5520060303 [18] Bilska, A. and Wlodek, L. (2005) Lipoic acid—The drug of the future? Pharmacological Reports, 57, 570-577. [19] Smith, A.R., Shenvi, S.V., Widlansky, M., Suh, J.H. and Hagen, T.M. (2004) Lipoic acid as a potential therapy for chronic diseases associated with oxidative stress. Current Medicinal Chemistry, 11, 1135-1146. doi:10.2174/0929867043365387 Copyright © 2013 SciRes. OPEN ACCESS |