

Paper Menu >>
Journal Menu >>
 Vol.3, No.1, 132-140 (2013) Open Journal of Preventiv e Me dic ine http://dx.doi.org/10.4236/ojpm.2013.31017 Group fitness is effective in reducing cardiovascular disease risk factors in healthy adults* Jinger S. Gottschall1#, Justin L. Jones1, Jackie Mills2, Bryce Hastings2 1The Pennsylvania State University, University Park, USA; #Corresponding Author: [email protected] 2Les Mills International, Auckland City, New Zealand Received 18 November 2012; revised 20 December 2012; accepted 27 December 2012 ABSTRACT In the past 5 years, 1 of every 3 deaths in the United States was attributed to cardiovascular disease (CVD). Regular physical activity has numerous benefits associated with the reduc- tion of cardiovascular disease risk factors. De- spite these details, 60% of Americans are not regularly physically active and 25% are not ac- tive at all. Previous studies have found signifi- cant changes in cardiovascular disease risk fac- tors by combining cardiorespiratory and strength training into one exercise program. The current pilot study augments the approach by utilizing a group fitness program that mimics the Physical Activity Guidelines for Fitness. Therefore our purpose was to evaluate if a multimodal group fitness inte rv ention could s ingularly produce th e physiological and musculoskeletal health bene- fits of the established physical activity prescrip- tion. Twenty-five sedentary, but otherwise heal- thy, adults (15 women and 10 men) between the ages of 25 - 40 y ea rs compl eted the pro toco l of a 30-week group exercise program. It started with a 6-week familiarization period, continued with a 12-week block of 6 group fitness classes per week (3 cardiovascular, 2 strength, 1 flexibility), and concluded with a 12-week block of 7 classes per week (4 card iov ascular, 2 s treng th, 1 flexibility). We completed submaximal oxygen consumption treadmill tests, fasting blood draws and iDXA scans at 3 time points (baseline, mid- point, final) and compared the data using a paired t-test (p < 0.05). Compared to baseline measurements, the final measurements demon- strated that the participants had statistically significant reductions in body mass, fat body mass percentage, total cholesterol, LDL-C, and triglycerides and elevations in oxygen con- sumption, lean body mass percentages, and HDL-C. Based upon our results, group fitness may be an ideal method to minimize attrition and maximize health benefits in a comprehensive manner to reduce the risk of cardiovascular disease. Keywords: Physical Fitness; Physical Activity; Exercise Intervention 1. INTRODUCTION In the past 5 years, 1 of every 3 deaths in the United States was attributed to cardiovascular disease (CVD), which equates to 2200 Americans each day or 1 death every 30 seconds [1,2]. A sedentary lifestyle is one of two primary behavioral factors associated with the ad- vancement of CVD. Despite these alarming statistics, 60% are not regularly physically active and 25% are not active at all [3]. It is critical that research scientists, medical practitioners, and funding agencies strive to ob- tain easy to follow exercise prescriptions to reverse these trends. Regular physical activity has numerous benefits associated with decreasing the risk of cardiovascular disease such as the reduction of total body fat mass, low density lipoprotein cholesterol (LDL-C), triglycerides, blood pressure, and elevation of maximal oxygen con- sumption, high density lipoprotein cholesterol (HDL-C) and glucose tolerance [4]. The American College of Sports Medicine (ACSM) and the United States Department of Health and Human Services established the Physical Activity Guidelines for Fitness [1] to provide direction for healthy individuals. They suggest that adults engage in cardiovascular exer- cise of moderate-intensity for 30 - 60 minutes at least 5 days per week, or vigorous-intensity for 20 - 60 minutes *Conflict of interest: While Les Mills International was supportive o f the present study they did not fund the intervention nor did they have access to the data for analyses. Copyright © 2013 SciRes. OPEN A CCESS  J. S. Gottschall et al. / Open Journal of Preventive Medicine 3 (2013) 132-140 133 at least 3 days per week, or a combination of these mod- erate- and vigorous-intensity regimens 3 - 5 days per week. In addition, the position stand recommends that adults engage in a full body muscular strength routine 2 days per week as well as flexibility exercises 1 - 2 days per week. Past research demonstrates that implementing an exer- cise program with both cardiovascular activities and strength training, without any dietary changes, can re- duce cardiovascular disease risk factors. Park et al. [5] compared the data from a group of participants who completed a 24-week combination cardiorespiratory and strength training protocol to both a cardiorespiratory training only protocol and a control group. The combined training program was the most effective in reducing CVD risk factors as mean body fat percentage decreased by 11.2%, LDL-C decreased by 34.7%, and triglycerides decreased by 42.3% from baseline. In addition, HDL-C increased by 23.1% and lean body mass increased by 10.3%. In a similar study, Libardi et al. [6] studied inac- tive participants who completed concurrent cardiorespi- ratory and strength training for 16 weeks in comparison to three other study groups; resistance training only, car- diorespiratory training only, and a control group. Similar to previous reports, the combined protocol yielded the most significant results whereby total cholesterol con- centration decreased by 27.8% and triglycerides de- creased by 33.4%. McCarthy et al. [7] also evaluated the effects of a concurrent training program on sedentary men for a 10-week training program of cardiorespiratory and full body strength training. Total body weight did not statistically decrease, however fat percentage de- creased from 19.5% to 17.2%. These studies found significant changes in cardiovas- cular disease risk factors by combining cardiorespiratory and strength training into one exercise program. The current study augments the approach by utilizing a group fitness program that mimics the Physical Activity Guide- lines for Fitness. A Nielsen survey of over 3000 partici- pants in group fitness classes across the globe showed that more than 85% of these members visit their clubs at least 2 days per week specifically to engage in classes and nearly 43% of these members visit their club 4 times a week for this purpose [8]. To add, the International Health, Racquet and Sportsclub Association (IHRSA) estimates that United States club members attend their gyms 3.4 times a week to attend group fitness classes [9]. Thus, group fitness may be one method to minimize at- trition and thereby maximize health benefits in a com- prehensive and holistic manner. We hypothesize that a 30-week multimodal group fitness intervention will pro- duce beneficial effects on CVD risk factors by reducing body weight, total cholesterol, LDL-C, triglycerides concentration, systolic blood pressure, diastolic blood pressure, and by enhancing lean body mass percentage, HDL-C, glucose tolerance and maximal oxygen con- sumption. 2. METHODS Twenty-nine healthy adults, 18 women and 11 men, started the program and 25 participants, 15 women and 10 men (Figure 1, Table 1) finished the program. All of the participants gave written informed consent that fol- lowed the guidelines of The Pennsylvania State Univer- sity Human Research Committee. The participants were physically inactive, but otherwise healthy, and completed a health exam at the beginning of the study to determine if physical activity was appropriate. The initial inclusion criteria for the study was for the participant to be be- tween the age of 25 and 40, completing less than 30 minutes of exercise per week for the previous 6 months, and available from May to December without more than four days of travel in a single week. We excluded poten- tial participants from the study, in accordance to the ACSM health screening for physical activity, if he or she had any of the following conditions: chest discomfort with exertion, unreasonable shortness of breath, symp- toms of dizziness, fainting or blackouts, heart medication, asthma or other lung disease, burning or cramping sensa- tions in lower legs with minimal physical activity, joint problems that limit physical activity, prescription medi- cations, pregnancy, diabetes, smoking, blood pressure greater than 140/90 mmHg, or total blood cholesterol greater than 220 mg·dL−1. 2.1. Laboratory Measurements We collected musculoskeletal and physiological data at baseline (Week 3), midpoint (Week 19) and final (Week 31) time points of the study. The majority of the measures were collected at the university Clinical Re- search Center such as height, weight, blood pressure, blood concentrations and body composition variables. Blood was drawn from the antecubital vein after a 48-hour alcohol and a 12-hour food fast. The samples were assayed (Quest Diagnostics, Pittsburgh, PA) with a 24-Chem analysis, which included total cholesterol, LDL-C, HDL-C, triglycerides, and glucose. Body com- position measurements were collected using a total-body scanner (GE Lunar iDXA, Madison, WI). Scan analysis was performed using GE Encore 11.10 software. This software allows for adjustment of regions of interest in- cluding the sagittal line, which controls the left-right body distribution of tissue. Immediately following this research center visit, we conducted a submaximal oxygen consumption test on a treadmill at the Biomechanics Laboratory. We measured the rates of oxygen consumption (VO2) using an open Copyright © 2013 SciRes. OPEN A CCESS 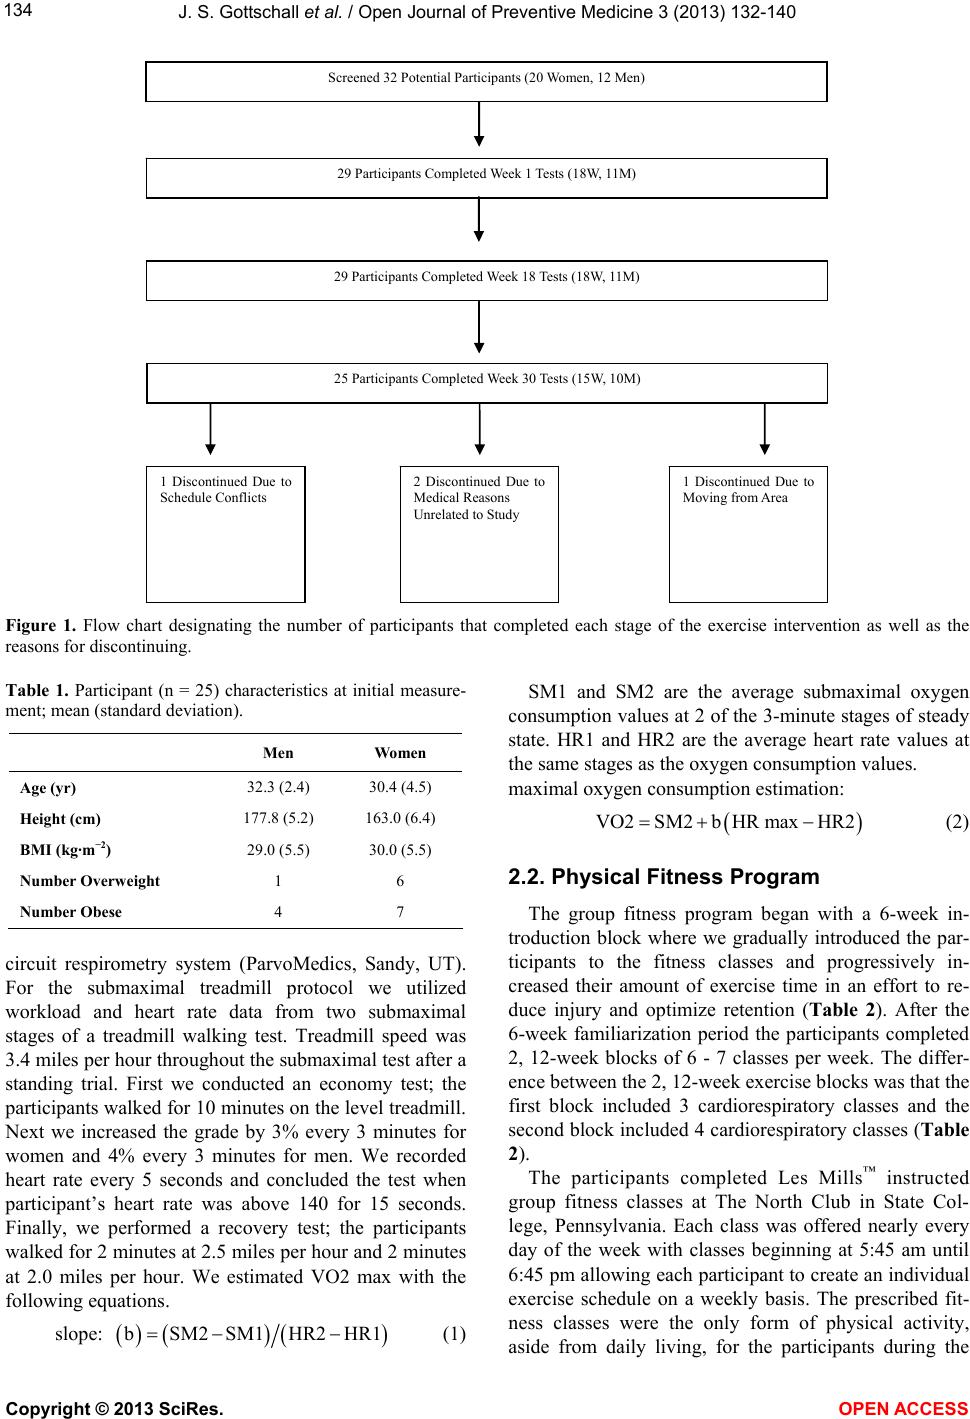 J. S. Gottschall et al. / Open Journal of Preventive Medicine 3 (2013) 132-140 Copyright © 2013 SciRes. 134 Screened 32 Potential Participants (20 Women, 12 Men) 29 Participants Completed Week 1 Tests (18W, 11M) 29 Participants Completed Week 18 Tests (18W, 11M) 1 Discontinued Due to Schedule Conflicts 2 Discontinued Due to Medical Reasons Unrelated to Study 1 Discontinued Due to Moving from Area 25 Participants Completed Week 30 Tests (15W, 10M) Figure 1. Flow chart designating the number of participants that completed each stage of the exercise intervention as well as the reasons for discontinuing. Table 1. Participant (n = 25) characteristics at initial measure- ment; mean (standard deviation). Men Women Age (yr) 32.3 (2.4) 30.4 (4.5) Height (cm) 177.8 (5.2) 163.0 (6.4) BMI (kg·m−2) 29.0 (5.5) 30.0 (5.5) Number Overweight 1 6 Number Obese 4 7 SM1 and SM2 are the average submaximal oxygen consumption values at 2 of the 3-minute stages of steady state. HR1 and HR2 are the average heart rate values at the same stages as the oxygen consumption values. maximal oxygen consumption estimation: VO2SM2bHR maxHR2 (2) 2.2. Physical Fitness Program The group fitness program began with a 6-week in- troduction block where we gradually introduced the par- ticipants to the fitness classes and progressively in- creased their amount of exercise time in an effort to re- duce injury and optimize retention (Table 2). After the 6-week familiarization period the participants completed 2, 12-week blocks of 6 - 7 classes per week. The differ- ence between the 2, 12-week exercise blocks was that the first block included 3 cardiorespiratory classes and the second block included 4 cardiorespiratory classes (Table 2). circuit respirometry system (ParvoMedics, Sandy, UT). For the submaximal treadmill protocol we utilized workload and heart rate data from two submaximal stages of a treadmill walking test. Treadmill speed was 3.4 miles per hour throughout the submaximal test after a standing trial. First we conducted an economy test; the participants walked for 10 minutes on the level treadmill. Next we increased the grade by 3% every 3 minutes for women and 4% every 3 minutes for men. We recorded heart rate every 5 seconds and concluded the test when participant’s heart rate was above 140 for 15 seconds. Finally, we performed a recovery test; the participants walked for 2 minutes at 2.5 miles per hour and 2 minutes at 2.0 miles per hour. We estimated VO2 max with the following equations. The participants completed Les Mills™ instructed group fitness classes at The North Club in State Col- lege, Pennsylvania. Each class was offered nearly every day of the week with classes beginning at 5:45 am until 6:45 pm allowing each participant to create an individual exercise schedule on a weekly basis. The prescribed fit- ness classes were the only form of physical activity, aside from daily living, for the participants during the slope: b SM2 SM1HR2HR1 (1) OPEN A CCESS 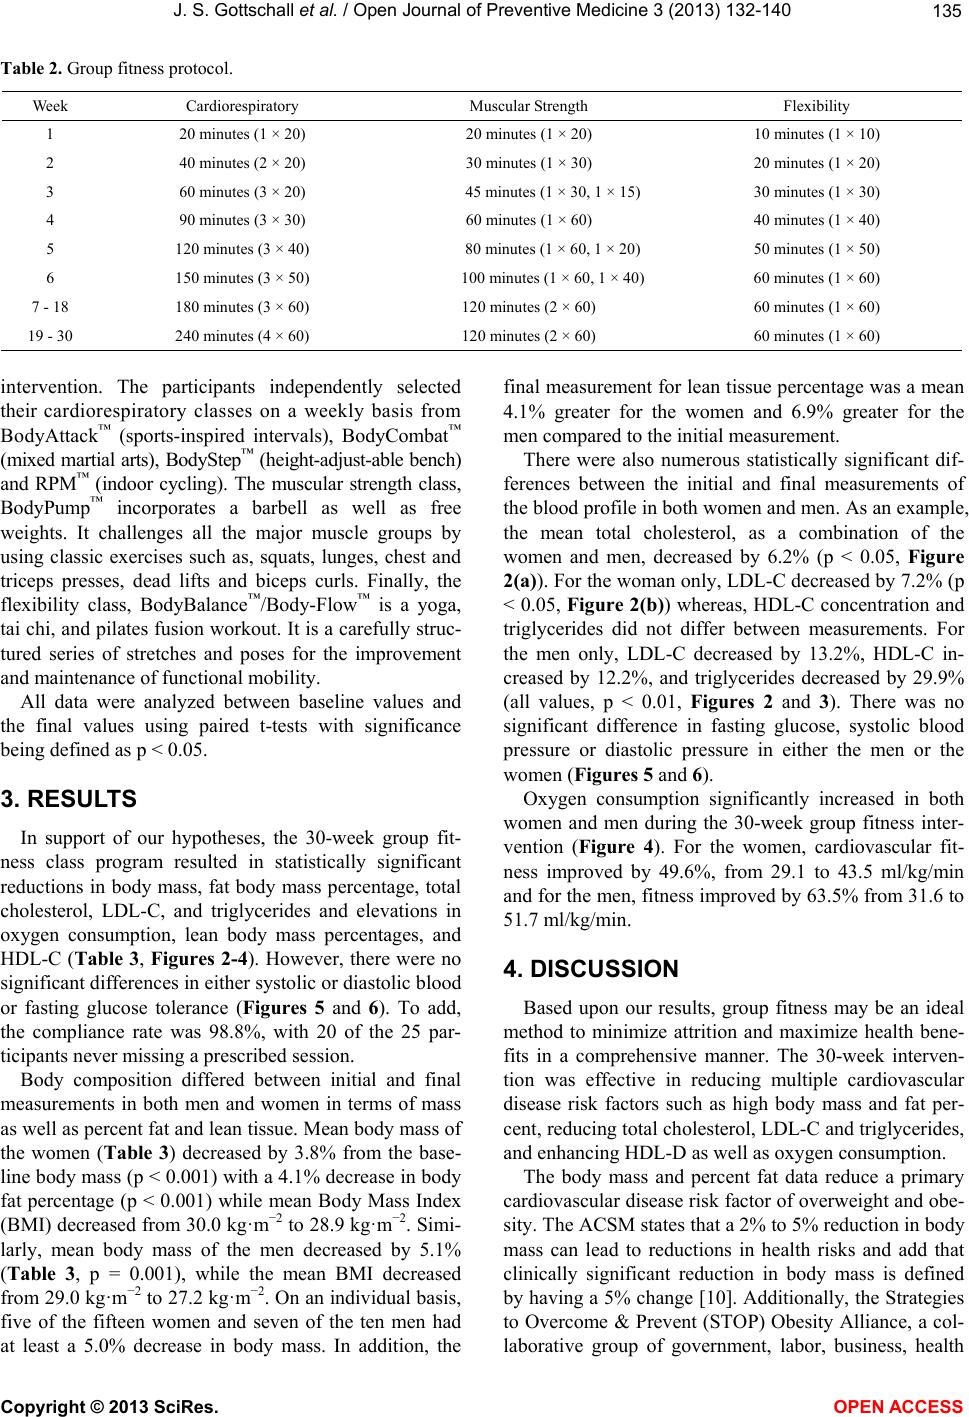 J. S. Gottschall et al. / Open Journal of Preventive Medicine 3 (2013) 132-140 135 Table 2. Group fitness protocol. Week Cardiorespiratory Muscular Strength Flexibility 1 20 minutes (1 × 20) 20 minutes (1 × 20) 10 minutes (1 × 10) 2 40 minutes (2 × 20) 30 minutes (1 × 30) 20 minutes (1 × 20) 3 60 minutes (3 × 20) 45 minutes (1 × 30, 1 × 15) 30 minutes (1 × 30) 4 90 minutes (3 × 30) 60 minutes (1 × 60) 40 minutes (1 × 40) 5 120 minutes (3 × 40) 80 minutes (1 × 60, 1 × 20) 50 minutes (1 × 50) 6 150 minutes (3 × 50) 100 minutes (1 × 60, 1 × 40) 60 minutes (1 × 60) 7 - 18 180 minutes (3 × 60) 120 minutes (2 × 60) 60 minutes (1 × 60) 19 - 30 240 minutes (4 × 60) 120 minutes (2 × 60) 60 minutes (1 × 60) intervention. The participants independently selected their cardiorespiratory classes on a weekly basis from BodyAttack™ (sports-inspired intervals), BodyCombat™ (mixed martial arts), BodyStep™ (height-adjust-able bench) and RPM™ (indoor cycling). The muscular strength class, BodyPump™ incorporates a barbell as well as free weights. It challenges all the major muscle groups by using classic exercises such as, squats, lunges, chest and triceps presses, dead lifts and biceps curls. Finally, the flexibility class, BodyBalance™/Body-Flow™ is a yoga, tai chi, and pilates fusion workout. It is a carefully struc- tured series of stretches and poses for the improvement and maintenance of functional mobility. All data were analyzed between baseline values and the final values using paired t-tests with significance being defined as p < 0.05. 3. RESULTS In support of our hypotheses, the 30-week group fit- ness class program resulted in statistically significant reductions in body mass, fat body mass percentage, total cholesterol, LDL-C, and triglycerides and elevations in oxygen consumption, lean body mass percentages, and HDL-C (Table 3, Figures 2-4). However, there were no significant differences in either systolic or diastolic blood or fasting glucose tolerance (Figures 5 and 6). To add, the compliance rate was 98.8%, with 20 of the 25 par- ticipants never missing a prescribed session. Body composition differed between initial and final measurements in both men and women in terms of mass as well as percent fat and lean tissue. Mean body mass of the women (Table 3) decreased by 3.8% from the base- line body mass (p < 0.001) with a 4.1% decrease in body fat percentage (p < 0.001) while mean Body Mass Index (BMI) decreased from 30.0 kg·m−2 to 28.9 kg·m−2. Simi- larly, mean body mass of the men decreased by 5.1% (Table 3, p = 0.001), while the mean BMI decreased from 29.0 kg·m−2 to 27.2 kg·m−2. On an individual basis, five of the fifteen women and seven of the ten men had at least a 5.0% decrease in body mass. In addition, the final measurement for lean tissue percentage was a mean 4.1% greater for the women and 6.9% greater for the men compared to the initial measurement. There were also numerous statistically significant dif- ferences between the initial and final measurements of the blood profile in both women and men. As an example, the mean total cholesterol, as a combination of the women and men, decreased by 6.2% (p < 0.05, Figure 2(a)). For the woman only, LDL-C decreased by 7.2% (p < 0.05, Figure 2(b)) whereas, HDL-C concentration and triglycerides did not differ between measurements. For the men only, LDL-C decreased by 13.2%, HDL-C in- creased by 12.2%, and triglycerides decreased by 29.9% (all values, p < 0.01, Figures 2 and 3). There was no significant difference in fasting glucose, systolic blood pressure or diastolic pressure in either the men or the women (Figures 5 and 6). Oxygen consumption significantly increased in both women and men during the 30-week group fitness inter- vention (Figure 4). For the women, cardiovascular fit- ness improved by 49.6%, from 29.1 to 43.5 ml/kg/min and for the men, fitness improved by 63.5% from 31.6 to 51.7 ml/kg/min. 4. DISCUSSION Based upon our results, group fitness may be an ideal method to minimize attrition and maximize health bene- fits in a comprehensive manner. The 30-week interven- tion was effective in reducing multiple cardiovascular disease risk factors such as high body mass and fat per- cent, reducing total cholesterol, LDL-C and triglycerides, and enhancing HDL-D as well as oxygen consumption. The body mass and percent fat data reduce a primary cardiovascular disease risk factor of overweight and obe- sity. The ACSM states that a 2% to 5% reduction in body mass can lead to reductions in health risks and add that clinically significant reduction in body mass is defined by having a 5% change [10]. Additionally, the Strategies to Overcome & Prevent (STOP) Obesity Alliance, a col- laborative group of government, labor, business, health Copyright © 2013 SciRes. OPEN A CCESS  J. S. Gottschall et al. / Open Journal of Preventive Medicine 3 (2013) 132-140 136 Table 3. Body composition; mean (standard deviation). Men Women initial final initial final Total Mass (kg) 92.0 (19.6) 87.3 (17.9) 79.8 (15.6) 76.7 (15.7) Lean Mass (kg) 85.1 (8.2) 91.3 (10.7) 70.5 (5.9) 71.7 (5.5) Fat (%) 31.7 (5.9) 24.8 (7.2) 43.0 (6.0) 38.9 (6.8) (a) (b) Copyright © 2013 SciRes. OPEN A CCESS  J. S. Gottschall et al. / Open Journal of Preventive Medicine 3 (2013) 132-140 137 (c) (d) Figure 2. Mean ± standard deviation for the initial and final measurements of total cholesterol concentration for women and men combined (a), low-density lipoprotein concentration for women and men (b), high-density lipoprotein concentration for women (c), and high-density lipoprotein concentration for men (d). The asterisk indicates a significant difference (p < 0.05) between the initial and final measurements. The bar at the top of the figure illustrates the category and range for each variable. Note: Women and men have a different target range and are therefore repre- sented in separate graphs. Copyright © 2013 SciRes. OPEN A CCESS  J. S. Gottschall et al. / Open Journal of Preventive Medicine 3 (2013) 132-140 Copyright © 2013 SciRes. 138 Figure 3. Mean ± standard deviation for the initial and final measurements of triglycerides for men and women combined. The asterisk indicates a significant difference (p < 0.05) between the initial and final measurements. The bar at the top of the figure illustrates the category and range for each variable. (a) (b) Figure 4. Mean ± standard deviation for the initial and final measurements of oxygen consumption for women (a) and men (b). The double asterisk indicates a significant difference (p < 0.01) between the initial and final measurements. The bar at the top of the fig- ure illustrates the category and range for each variable. Note: Women and men have a different target range and are therefore repre- sented in separate graphs. insurers, and quality-of-care organizations whose goal is to implement innovative and practical strategies to re- duce obesity, recommend a 5% to 10% sustained reduc- tion in body mass as the appropriate measure of success for effective interventions [11]. The mean body mass for the men in the study was reduced by 5.1% from baseline and on an individual basis 6 men and 5 women had re- ductions of at least 5%. The protocol of this study differed from previous methods, as the participants in the current program were able to choose the type of cardiorespiratory class as well as their weekly schedule. The participants in the refer- enced studies were limited to a single cardiorespiratory exercise and a single strength training routine on specific days of the week for the duration of the respective study [5-7]. Also, they completed their workouts in a labora- OPEN A CCESS  J. S. Gottschall et al. / Open Journal of Preventive Medicine 3 (2013) 132-140 139 Figure 5. Mean ± standard deviation for the initial and final measurements of glucose for men and women combined. The bar at the top of the figure illustrates the cate- gory and range for each variable. (a) (b) Figure 6. Mean ± standard deviation for the initial and final measurements of systolic blood pressure (a) and diastolic blood pressure (b) for men and women combined. The bar at the top of the figure illustrates the category and range for each variable. tory setting and were continually monitored by a re- search assistant. The participants in the present study completed their workouts in the typical fitness class set- ting at a local gym which applies to another STOP Obe- sity Alliance goal of obtaining actionable research with methods that are applicable in actual practice found in everyday life [11]. Overall, even with the independent schedule and un- supervised sessions, our data are comparable to past re- ports and even surpass numerous studies referenced in The American Heart Association (AHA) exercise inter- vention meta-analysis. For example, the AHA states that the average increase in HDL-C concentration is 4.6% from baseline values [12]. The men in the present group fitness program had a statistically significant increase in HDL-C concentration of 12.2% from the baseline value. To add, the average decrease for triglyceride concentra- tion is 3.7% while the decrease with the current protocol Copyright © 2013 SciRes. OPEN A CCESS  J. S. Gottschall et al. / Open Journal of Preventive Medicine 3 (2013) 132-140 140 was 29.9% for the men. The greater differences from the AHA values may be due to the higher exercise intensity from the group fitness classes. The participants in the present study wore heart rate monitors with a download- able data component during each class and in the future we will expand upon the topic of intensity with a full analysis of the exercise zones. The primary limitation of this study was the absence of a control group. Due to our promising results, we in- tend to expand upon this pilot study and compare this protocol to similar fitness regimens. We also plan to in- clude dietary journals to track calorie consumption and nutritional intake for the duration of the program. Par- ticipants were asked not to alter their daily diet habits but we do not have any formal data to demonstrate that diet was not a significant factor. Despite these limitations, our data indicate that a 30-week multi-modal group fit- ness program can satisfy the physical activity recom- mendations while minimizing attrition and maximizing health benefits. 5. ACKNOWLEDGEMENTS We thank The Pennsylvania State University Social Science Re- search Institute for the funding to complete the study and The Athletic Clubs of State College for providing complimentary memberships. We also want to recognize the dedicated participants, their work created these impressive results. Finally, the study would not be possible with- out talented Clinical Research Center staff or the elite North Club in- structor team. REFERENCES [1] 2008 Physical Activity Guidelines for Americans (2008) Health and human services. Washington DC. [2] Centers for Disease Control and Prevention (2012) Be one in a million this American heart month. [3] Surgeon General (1999) Physical Activity and health promotion. Atlanta. [4] (2009) ACSM’s guidelines for exercise testing and pre- scription. Lippincott Williams & Wilkins, Philadelphia. [5] Park, S.K., Park, J.H., Kwon, Y.C., Kim, H.S., Yoon, M.S. and Park, H.T. (2003) The effect of combined aerobic and resistance exercise training on abdominal fat in obese middle-aged women. Journal of Physiological Anthro- pology and Applied Human Science, 22, 129-135. doi:10.2114/jpa.22.129 [6] Libardi, C.A., De Souza, G.V., Cavaglieri, C.R., Madruga, V.A. and Chacon-Mikahil, M.P. (2012) Effect of resis- tance, endurance, and concurrent training on TNF-alpha, IL-6, and CRP. Medicine & Science in Sports & Exercise, 44, 50-56. doi:10.1249/MSS.0b013e318229d2e9 [7] McCarthy, C.J., Mills, P.M., Pullen, R., Roberts, C., Sil- man, A. and Oldham, J.A. (2004) Supplementing a home exercise programme with a class-based exercise pro- gramme is more effective than home exercise alone in the treatment of knee osteoarthritis. Rheumatology (Oxford), 43, 880-886. doi:10.1093/rheumatology/keh188 [8] Nielsen, A.C. (2007) National readership survey and panorama. Auckland. [9] (2010) International health, IHRSA’s member census. [10] Donnelly, J.E., Blair, S.N., Jakicic, J.M., Manore, M.M., Rankin, J.W. and Smith, B.K. (2009) American college of sports medicine position stand. Appropriate physical ac- tivity intervention strategies for weight loss and preven- tion of weight regain for adults. Medicine & Science in Sports & Exercise, 41, 459-471. doi:10.1249/MSS.0b013e3181949333 [11] (2012) Strategies to overcome and prevent obesity alli- ance: Policy recommendations. D.o.H. Policy, Washing- ton DC. [12] Thompson, P.D. (2003) Exercise and physical activity in the prevention and treatment of atherosclerotic cardio- vascular disease. Arteriosclerosis, Thrombosis, and Vas- cular Biology, 23, 1319-1321. doi:10.1161/01.ATV.0000087143.33998.F2 Copyright © 2013 SciRes. OPEN A CCESS |