

Paper Menu >>
Journal Menu >>
 Journal of Behavioral and Brain Science, 2013, 3, 1-6 http://dx.doi.org/10.4236/jbbs.2013.31001 Published Online February 2013 (http://www.scirp.org/journal/jbbs) The Effect of Food Images on Mood and Arousal Depends on Dietary Histories and the Fat and Sugar Content of Foods Depicted Gregory J. Privitera*, Danielle E. Antonelli, Heather E. Creary Department of Psychology, St. Bonaventure University, St. Bonaventure, USA Email: *[email protected] Received November 15, 2012; revised November 23, 2012; accepted February 16, 2013 ABSTRACT Background: While brain imaging studies show that reward regions in the human brain that regulate reward-guided behavior and integrate sensory modalities of smell, taste, and texture respond preferentially to high calorie foods, few studies account for dietary histories or account for recent behavioral evidence showing preferential responding for fruits (a low calorie food that tastes sweet). To address these concerns, the present study tested the hypothesis that images of high/low fat and sugar foods, even sugary foods that are low calorie (i.e., fruits), will enhance emotional responsiveness and that these changes may be related to dietary histories with fat and sugar intake. Method: Participants were shown 4 sets of 15 food images with each food image automatically timed every 9 s to transition to a new food image; partici- pant pre-post mood and arousal was measured. The 4 sets of food images were high fat-high sugar (HFHS; desserts), high fat-low sugar (HFLS; fried foods), low fat-high sugar (LFHS; fruits), or low fat-low sugar (LFLS; vegetables) foods. To account for dietary histories, participants also completed estimated daily intake scales (EDIS) for sugar and fat. Results: Mood and arousal significantly increased in all groups, except Group LFLS, and even in a group that was low calorie but shown foods that taste sweet, i.e., Group LFHS. Interestingly, changes in arousal, but not mood, were dependent on participant histories with sugar and fat intake. Conclusion: Changes in emotional responsiveness to food images were nutrient-specific, which can be a more detailed level of analysis for assessing responsiveness to food im- ages. Also, participant histories with sugar and fat should be taken into account as these histories can explain the changes in arousal observed here. Keywords: Fat; Sugar; Mood; Arousal; Dietary History 1. Introduction Emotional regulation and eating behavior are indubitably related [1-3], with many people allowing their emotions to regulate food intake in order to maintain and promote emotional well-being [4,5]. Emotional changes can often lead to dietary changes, and even modifications of food likes and dislikes [6]. Consumption of comfort foods, of- ten high in fat and sugar, can lead to improved emotional states [7], and yet intake of these foods in response to emotions has been linked to the rising rates in obesity [8,9]. While much of the focus on the link between emotional responsiveness and eating has been on physiological fac- tors, more recent advances now focus on understanding appetitive and cognitive factors, often linked to cortical brain activity [10,11] that may also significantly contrib- ute to the relationship between emotion and foodstuffs. Brain imaging studies show clear evidence that re- ward-related areas in the human brain respond preferen- tially to the sight of high calorie vs. low calorie foods [10, 12]. A consistent pattern across studies shows that brain regions in the temporo-insulo-opercular and orbitofrontal areas—areas involved in regulating reward-guided be- havior and integrating sensory modalities of smell, taste, and texture [13]—are significantly more active during the visual presentation of high calorie vs low calorie foods [10,12,14,15]. Men show similar neuronal activation le- vels regardless of hunger, whereas women show stronger brain reward activation patterns when hungry, but not when sated [12,16]. Interestingly, visual cortical sensory processing is related to the sight of high-calorie, but not low-calorie foods [17]. Overall, these findings suggest that without ever consuming food, men and women have positive, motivational experiences at the mere sight of food, and show greater sensory (visual) processing of high calorie vs low calorie foods. Behavioral data show patterns similar to that from neuroimaging studies. Women, particularly those who *Corresponding author. C opyright © 2013 SciRes. JBBS 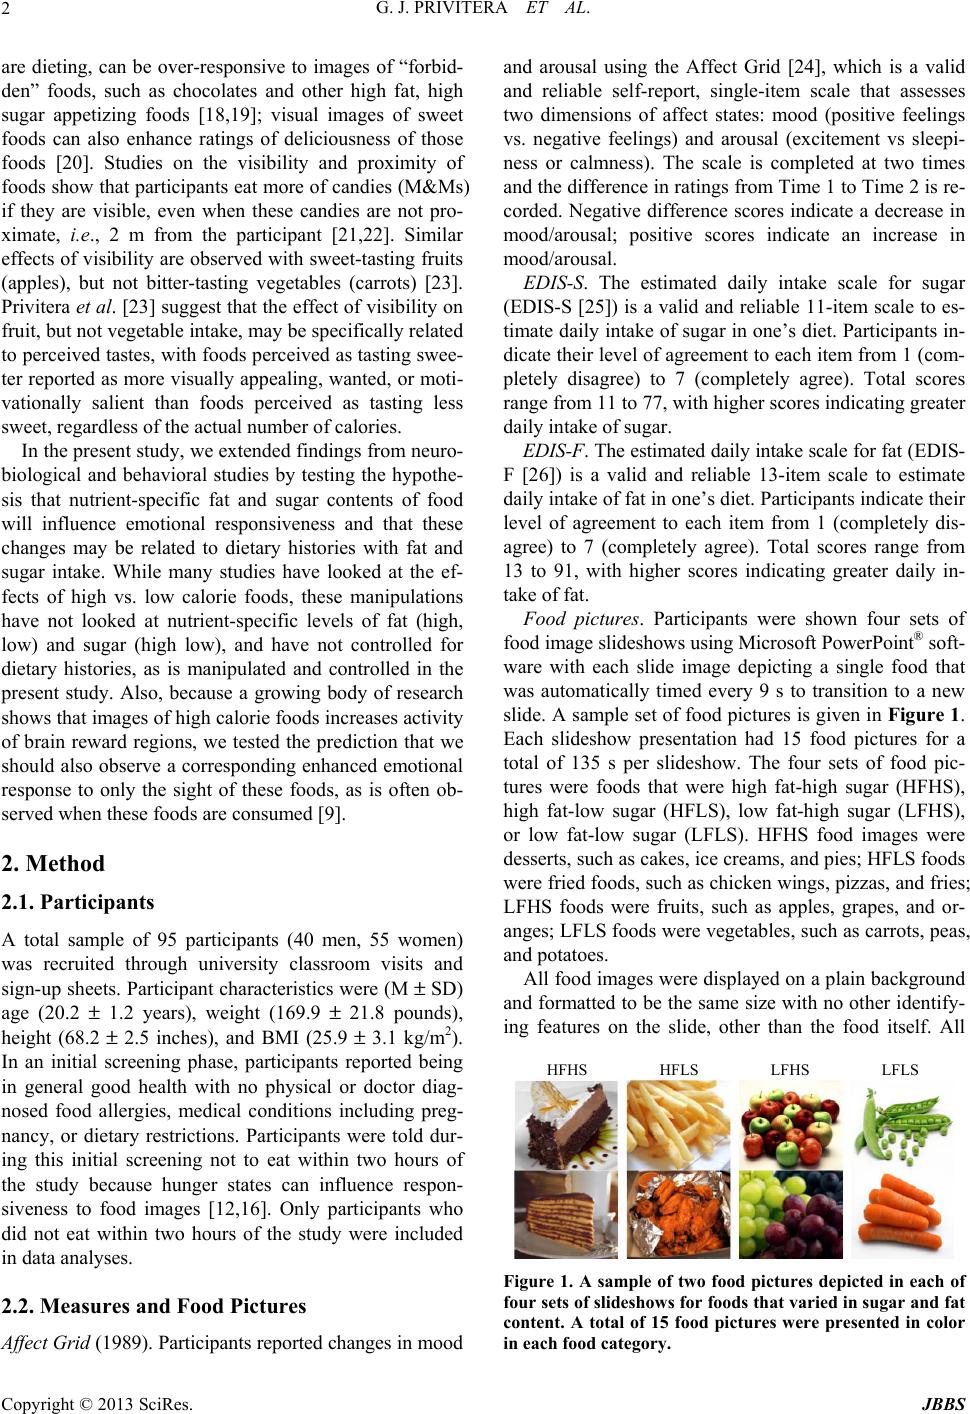 G. J. PRIVITERA ET AL. 2 are dieting, can be over-responsive to images of “forbid- den” foods, such as chocolates and other high fat, high sugar appetizing foods [18,19]; visual images of sweet foods can also enhance ratings of deliciousness of those foods [20]. Studies on the visibility and proximity of foods show that participants eat more of candies (M&Ms) if they are visible, even when these candies are not pro- ximate, i.e., 2 m from the participant [21,22]. Similar effects of visibility are observed with sweet-tasting fruits (apples), but not bitter-tasting vegetables (carrots) [23]. Privitera et al. [23] suggest that the effect of visibility on fruit, but not vegetable intake, may be specifically related to perceived tastes, with foods perceived as tasting swee- ter reported as more visually appealing, wanted, or moti- vationally salient than foods perceived as tasting less sweet, regardless of the actual number of calories. In the present study, we extended findings from neuro- biological and behavioral studies by testing the hypothe- sis that nutrient-specific fat and sugar contents of food will influence emotional responsiveness and that these changes may be related to dietary histories with fat and sugar intake. While many studies have looked at the ef- fects of high vs. low calorie foods, these manipulations have not looked at nutrient-specific levels of fat (high, low) and sugar (high low), and have not controlled for dietary histories, as is manipulated and controlled in the present study. Also, because a growing body of research shows that images of high calorie foods increases activity of brain reward regions, we tested the prediction that we should also observe a corresponding enhanced emotional response to only the sight of these foods, as is often ob- served when these foods are consumed [9]. 2. Method 2.1. Participants A total sample of 95 participants (40 men, 55 women) was recruited through university classroom visits and sign-up sheets. Participant characteristics were (M ± SD) age (20.2 ± 1.2 years), weight (169.9 ± 21.8 pounds), height (68.2 ± 2.5 inches), and BMI (25.9 ± 3.1 kg/m2). In an initial screening phase, participants reported being in general good health with no physical or doctor diag- nosed food allergies, medical conditions including preg- nancy, or dietary restrictions. Participants were told dur- ing this initial screening not to eat within two hours of the study because hunger states can influence respon- siveness to food images [12,16]. Only participants who did not eat within two hours of the study were included in data analyses. 2.2. Measures and Food Pictures Affect Grid (1989). Participants reported changes in mood and arousal using the Affect Grid [24], which is a valid and reliable self-report, single-item scale that assesses two dimensions of affect states: mood (positive feelings vs. negative feelings) and arousal (excitement vs sleepi- ness or calmness). The scale is completed at two times and the difference in ratings from Time 1 to Time 2 is re- corded. Negative difference scores indicate a decrease in mood/arousal; positive scores indicate an increase in mood/arousal. EDIS-S. The estimated daily intake scale for sugar (EDIS-S [25]) is a valid and reliable 11-item scale to es- timate daily intake of sugar in one’s diet. Participants in- dicate their level of agreement to each item from 1 (com- pletely disagree) to 7 (completely agree). Total scores range from 11 to 77, with higher scores indicating greater daily intake of sugar. EDIS-F. The estimated daily intake scale for fat (EDIS- F [26]) is a valid and reliable 13-item scale to estimate daily intake of fat in one’s diet. Participants indicate their level of agreement to each item from 1 (completely dis- agree) to 7 (completely agree). Total scores range from 13 to 91, with higher scores indicating greater daily in- take of fat. Food pictures. Participants were shown four sets of food image slideshows using Microsoft PowerPoint® soft- ware with each slide image depicting a single food that was automatically timed every 9 s to transition to a new slide. A sample set of food pictures is given in Figure 1. Each slideshow presentation had 15 food pictures for a total of 135 s per slideshow. The four sets of food pic- tures were foods that were high fat-high sugar (HFHS), high fat-low sugar (HFLS), low fat-high sugar (LFHS), or low fat-low sugar (LFLS). HFHS food images were desserts, such as cakes, ice creams, and pies; HFLS foods were fried foods, such as chicken wings, pizzas, and fries; LFHS foods were fruits, such as apples, grapes, and or- anges; LFLS foods were vegetables, such as carrots, peas, and potatoes. All food images were displayed on a plain background and formatted to be the same size with no other identify- ing features on the slide, other than the food itself. All HFHS HFLS LFHS LFLS Figure 1. A sample of two food pictures depicted in each of four sets of slideshows for foods that varied in sugar and fat content. A total of 15 food pictures were presented in color in each food category. Copyright © 2013 SciRes. JBBS 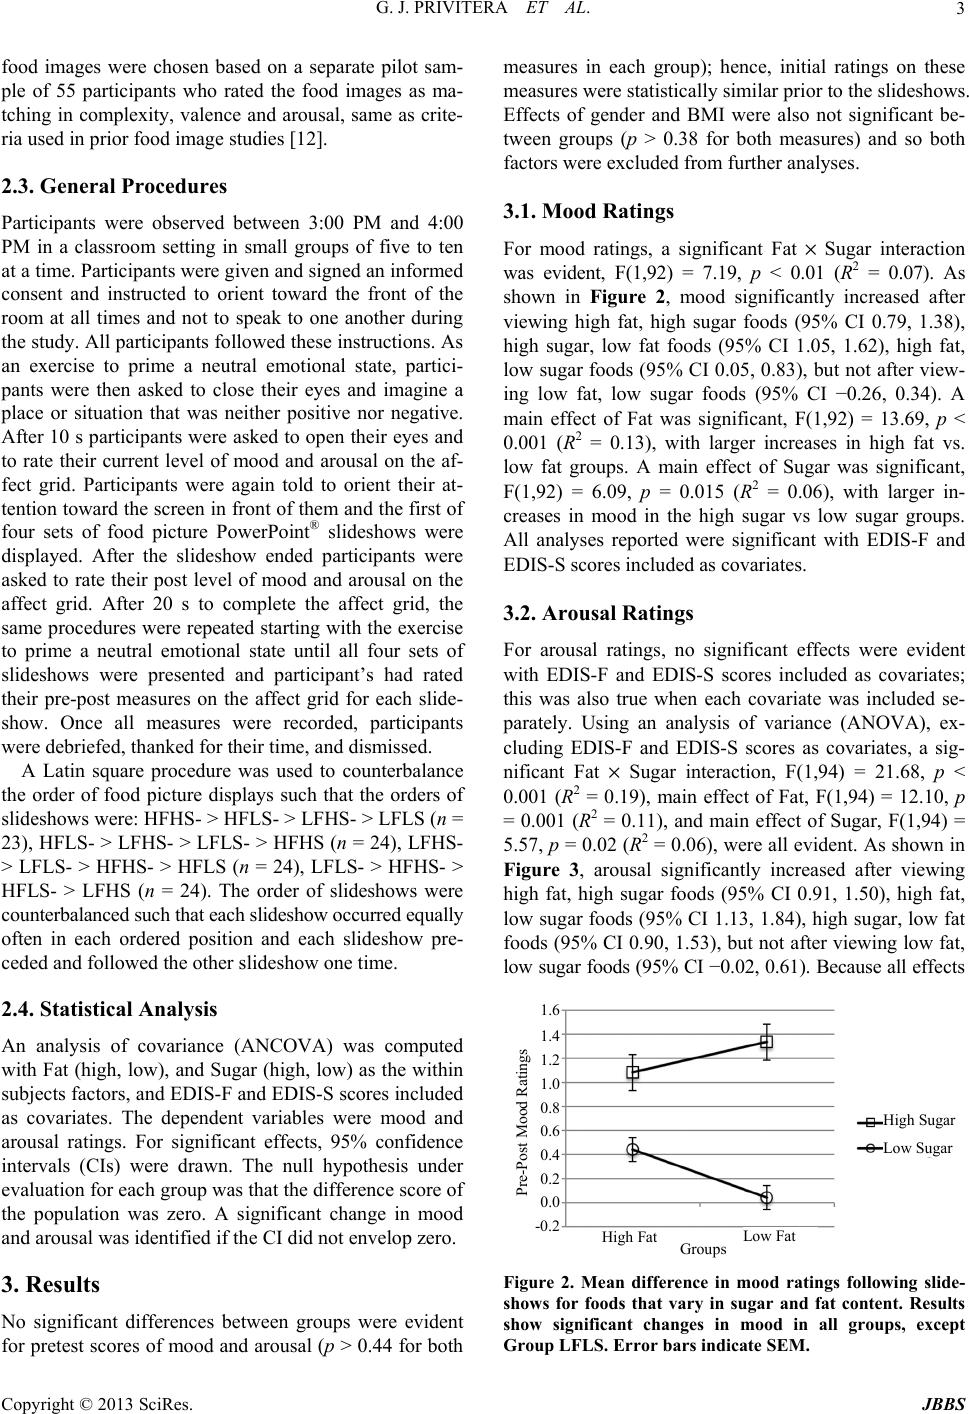 G. J. PRIVITERA ET AL. 3 food images were chosen based on a separate pilot sam- ple of 55 participants who rated the food images as ma- tching in complexity, valence and arousal, same as crite- ria used in prior food image studies [12]. 2.3. General Procedures Participants were observed between 3:00 PM and 4:00 PM in a classroom setting in small groups of five to ten at a time. Participants were given and signed an informed consent and instructed to orient toward the front of the room at all times and not to speak to one another during the study. All participants followed these instructions. As an exercise to prime a neutral emotional state, partici- pants were then asked to close their eyes and imagine a place or situation that was neither positive nor negative. After 10 s participants were asked to open their eyes and to rate their current level of mood and arousal on the af- fect grid. Participants were again told to orient their at- tention toward the screen in front of them and the first of four sets of food picture PowerPoint® slideshows were displayed. After the slideshow ended participants were asked to rate their post level of mood and arousal on the affect grid. After 20 s to complete the affect grid, the same procedures were repeated starting with the exercise to prime a neutral emotional state until all four sets of slideshows were presented and participant’s had rated their pre-post measures on the affect grid for each slide- show. Once all measures were recorded, participants were debriefed, thanked for their time, and dismissed. A Latin square procedure was used to counterbalance the order of food picture displays such that the orders of slideshows were: HFHS- > HFLS- > LFHS- > LFLS (n = 23), HFLS- > LFHS- > LFLS- > HFHS (n = 24), LFHS- > LFLS- > HFHS- > HFLS (n = 24), LFLS- > HFHS- > HFLS- > LFHS (n = 24). The order of slideshows were counterbalanced such that each slideshow occurred equally often in each ordered position and each slideshow pre- ceded and followed the other slideshow one time. 2.4. Statistical Analysis An analysis of covariance (ANCOVA) was computed with Fat (high, low), and Sugar (high, low) as the within subjects factors, and EDIS-F and EDIS-S scores included as covariates. The dependent variables were mood and arousal ratings. For significant effects, 95% confidence intervals (CIs) were drawn. The null hypothesis under evaluation for each group was that the difference score of the population was zero. A significant change in mood and arousal was identified if the CI did not envelop zero. 3. Results No significant differences between groups were evident for pretest scores of mood and arousal (p > 0.44 for both measures in each group); hence, initial ratings on these measures were statistically similar prior to the slideshows. Effects of gender and BMI were also not significant be- tween groups (p > 0.38 for both measures) and so both factors were excluded from further analyses. 3.1. Mood Ratings For mood ratings, a significant Fat × Sugar interaction was evident, F(1,92) = 7.19, p < 0.01 (R2 = 0.07). As shown in Figure 2, mood significantly increased after viewing high fat, high sugar foods (95% CI 0.79, 1.38), high sugar, low fat foods (95% CI 1.05, 1.62), high fat, low sugar foods (95% CI 0.05, 0.83), but not after view- ing low fat, low sugar foods (95% CI −0.26, 0.34). A main effect of Fat was significant, F(1,92) = 13.69, p < 0.001 (R2 = 0.13), with larger increases in high fat vs. low fat groups. A main effect of Sugar was significant, F(1,92) = 6.09, p = 0.015 (R2 = 0.06), with larger in- creases in mood in the high sugar vs low sugar groups. All analyses reported were significant with EDIS-F and EDIS-S scores included as covariates. 3.2. Arousal Ratings For arousal ratings, no significant effects were evident with EDIS-F and EDIS-S scores included as covariates; this was also true when each covariate was included se- parately. Using an analysis of variance (ANOVA), ex- cluding EDIS-F and EDIS-S scores as covariates, a sig- nificant Fat × Sugar interaction, F(1,94) = 21.68, p < 0.001 (R2 = 0.19), main effect of Fat, F(1,94) = 12.10, p = 0.001 (R2 = 0.11), and main effect of Sugar, F(1,94) = 5.57, p = 0.02 (R2 = 0.06), were all evident. As shown in Figure 3, arousal significantly increased after viewing high fat, high sugar foods (95% CI 0.91, 1.50), high fat, low sugar foods (95% CI 1.13, 1.84), high sugar, low fat foods (95% CI 0.90, 1.53), but not after viewing low fat, low sugar foods (95% CI −0.02, 0.61). Because all effects 1.6 1.4 1.2 1.0 0.8 0.6 0.4 0.2 0.0 -0.2 Pre-Post Mood Ratings High Sugar Low Sugar Low Fat High FatGroups Figure 2. Mean difference in mood ratings following slide- shows for foods that vary in sugar and fat content. Results show significant changes in mood in all groups, except Group LFLS. Error bars indicate SEM . Copyright © 2013 SciRes. JBBS 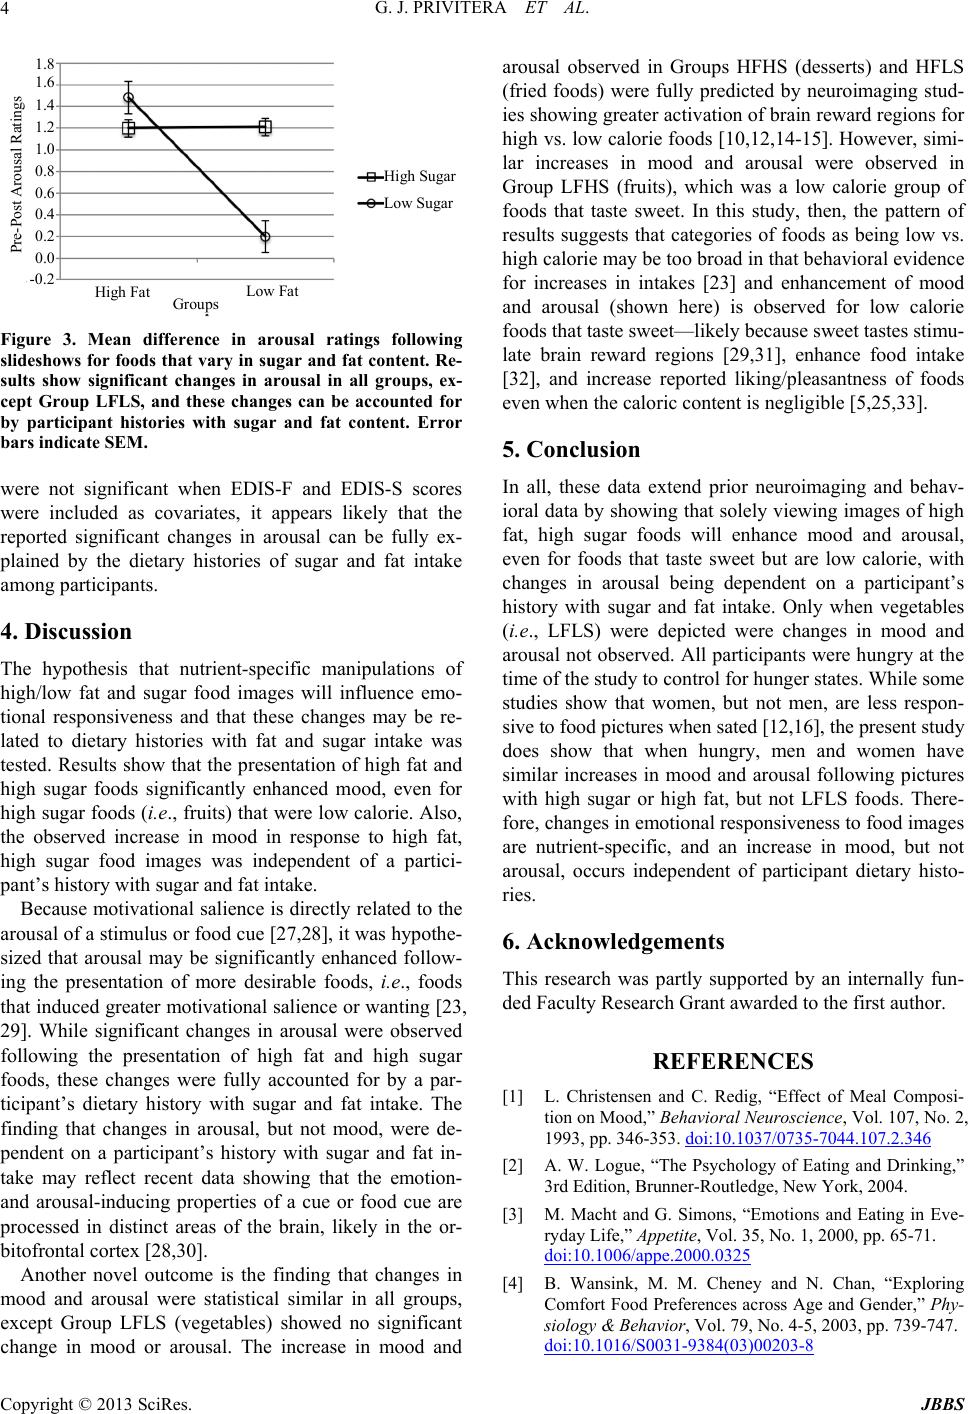 G. J. PRIVITERA ET AL. 4 High Sugar Low Sugar 1.8 1.6 1.4 1.2 1.0 0.8 0.6 0.4 0.2 0.0 -0.2 High Fat Low Fat Groups Pre-Post Arousal Ratings Figure 3. Mean difference in arousal ratings following slideshows for foods that vary in sugar and fat content. Re- sults show significant changes in arousal in all groups, ex- cept Group LFLS, and these changes can be accounted for by participant histories with sugar and fat content. Error bars indicate SEM. were not significant when EDIS-F and EDIS-S scores were included as covariates, it appears likely that the reported significant changes in arousal can be fully ex- plained by the dietary histories of sugar and fat intake among participants. 4. Discussion The hypothesis that nutrient-specific manipulations of high/low fat and sugar food images will influence emo- tional responsiveness and that these changes may be re- lated to dietary histories with fat and sugar intake was tested. Results show that the presentation of high fat and high sugar foods significantly enhanced mood, even for high sugar foods (i.e., fruits) that were low calorie. Also, the observed increase in mood in response to high fat, high sugar food images was independent of a partici- pant’s history with sugar and fat intake. Because motivational salience is directly related to the arousal of a stimulus or food cue [27,28], it was hypothe- sized that arousal may be significantly enhanced follow- ing the presentation of more desirable foods, i.e., foods that induced greater motivational salience or wanting [23, 29]. While significant changes in arousal were observed following the presentation of high fat and high sugar foods, these changes were fully accounted for by a par- ticipant’s dietary history with sugar and fat intake. The finding that changes in arousal, but not mood, were de- pendent on a participant’s history with sugar and fat in- take may reflect recent data showing that the emotion- and arousal-inducing properties of a cue or food cue are processed in distinct areas of the brain, likely in the or- bitofrontal cortex [28,30]. Another novel outcome is the finding that changes in mood and arousal were statistical similar in all groups, except Group LFLS (vegetables) showed no significant change in mood or arousal. The increase in mood and arousal observed in Groups HFHS (desserts) and HFLS (fried foods) were fully predicted by neuroimaging stud- ies showing greater activation of brain reward regions for high vs. low calorie foods [10,12,14-15]. However, simi- lar increases in mood and arousal were observed in Group LFHS (fruits), which was a low calorie group of foods that taste sweet. In this study, then, the pattern of results suggests that categories of foods as being low vs. high calorie may be too broad in that behavioral evidence for increases in intakes [23] and enhancement of mood and arousal (shown here) is observed for low calorie foods that taste sweet—likely because sweet tastes stimu- late brain reward regions [29,31], enhance food intake [32], and increase reported liking/pleasantness of foods even when the caloric content is negligible [5,25,33]. 5. Conclusion In all, these data extend prior neuroimaging and behav- ioral data by showing that solely viewing images of high fat, high sugar foods will enhance mood and arousal, even for foods that taste sweet but are low calorie, with changes in arousal being dependent on a participant’s history with sugar and fat intake. Only when vegetables (i.e., LFLS) were depicted were changes in mood and arousal not observed. All participants were hungry at the time of the study to control for hunger states. While some studies show that women, but not men, are less respon- sive to food pictures when sated [12,16], the present study does show that when hungry, men and women have similar increases in mood and arousal following pictures with high sugar or high fat, but not LFLS foods. There- fore, changes in emotional responsiveness to food images are nutrient-specific, and an increase in mood, but not arousal, occurs independent of participant dietary histo- ries. 6. Acknowledgements This research was partly supported by an internally fun- ded Faculty Research Grant awarded to the first author. REFERENCES [1] L. Christensen and C. Redig, “Effect of Meal Composi- tion on Mood,” Behavioral Neuroscience, Vol. 107, No. 2, 1993, pp. 346-353. doi:10.1037/0735-7044.107.2.346 [2] A. W. Logue, “The Psychology of Eating and Drinking,” 3rd Edition, Brunner-Routledge, New York, 2004. [3] M. Macht and G. Simons, “Emotions and Eating in Eve- ryday Life,” Appetite, Vol. 35, No. 1, 2000, pp. 65-71. doi:10.1006/appe.2000.0325 [4] B. Wansink, M. M. Cheney and N. Chan, “Exploring Comfort Food Preferences across Age and Gender,” Phy- siology & Behavior, Vol. 79, No. 4-5, 2003, pp. 739-747. doi:10.1016/S0031-9384(03)00203-8 Copyright © 2013 SciRes. JBBS  G. J. PRIVITERA ET AL. 5 [5] G. J. Privitera, “The Psychological Dieter: It’s Not All about the Calories,” University Press of America, Lan- ham, 2008. [6] A. Letarte, L. Dubé and V. Troche, “Similarities and Dif- ferences in Affective and Cognitive Origins of Food Lik- ings and Dislikes,” Appetite, Vol. 28, No. 2, 1997, pp. 115-129. doi:10.1006/appe.1996.0069 [7] L. Dubé, J. L. LeBel and J. Lu, “Affect Asymmetry and Comfort Food Consumption,” Physiology & Behavior, Vol. 86, No. 4, 2005, pp. 559-567. doi:10.1016/j.physbeh.2005.08.023 [8] M. S. Faith, D. B. Allison and A. Geliebter, “Emotional Eating and Obesity: Theoretical Considerations and Prac- tical Recommendations,” In: S. Dalton, Ed., Overweight and Weight Management: The Health Professional’s Gu i d e to Understanding and Practice, Aspen Publishers, Gaith- ersburg, 1997, pp. 439-465. [9] S. C. Sanderson, “Obesity Risk,” In: K. P. Tercyak, Ed., Handbook of Genomics and the Family: Psychosocial Context for Children and Adolescents, Springer Science + Business Media, New York, 2010, pp. 329-343. [10] W. D. Killgore, A. D. Young, L. A. Femia, P. Bogorodzki, J. Rogowska and D. A. Yurgelun-Todd, “Cortical and Limbic Activation during Viewing of High- versus Low- Calorie Foods,” Neuroimage, Vol. 19, No. 4, 2003, pp. 1381-1394. doi:10.1016/S1053-8119(03)00191-5 [11] W. K. Simmons, A. Martin and L. W. Barsalou, “Pictures of Appetizing Foods Activate Gustatory Cortices for Taste and Reward,” Cerebral Cortex, Vol. 15, No. 10, 2005, pp. 1602-1608. doi:10.1093/cercor/bhi038 [12] S. Frank, N. Laharnar, S. Kullmann, R. Veit, C. Canova, Y. L. Hegner, et al., “Processing of Food Pictures: Influ- ence of Hunger, Gender and Calorie Content,” Brain Re- search, Vol. 1350, 2010, pp. 159-166. doi:10.1016/j.brainres.2010.04.030 [13] E. T. Rolls, “The Rules of Formation of the Olfactory Re- presentations Found in the Orbitofrontal Cortex Olfactory Areas in Primates,” Chemical Senses, Vol. 26, No. 5, 2001, pp. 595-604. doi:10.1093/chemse/26.5.595 [14] K. Porubská, R. Veit, H. Preissl, A. Fritsche and N. Bir- baumer, “Subjective Feeling of Appetite Modulates Brain Activity: An fMRI Study,” Neuroimage, Vol. 32, No. 3, 2006, pp. 1273-1280. doi:10.1016/j.neuroimage.2006.04.216 [15] G. J. Wang, N. D. Volkow, F. Telang, M. Jayne, J. Ma, M. Rao, et al., “Exposure to Appetitive Food Stimuli Mark- edly Activates the Human Brain,” Neuroimage, Vol. 21, No. 4, 2004, pp. 1790-1797. doi:10.1016/j.neuroimage.2003.11.026 [16] G. J. Wang, N. D. Volkow, F. Telang, M. Jayne, Y. Ma, K. Pradhan, et al., “Evidence of Gender Differences in the Ability to Inhibit Brain Activation Elicited by Food Stimulation,” Proceedings of the National Academy of Sciences, Vol. 106, No. 4, 2009, pp. 1249-1254. [17] W. D. Killgore and D. A. Yurgelun-Todd, “Positive Af- fect Modulates Activity in the Visual Cortex to Images of High Calorie Foods,” International Journal of Neurosci- ence, Vol. 117, No. 5, 2007, pp. 643-653. doi:10.1080/00207450600773848 [18] B. Fletcher, K. J. Pine, Z. Woodridge and A. Nash, “How Visual Images of Chocolate Affect the Craving and Guilt of Female Dieters,” Appetite , Vol. 48, No. 2, 2007, pp. 211-217. doi:10.1016/j.appet.2006.09.002 [19] D. D. Wagner, R. G. Boswell, W. M. Kelley and T. F. Heatherton, “Inducing Negative Affect Increases the Re- ward Value of Appetizing Foods in Dieters,” Journal of Cognitive Neuroscience, Vol. 24, No. 7, 2012, pp. 1625- 1633. doi:10.1162/jocn_a_00238 [20] H. Yoshimura, M. Honjo, T. Sugai, M. Kawabe, K. Kane- yama, N. Segami and N. Kato, “Influences of Audio-Vi- sual Environments on Feelings of Deliciousness during Having Sweet Foods: An Electroencephalogram Frequency Analysis Study,” Nutritional Neuroscience, Vol. 14, No. 5, 2011, pp. 210-215. [21] J. E. Painter, B. Wansink and J. B. Hieggelke, “How Visi- bility and Convenience Influence Candy Consumption,” Appetite, Vol. 38, No. 3, 2002, pp. 237-238. doi:10.1006/appe.2002.0485 [22] B. Wansink, J. E. Painter and Y.-K. Lee, “The Office Candy Dish: Proximity’s Influence on Estimated and Ac- tual Consumption,” International Journal of Obesity, Vol. 30, No. 5, 2006, pp. 871-875. doi:10.1038/sj.ijo.0803217 [23] G. J. Privitera and H. E. Creary, “Proximity and Visibility of Fruits and Vegetables Influences Intake in a Kitchen Setting among College Students,” Environment and Be- havior, in Press. doi:10.1177/0013916512442892 [24] J. A. Russell, A. Weiss and G. A. Mendelsohn, “Affect Grid: A Single-Item Scale of Pleasure and Arousal,” Jour- nal of Personality and Social Psychology, Vol. 57, No. 3, 1989, pp. 493-502. doi:10.1037/0022-3514.57.3.493 [25] G. J. Privitera and M. Wallace, “An Assessment of Liking for Sugars Using the Estimated Daily Intake Scale,” Ap- petite, Vol. 56, No. 1, 2011, pp. 713-718. doi:10.1016/j.appet.2011.02.008 [26] G. J. Privitera and C. S. Freeman, “Validity and Reliabil- ity of an Estimated Daily Intake Scale for Fat,” Global Journal of Health Science, Vol. 4, No. 2, 2012, pp. 36-41. doi:10.5539/gjhs.v4n2p36 [27] P. J. Lang and M. Davis, “Emotion, Motivation, and the Brain: Reflex Foundations in Animal and Human Re- search,” Progress in Brain Research, Vol. 156, 2006, pp. 3-29. [28] M. Rothkirch, K. Schmack, F. Schlagenhauf and P. Ster- zer, “Implicit Motivational Value and Salience are Proc- essed in Distinct Areas of Orbitofrontal Cortex,” Neuro- image, Vol. 62, No. 3, 2012, pp. 1717-1725. doi:10.1016/j.neuroimage.2012.06.016 [29] A. E. Kelley and K. C. Berridge, “The Neuroscience of Natural Rewards: Relevance to Addictive Drugs,” The Journal of Neuroscience, Vol. 22, No. 9, 2002, pp. 3306- 3311. [30] M. L. Kringelbach, “The Human Orbitofrontal Cortex: Linking Reward to Hedonic Experience,” Nature Reviews Neuroscience, Vol. 6, No. 9, 2005, pp. 691-702. doi:10.1038/nrn1747 [31] W. Schultz, “Neural Coding of Basic Reward Terms of Copyright © 2013 SciRes. JBBS  G. J. PRIVITERA ET AL. Copyright © 2013 SciRes. JBBS 6 Animal Learning Theory, Game Theory, and Microeco- nomics and Behavioural Ecology,” Current Opinion in Neurobiology, Vol. 14, No. 2, 2004, pp. 139-147. doi:10.1016/j.conb.2004.03.017 [32] E. D. Capaldi and G. J. Privitera, “Decreasing Dislike for Sour and Bitter in Children and Adults,” Appetite, Vol. 50, No. 1, 2008, pp. 139-145. doi:10.1016/j.appet.2007.06.008 [33] G. J. Privitera, C. P. Mulcahey and C. M. Orlowski, “Human Sensory Preconditioning in a Flavor Preference Paradigm,” Appetite, Vol. 59, No. 2, 2012, pp. 414-418. doi:10.1016/j.appet.2012.06.005 |