

Paper Menu >>
Journal Menu >>
 Vol.3, No.1, 22-27 (2013) Open Journal of Preventive Medicine http://dx.doi.org/10.4236/ojpm.2013.31003 Temporal variation in cardiovascular disease risk predicted by albuminuria: An opportunity for clinical intervention? Katina D’Onise1, Robyn McDermott1, Adrian Esterman1, Bradley McCulloch2 1Sansom Institute, University of South Australia, Adelaide, Australia; Katina.d’[email protected] 2Tropical Regional Services, Queensland Health and School of Public Health, James Cook University, Townsville, Australia Received 27 September 2012; revised 31 October 2012; accepted 8 November 2012 ABSTRACT Albuminuria predict s cardiov ascular disease (CVD) events but it is likely to vary over time in a non- linear fashion. The aim of this study was to es- timate the potentially differing predictive effect of albuminuria on the risk of CVD or related death over time. Data were from a cohort study of 3505 predominately indigenous adults from remote communities in Queensland, Australia, 1999-2006. Cox Proportional Hazards model analysis of the predictive effects of urinary al- bumin creatinine ratio on the risk of CVD or CVD-related death was undertaken for incident and prevalent CVD. Analyses sequentially re- moved those w ho had a cardiovascular event or related death for the first year through to six years. The baseline prevalence of microalbu- minuria was 21.2% and for macroalbuminuria 6.7%. The incidence of CVD was 92 in 13,812 person-years. Microalbuminuria predicted inci- dent CVD with a Hazard Ratio (HR) of 3.0 (95 % CI 1.83 - 4.96) and for macroalbuminuria HR 10.8 (95% CI 6.58 - 17.68) and for those with pre-ex- isting CVD, HR 2.6 (95% CI 1.65 - 3.97) and HR 9.7 (95% CI 6.38 - 14.82) respectively. People with macroalbuminuria who survived the first three years had a crude HR of an incident car- diovascular event or death of 13.0 (95% CI 6.45 - 26.39) to a peak of 32.3 (95% CI 8.55 - 121.77) for those who survived the first five years. The hazard appeared t o drop in the 6th y ear although this is based on small numbers. The first three years after finding macroalbuminuria provide a potential window opportuni ty to activ ely manage the risk of incident C VD before the risk elevates . Keywords: Cardiovascular Diseases; Albuminuria; Mortality; Risk Factors; Epidemiology 1. INTRODUCTION Albuminuria is a well established independent risk factor for cardiovascular disease events and associated mortality. This has been reported in both high risk and general population cohorts [1-3]. The mechanism for this association is not clear, however a number of hypotheses have been proposed. The association may be accounted for by albuminuria as a marker of reduced renal function, which is associated with increased cardiovascular disease (CVD) risk [4]. Additionally, it may be that widespread endothelial damage leads both to albuminuria and CVD through enhanced atherogenesis [4]. It is also possible that a common factor, such as hypertension, leads to both albuminuria and CVD [5]. The range of studies reporting this association assume constant risk (or hazard) over time. This is unlikely to be true biologically as a high level of macroalbuminuria is more likely in an advanced stage of disease such that the risk of a cardiovascular event is greater in the short term than those with lesser levels of macroalbuminuria, all other factors equal. As such, using a model such as the Cox model which assumes constant hazard over time may not adequately estimate the risk of albuminuria for cardiovascular disease. In this scenario, the hazard over the length of the study period may overestimate the risk in the short term and underestimate it in the long term. This has implications on the importance clinicians place on management of albuminuria in the prevention of both advanced renal and cardiovascular disease in the short term to reduce greater risk in the long term. To examine this further, we used data from the Well Person’s Health Check (WPHC), a cohort study in North Queensland conducted in 26 remote Aboriginal and Tor- res Strait Islander communities [6]. This general popula- tion cohort has previously documented high levels of albuminuria and CVD [7] and so provides an opportunity to examine the effect of changing risk of albuminuria on cardiovascular disease over time. Copyright © 2013 SciRes. OPEN ACCE SS  K. D’Onise et al. / Open Journal of Preventive Medicine 3 (2013) 22-27 23 2. MATERIALS AND METHODS 2.1. Study Population Baseline data were collected from 3505 people in 26 rural Indigenous communities in Far North Queensland, who participated in the “Well Person’s Health Check” between 1999 and 2000 (methods for this cross-sectional study have been reported in detail elsewhere [6]). Based on the local census data, the study achieved a participa- tion rate of 44.5% with greater participation noted in smaller communities. 2.2. Albumin Creatinine Ratio All participants were asked to provide urine from the first morning void or to delay providing the sample for at least two hours from the most recent void. First catch urine samples were self-collected in a sterile 50 ml con- tainer. All urine specimens were refrigerated at four to eight degrees centigrade immediately following collec- tion. A five to ten millilitre sample from the collection jar was transferred into a ten-millilitre tube. Dipstick urinalysis (Combur-test, Roche) was performed on the remaining sample and the results for protein recorded. For the first 15 months of the recruitment period (of a total recruitment period of 34 months) albumin creatinine ratio (ACR) testing was performed when the participants’ urine contained protein (detected on urinalysis) or they were known to have diabetes, hypertension or had a body mass index over 30 kg/m2. For the subsequent 19 months of recruitment ACR testing was performed routinely on all urine specimens [6]. Microalbuminuria was defined as a urinary ACR of 3.4 mg/mmol to 33.9 mg/mmol and macroalbuminuria of 34 mg/mmol or greater. 2.3. CVD Event or Related Death A cardiovascular event or related death was deter- mined from unit-level record linkage of the cohort mem- bers to hospitalisation records and deaths up to a census date of 1 January 2006. Hospitalisation and death records for consenting WPHC participants were identified by a manual search (conducted by a registered nurse with experience working in the region) of the Queensland Health hospital records systems. As there is no unique patient identifier in Queensland, a mapping table, which linked WPHC reference number, hospital facility code and local unit record number, was developed. This table was subsequently applied to the Queensland Hospital Admitted Patient Data Collection, and hospitalisation relevant to the match unit record, facility code tuples were extracted. Matching of death records was per- formed manually at the Queensland Registry of Births, Deaths and Marriages. Hospitalisations were considered to be CVD related if they contained an International Classification of Diseases, ninth revision, clinical modification (ICD-9-CM) code commencing with 410, 411, 413 or 414, or an ICD-9-CM procedure code between 3600 and 3699, inclusive. For hospitalisations coded to the International Classification of Diseases, 10th revision, the diagnosis code range I20 - I25, and procedure code blocks 669 - 679, inclusive, were used. Both incident CVD and a separate analysis on the whole sample that also included those with pre-existing CVD were undertaken. Prior cardiovascular disease was determined from participant report of a history of car- diovascular disease or from a case note review at study entry or hospitalisation (using the same International Classification of Diseases codes as above) recorded prior to study entry. 2.4. Baseline Data Current smoking was defined as regular smoking of at least one cigarette a day. Blood pressure was the average of three measurements taken while seated over a ten minute period. Height and weight were measured, with weight recorded to the nearest 0.1 kg and height recorded to the nearest centimetre. Body mass index was calcu- lated as weight (kg) divided by the height squared (m2) and categorised by using WHO definition of overweight and obesity [8]. Blood for total cholesterol was collected by trained health staff. Blood was collected in an eight point millili- tre clotted (SST) vacuum tube which was spun for 10 minutes in a portable centrifuge within one hour of col- lection and measured by photometric enzyme end point assay, using the Cobas Integra 700/400 (Roche Diagnos- tics, New York, USA). Prior history of diabetes at baseline was determined from a report at interview of diabetes or case note review or a fasting blood glucose level of ≥7 mmol/L, 2-hour glucose tolerance test result of ≥11.1 mmol/L at study entry, or documented hospitalisation for diabetes prior to study entry (through the linkage process described above for ICD-09 codes E11-E14). 2.5. Study Sample Those who did not have an ACR measured (n = 643) and missing data on variables blood pressure or smoking (a further n = 413), date of the first screen (n = 1) or for cause of death (n = 3) lead to a sample for analysis of 2445. Exclusion of those with pre-existing CVD brought the sample to 2349. As noted above, the majority of the ACR data were missing due to the selection criteria of the study and not at random. 2.6. Analysis A descriptive analysis was undertaken comparing Copyright © 2013 SciRes. OPEN ACCE SS 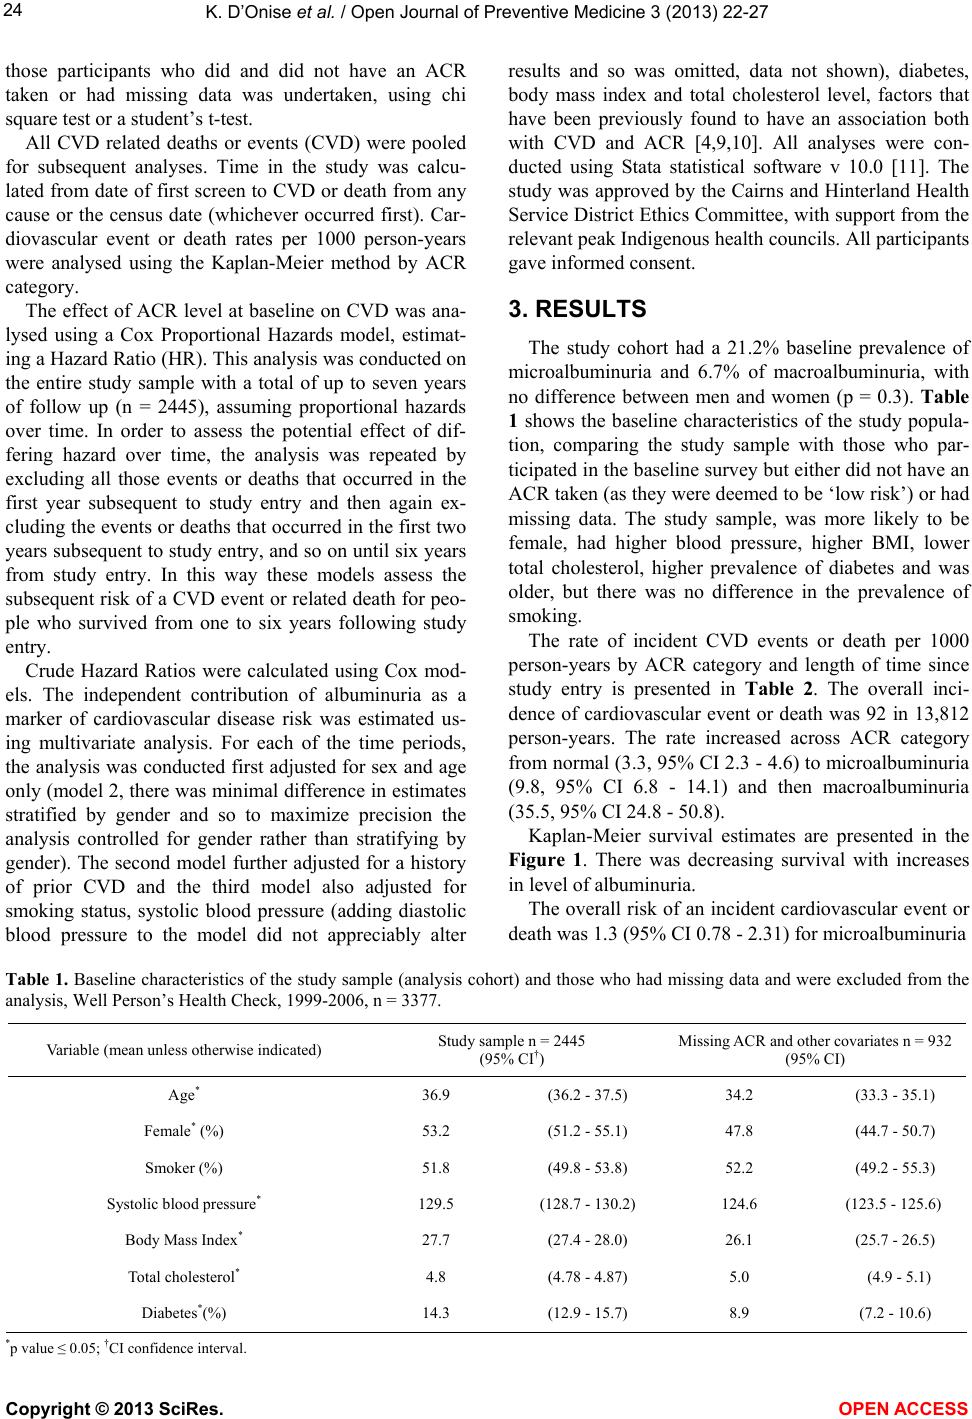 K. D’Onise et al. / Open Journal of Preventive Medicine 3 (2013) 22-27 Copyright © 2013 SciRes. OPEN ACCE SS 24 those participants who did and did not have an ACR taken or had missing data was undertaken, using chi square test or a student’s t-test. All CVD related deaths or events (CVD) were pooled for subsequent analyses. Time in the study was calcu- lated from date of first screen to CVD or death from any cause or the census date (whichever occurred first). Car- diovascular event or death rates per 1000 person-years were analysed using the Kaplan-Meier method by ACR category. The effect of ACR level at baseline on CVD was ana- lysed using a Cox Proportional Hazards model, estimat- ing a Hazard Ratio (HR). This analysis was conducted on the entire study sample with a total of up to seven years of follow up (n = 2445), assuming proportional hazards over time. In order to assess the potential effect of dif- fering hazard over time, the analysis was repeated by excluding all those events or deaths that occurred in the first year subsequent to study entry and then again ex- cluding the events or deaths that occurred in the first two years subsequent to study entry, and so on until six years from study entry. In this way these models assess the subsequent risk of a CVD event or related death for peo- ple who survived from one to six years following study entry. Crude Hazard Ratios were calculated using Cox mod- els. The independent contribution of albuminuria as a marker of cardiovascular disease risk was estimated us- ing multivariate analysis. For each of the time periods, the analysis was conducted first adjusted for sex and age only (model 2, there was minimal difference in estimates stratified by gender and so to maximize precision the analysis controlled for gender rather than stratifying by gender). The second model further adjusted for a history of prior CVD and the third model also adjusted for smoking status, systolic blood pressure (adding diastolic blood pressure to the model did not appreciably alter results and so was omitted, data not shown), diabetes, body mass index and total cholesterol level, factors that have been previously found to have an association both with CVD and ACR [4,9,10]. All analyses were con- ducted using Stata statistical software v 10.0 [11]. The study was approved by the Cairns and Hinterland Health Service District Ethics Committee, with support from the relevant peak Indigenous health councils. All participants gave informed consent. 3. RESULTS The study cohort had a 21.2% baseline prevalence of microalbuminuria and 6.7% of macroalbuminuria, with no difference between men and women (p = 0.3). Table 1 shows the baseline characteristics of the study popula- tion, comparing the study sample with those who par- ticipated in the baseline survey but either did not have an ACR taken (as they were deemed to be ‘low risk’) or had missing data. The study sample, was more likely to be female, had higher blood pressure, higher BMI, lower total cholesterol, higher prevalence of diabetes and was older, but there was no difference in the prevalence of smoking. The rate of incident CVD events or death per 1000 person-years by ACR category and length of time since study entry is presented in Table 2. The overall inci- dence of cardiovascular event or death was 92 in 13,812 person-years. The rate increased across ACR category from normal (3.3, 95% CI 2.3 - 4.6) to microalbuminuria (9.8, 95% CI 6.8 - 14.1) and then macroalbuminuria (35.5, 95% CI 24.8 - 50.8). Kaplan-Meier survival estimates are presented in the Figure 1. There was decreasing survival with increases in level of albuminuria. The overall risk of an incident cardiovascular event or death was 1.3 (95% CI 0.78 - 2.31) for microalbuminuria Table 1. Baseline characteristics of the study sample (analysis cohort) and those who had missing data and were excluded from the analysis, Well Person’s Health Check, 1999-2006, n = 3377. Variable (mean unless otherwise indicated) Study sample n = 2445 (95% CI†) Missing ACR and other covariates n = 932 (95% CI) Age* 36.9 (36.2 - 37.5) 34.2 (33.3 - 35.1) Female* (%) 53.2 (51.2 - 55.1) 47.8 (44.7 - 50.7) Smoker (%) 51.8 (49.8 - 53.8) 52.2 (49.2 - 55.3) Systolic blood pressure* 129.5 (128.7 - 130.2) 124.6 (123.5 - 125.6) Body Mass Index* 27.7 (27.4 - 28.0) 26.1 (25.7 - 26.5) Total cholesterol* 4.8 (4.78 - 4.87) 5.0 (4.9 - 5.1) Diabetes*(%) 14.3 (12.9 - 15.7) 8.9 (7.2 - 10.6) *p value ≤ 0.05; †CI confidence interval. 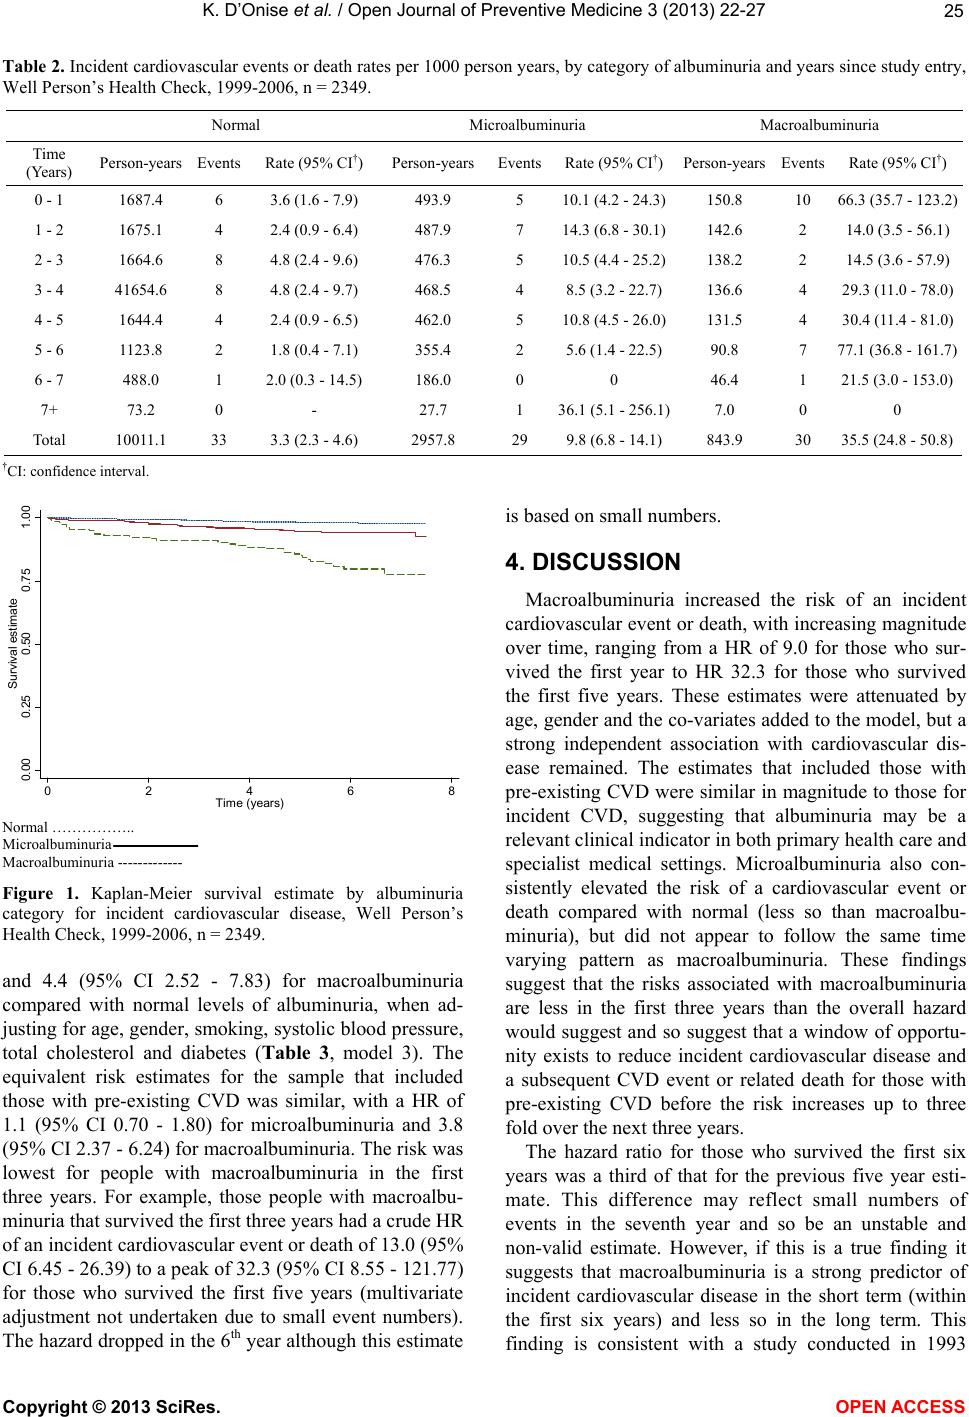 K. D’Onise et al. / Open Journal of Preventive Medicine 3 (2013) 22-27 25 Table 2. Incident cardiovascular events or death rates per 1000 person years, by category of albuminuria and years since study entry, Well Person’s Health Check, 1999-2006, n = 2349. Normal Microalbuminuria Macroalbuminuria Time (Years) Person-years EventsRate (95% CI†) Person-yearsEventsRate (95% CI†)Person-years Events Rate (95% CI†) 0 - 1 1687.4 6 3.6 (1.6 - 7.9) 493.9 5 10.1 (4.2 - 24.3)150.8 10 66.3 (35.7 - 123.2) 1 - 2 1675.1 4 2.4 (0.9 - 6.4) 487.9 7 14.3 (6.8 - 30.1)142.6 2 14.0 (3.5 - 56.1) 2 - 3 1664.6 8 4.8 (2.4 - 9.6) 476.3 5 10.5 (4.4 - 25.2)138.2 2 14.5 (3.6 - 57.9) 3 - 4 41654.6 8 4.8 (2.4 - 9.7) 468.5 4 8.5 (3.2 - 22.7)136.6 4 29.3 (11.0 - 78.0) 4 - 5 1644.4 4 2.4 (0.9 - 6.5) 462.0 5 10.8 (4.5 - 26.0)131.5 4 30.4 (11.4 - 81.0) 5 - 6 1123.8 2 1.8 (0.4 - 7.1) 355.4 2 5.6 (1.4 - 22.5)90.8 7 77.1 (36.8 - 161.7) 6 - 7 488.0 1 2.0 (0.3 - 14.5) 186.0 0 0 46.4 1 21.5 (3.0 - 153.0) 7+ 73.2 0 - 27.7 1 36.1 (5.1 - 256.1)7.0 0 0 Total 10011.1 33 3.3 (2.3 - 4.6) 2957.8 29 9.8 (6.8 - 14.1)843.9 30 35.5 (24.8 - 50.8) †CI: confidence interval. 0.00 0.25 0.50 0.75 1.00 Survival estimate 0 2 4 6 8 Tim e (years) Normal …………….. Microalbuminuria Macroalbuminuria ------------- Figure 1. Kaplan-Meier survival estimate by albuminuria category for incident cardiovascular disease, Well Person’s Health Check, 1999-2006, n = 2349. and 4.4 (95% CI 2.52 - 7.83) for macroalbuminuria compared with normal levels of albuminuria, when ad- justing for age, gender, smoking, systolic blood pressure, total cholesterol and diabetes (Table 3, model 3). The equivalent risk estimates for the sample that included those with pre-existing CVD was similar, with a HR of 1.1 (95% CI 0.70 - 1.80) for microalbuminuria and 3.8 (95% CI 2.37 - 6.24) for macroalbuminuria. The risk was lowest for people with macroalbuminuria in the first three years. For example, those people with macroalbu- minuria that survived the first three years had a crude HR of an incident cardiovascular event or death of 13.0 (95% CI 6.45 - 26.39) to a peak of 32.3 (95% CI 8.55 - 121.77) for those who survived the first five years (multivariate adjustment not undertaken due to small event numbers). The hazard dropped in the 6th year although this estimate is based on small numbers. 4. DISCUSSION Macroalbuminuria increased the risk of an incident cardiovascular event or death, with increasing magnitude over time, ranging from a HR of 9.0 for those who sur- vived the first year to HR 32.3 for those who survived the first five years. These estimates were attenuated by age, gender and the co-variates added to the model, but a strong independent association with cardiovascular dis- ease remained. The estimates that included those with pre-existing CVD were similar in magnitude to those for incident CVD, suggesting that albuminuria may be a relevant clinical indicator in both primary health care and specialist medical settings. Microalbuminuria also con- sistently elevated the risk of a cardiovascular event or death compared with normal (less so than macroalbu- minuria), but did not appear to follow the same time varying pattern as macroalbuminuria. These findings suggest that the risks associated with macroalbuminuria are less in the first three years than the overall hazard would suggest and so suggest that a window of opportu- nity exists to reduce incident cardiovascular disease and a subsequent CVD event or related death for those with pre-existing CVD before the risk increases up to three fold over the next three years. The hazard ratio for those who survived the first six years was a third of that for the previous five year esti- mate. This difference may reflect small numbers of events in the seventh year and so be an unstable and non-valid estimate. However, if this is a true finding it suggests that macroalbuminuria is a strong predictor of incident cardiovascular disease in the short term (within the first six years) and less so in the long term. This finding is consistent with a study conducted in 1993 Copyright © 2013 SciRes. OPEN ACCE SS 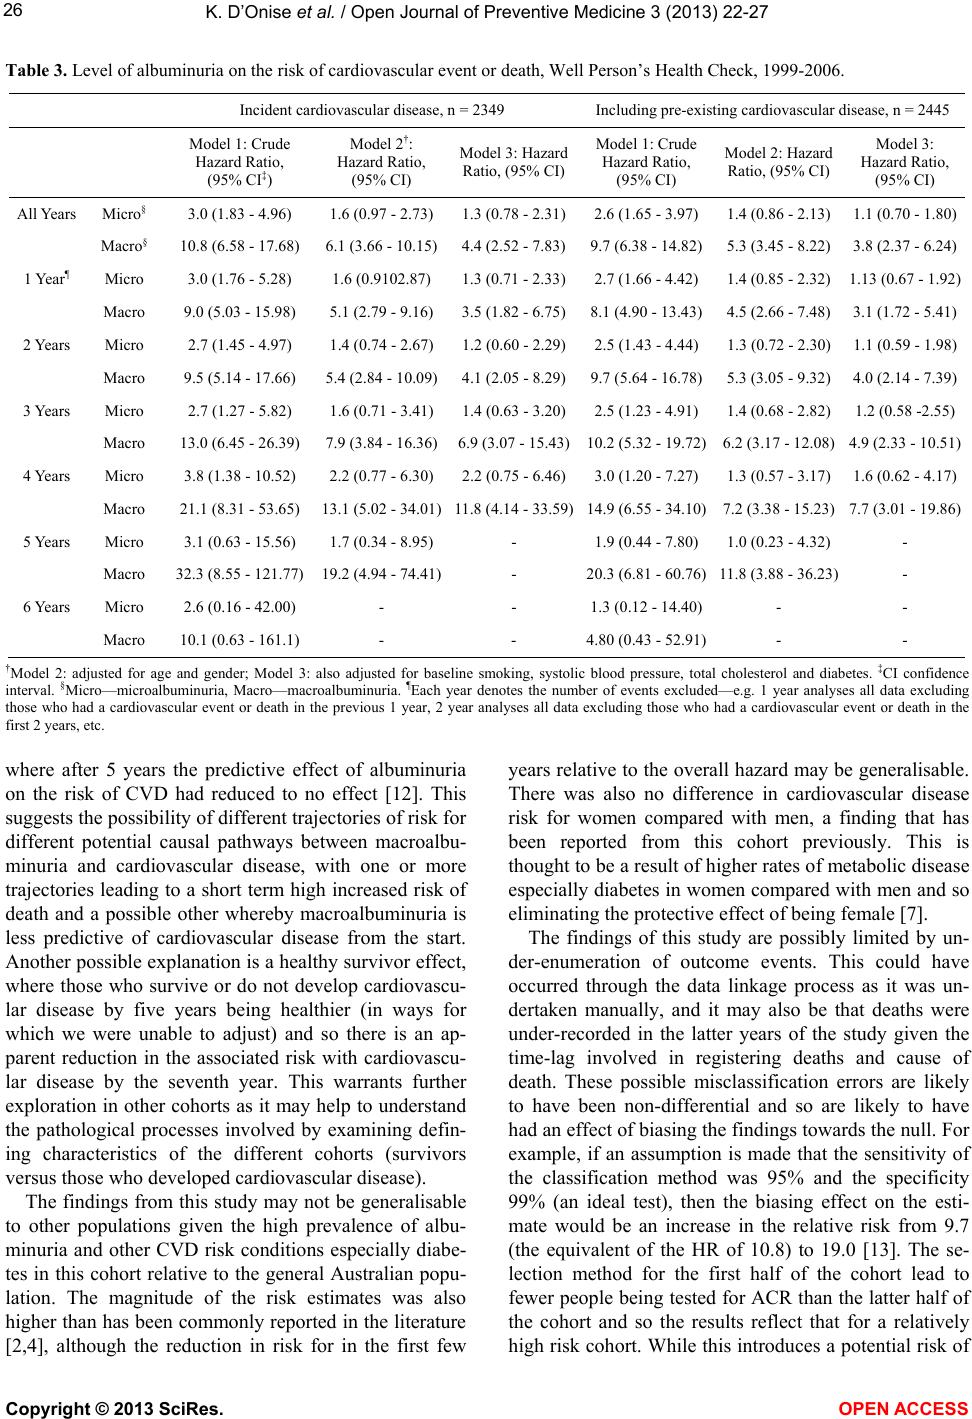 K. D’Onise et al. / Open Journal of Preventive Medicine 3 (2013) 22-27 26 Table 3. Level of albuminuria on the risk of cardiovascular event or death, Well Person’s Health Check, 1999-2006. Incident cardiovascular disease, n = 2349 Including pre-existing cardiovascular disease, n = 2445 Model 1: Crude Hazard Ratio, (95% CI‡) Model 2†: Hazard Ratio, (95% CI) Model 3: Hazard Ratio, (95% CI) Model 1: Crude Hazard Ratio, (95% CI) Model 2: Hazard Ratio, (95% CI) Model 3: Hazard Ratio, (95% CI) All Years Micro§ 3.0 (1.83 - 4.96) 1.6 (0.97 - 2.73)1.3 (0.78 - 2.31)2.6 (1.65 - 3.97)1.4 (0.86 - 2.13) 1.1 (0.70 - 1.80) Macro§ 10.8 (6.58 - 17.68) 6.1 (3.66 - 10.15)4.4 (2.52 - 7.83)9.7 (6.38 - 14.82)5.3 (3.45 - 8.22) 3.8 (2.37 - 6.24) 1 Year¶ Micro 3.0 (1.76 - 5.28) 1.6 (0.9102.87) 1.3 (0.71 - 2.33)2.7 (1.66 - 4.42)1.4 (0.85 - 2.32) 1.13 (0.67 - 1.92) Macro 9.0 (5.03 - 15.98) 5.1 (2.79 - 9.16)3.5 (1.82 - 6.75)8.1 (4.90 - 13.43)4.5 (2.66 - 7.48) 3.1 (1.72 - 5.41) 2 Years Micro 2.7 (1.45 - 4.97) 1.4 (0.74 - 2.67)1.2 (0.60 - 2.29)2.5 (1.43 - 4.44)1.3 (0.72 - 2.30) 1.1 (0.59 - 1.98) Macro 9.5 (5.14 - 17.66) 5.4 (2.84 - 10.09)4.1 (2.05 - 8.29)9.7 (5.64 - 16.78)5.3 (3.05 - 9.32) 4.0 (2.14 - 7.39) 3 Years Micro 2.7 (1.27 - 5.82) 1.6 (0.71 - 3.41)1.4 (0.63 - 3.20)2.5 (1.23 - 4.91)1.4 (0.68 - 2.82) 1.2 (0.58 -2.55) Macro 13.0 (6.45 - 26.39) 7.9 (3.84 - 16.36)6.9 (3.07 - 15.43)10.2 (5.32 - 19.72)6.2 (3.17 - 12.08) 4.9 (2.33 - 10.51) 4 Years Micro 3.8 (1.38 - 10.52) 2.2 (0.77 - 6.30)2.2 (0.75 - 6.46)3.0 (1.20 - 7.27)1.3 (0.57 - 3.17) 1.6 (0.62 - 4.17) Macro 21.1 (8.31 - 53.65) 13.1 (5.02 - 34.01)11.8 (4.14 - 33.59)14.9 (6.55 - 34.10)7.2 (3.38 - 15.23) 7.7 (3.01 - 19.86) 5 Years Micro 3.1 (0.63 - 15.56) 1.7 (0.34 - 8.95)- 1.9 (0.44 - 7.80)1.0 (0.23 - 4.32) - Macro 32.3 (8.55 - 121.77) 19.2 (4.94 - 74.41)- 20.3 (6.81 - 60.76)11.8 (3.88 - 36.23) - 6 Years Micro 2.6 (0.16 - 42.00) - - 1.3 (0.12 - 14.40)- - Macro 10.1 (0.63 - 161.1) - - 4.80 (0.43 - 52.91)- - †Model 2: adjusted for age and gender; Model 3: also adjusted for baseline smoking, systolic blood pressure, total cholesterol and diabetes. ‡CI confidence interval. §Micro—microalbuminuria, Macro—macroalbuminuria. ¶Each year denotes the number of events excluded—e.g. 1 year analyses all data excluding those who had a cardiovascular event or death in the previous 1 year, 2 year analyses all data excluding those who had a cardiovascular event or death in the first 2 years, etc. where after 5 years the predictive effect of albuminuria on the risk of CVD had reduced to no effect [12]. This suggests the possibility of different trajectories of risk for different potential causal pathways between macroalbu- minuria and cardiovascular disease, with one or more trajectories leading to a short term high increased risk of death and a possible other whereby macroalbuminuria is less predictive of cardiovascular disease from the start. Another possible explanation is a healthy survivor effect, where those who survive or do not develop cardiovascu- lar disease by five years being healthier (in ways for which we were unable to adjust) and so there is an ap- parent reduction in the associated risk with cardiovascu- lar disease by the seventh year. This warrants further exploration in other cohorts as it may help to understand the pathological processes involved by examining defin- ing characteristics of the different cohorts (survivors versus those who developed cardiovascular disease). The findings from this study may not be generalisable to other populations given the high prevalence of albu- minuria and other CVD risk conditions especially diabe- tes in this cohort relative to the general Australian popu- lation. The magnitude of the risk estimates was also higher than has been commonly reported in the literature [2,4], although the reduction in risk for in the first few years relative to the overall hazard may be generalisable. There was also no difference in cardiovascular disease risk for women compared with men, a finding that has been reported from this cohort previously. This is thought to be a result of higher rates of metabolic disease especially diabetes in women compared with men and so eliminating the protective effect of being female [7]. The findings of this study are possibly limited by un- der-enumeration of outcome events. This could have occurred through the data linkage process as it was un- dertaken manually, and it may also be that deaths were under-recorded in the latter years of the study given the time-lag involved in registering deaths and cause of death. These possible misclassification errors are likely to have been non-differential and so are likely to have had an effect of biasing the findings towards the null. For example, if an assumption is made that the sensitivity of the classification method was 95% and the specificity 99% (an ideal test), then the biasing effect on the esti- mate would be an increase in the relative risk from 9.7 (the equivalent of the HR of 10.8) to 19.0 [13]. The se- lection method for the first half of the cohort lead to fewer people being tested for ACR than the latter half of the cohort and so the results reflect that for a relatively high risk cohort. While this introduces a potential risk of Copyright © 2013 SciRes. OPEN ACCE SS 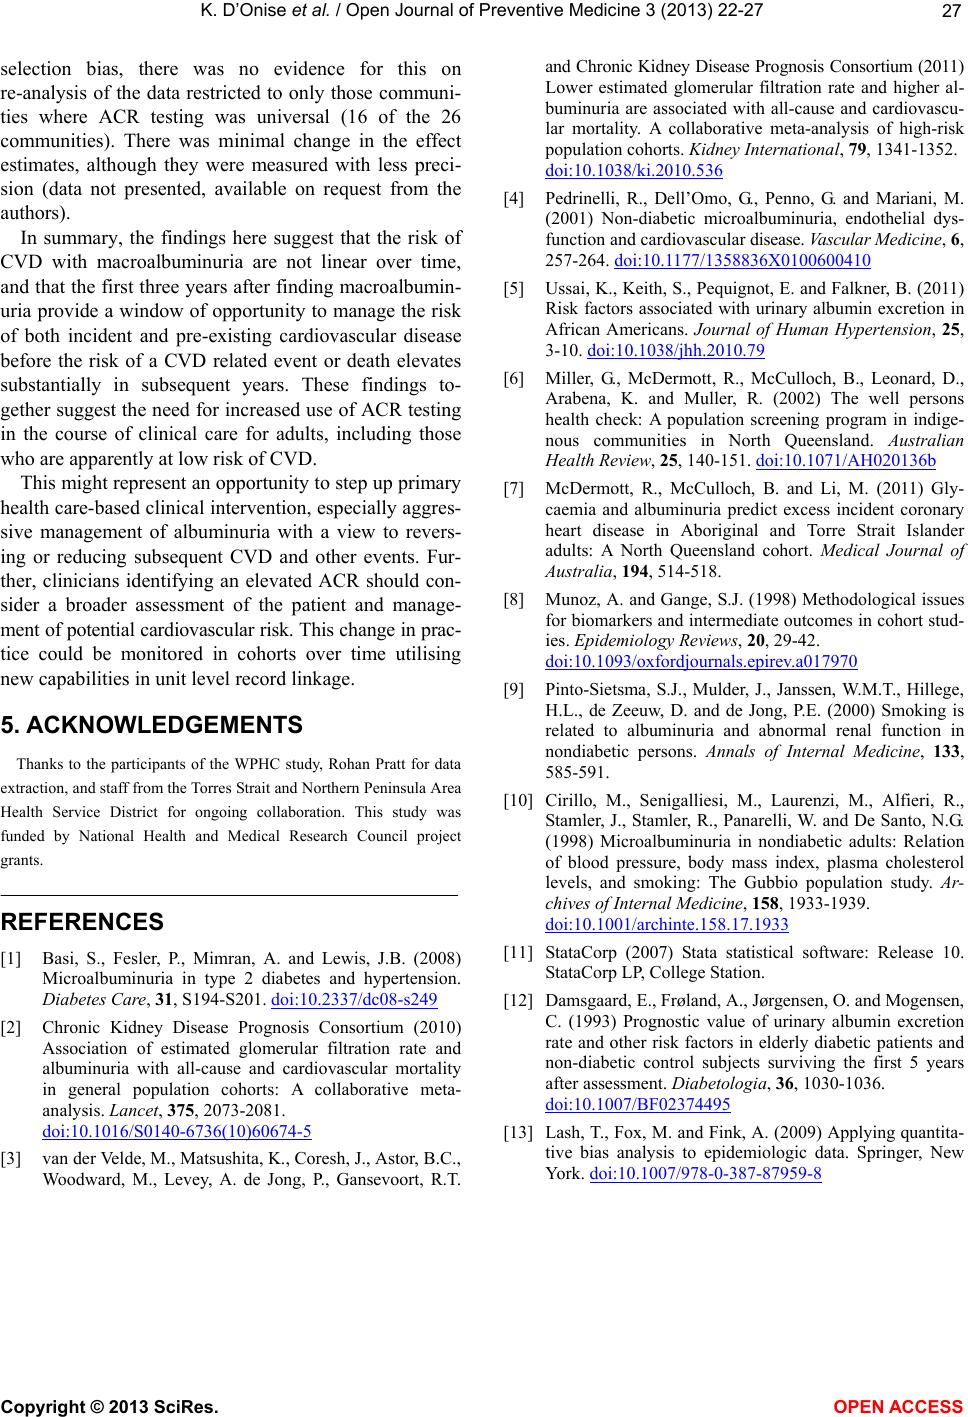 K. D’Onise et al. / Open Journal of Preventive Medicine 3 (2013) 22-27 27 selection bias, there was no evidence for this on re-analysis of the data restricted to only those communi- ties where ACR testing was universal (16 of the 26 communities). There was minimal change in the effect estimates, although they were measured with less preci- sion (data not presented, available on request from the authors). In summary, the findings here suggest that the risk of CVD with macroalbuminuria are not linear over time, and that the first three years after finding macroalbumin- uria provide a window of opportunity to manage the risk of both incident and pre-existing cardiovascular disease before the risk of a CVD related event or death elevates substantially in subsequent years. These findings to- gether suggest the need for increased use of ACR testing in the course of clinical care for adults, including those who are apparently at low risk of CVD. This might represent an opportunity to step up primary health care-based clinical intervention, especially aggres- sive management of albuminuria with a view to revers- ing or reducing subsequent CVD and other events. Fur- ther, clinicians identifying an elevated ACR should con- sider a broader assessment of the patient and manage- ment of potential cardiovascular risk. This change in prac- tice could be monitored in cohorts over time utilising new capabilities in unit level record linkage. 5. ACKNOWLEDGEMENTS Thanks to the participants of the WPHC study, Rohan Pratt for data extraction, and staff from the Torres Strait and Northern Peninsula Area Health Service District for ongoing collaboration. This study was funded by National Health and Medical Research Council project grants. REFERENCES [1] Basi, S., Fesler, P., Mimran, A. and Lewis, J.B. (2008) Microalbuminuria in type 2 diabetes and hypertension. Diabetes Care, 31 , S194-S201. doi:10.2337/dc08-s249 [2] Chronic Kidney Disease Prognosis Consortium (2010) Association of estimated glomerular filtration rate and albuminuria with all-cause and cardiovascular mortality in general population cohorts: A collaborative meta- analysis. Lancet, 375, 2073-2081. doi:10.1016/S0140-6736(10)60674-5 [3] van der Velde, M., Matsushita, K., Coresh, J., Astor, B.C., Woodward, M., Levey, A. de Jong, P., Gansevoort, R.T. and Chronic Kidney Disease Prognosis Consortium (2011) Lower estimated glomerular filtration rate and higher al- buminuria are associated with all-cause and cardiovascu- lar mortality. A collaborative meta-analysis of high-risk population cohorts. Kidney International, 79, 1341-1352. doi:10.1038/ki.2010.536 [4] Pedrinelli, R., Dell’Omo, G., Penno, G. and Mariani, M. (2001) Non-diabetic microalbuminuria, endothelial dys- function and cardiovascular disease. Vascular Medicine, 6, 257-264. doi:10.1177/1358836X0100600410 [5] Ussai, K., Keith, S., Pequignot, E. and Falkner, B. (2011) Risk factors associated with urinary albumin excretion in African Americans. Journal of Human Hypertension, 25, 3-10. doi:10.1038/jhh.2010.79 [6] Miller, G., McDermott, R., McCulloch, B., Leonard, D., Arabena, K. and Muller, R. (2002) The well persons health check: A population screening program in indige- nous communities in North Queensland. Australian Health Review, 25, 140-151. doi:10.1071/AH020136b [7] McDermott, R., McCulloch, B. and Li, M. (2011) Gly- caemia and albuminuria predict excess incident coronary heart disease in Aboriginal and Torre Strait Islander adults: A North Queensland cohort. Medical Journal of Australia, 194, 514-518. [8] Munoz, A. and Gange, S.J. (1998) Methodological issues for biomarkers and intermediate outcomes in cohort stud- ies. Epidemiology Reviews, 20, 29-42. doi:10.1093/oxfordjournals.epirev.a017970 [9] Pinto-Sietsma, S.J., Mulder, J., Janssen, W.M.T., Hillege, H.L., de Zeeuw, D. and de Jong, P.E. (2000) Smoking is related to albuminuria and abnormal renal function in nondiabetic persons. Annals of Internal Medicine, 133, 585-591. [10] Cirillo, M., Senigalliesi, M., Laurenzi, M., Alfieri, R., Stamler, J., Stamler, R., Panarelli, W. and De Santo, N.G. (1998) Microalbuminuria in nondiabetic adults: Relation of blood pressure, body mass index, plasma cholesterol levels, and smoking: The Gubbio population study. Ar- chives of Internal Medicine, 158, 1933-1939. doi:10.1001/archinte.158.17.1933 [11] StataCorp (2007) Stata statistical software: Release 10. StataCorp LP, College Station. [12] Damsgaard, E., Frøland, A., Jørgensen, O. and Mogensen, C. (1993) Prognostic value of urinary albumin excretion rate and other risk factors in elderly diabetic patients and non-diabetic control subjects surviving the first 5 years after assessment. Diabetologia, 36, 1030-1036. doi:10.1007/BF02374495 [13] Lash, T., Fox, M. and Fink, A. (2009) Applying quantita- tive bias analysis to epidemiologic data. Springer, New York. doi:10.1007/978-0-387-87959-8 Copyright © 2013 SciRes. OPEN ACCE SS |