

Paper Menu >>
Journal Menu >>
 Journal of Biosciences and Medicines, 2013, 1, 6-10 JBM doi:10.4236/jbm.2013.11002 Published Online February 2013 (http://www.SciRP.org/journal/jbm/) Published Online February 2013 in SciRes. http://www.scirp.org/journal/jbm Exploration th e Met h od of Low Dose Coronar y Art ery Imaging with Dual-Source CT Zhiwei Huang, Bo Xiao, Lisha Zhong Department of Bio medi cal Engineering, Lu zhou Medical Co llege, Luzhou, P.R.China Email: [email protected] Received 2013 ABSTRACT Objective: On the pre mise that the image q uality meets the requirements of clinical diagnosis, we explored the methods to reduce the radiatio n dose of coronary artery imaging with Dual-Source CT (DSC T) . Metho d s: We randomly selected 200 patients with coronary heat disease (BIM<25kg/m2), applied the scanning technology of regulating the dose of heart electric pulse (AUTO) on t he 100 patients in group A . In this group for different heart rate we chose different full dose exposure time window. For the 100 patients in group B, we used conventional full dose (OFF) scan mode. The DSC T a uto mat ic ally selec ted t he be st t i me and phase to reconstruct the image. We used the 5 point system to evaluate the image quality, measured and compared the image noise and radiation dose. When P<0.05, t he differences between the two groups have statistical significance. Results: The image quality scores between the two groups showed no significant difference (P > 0.05). The average image noise in gro up A is (41.76 ± 7.98) HU, in group B the average image noise is (43.97 ± 3.88) HU, the dif- ference between the two groups was not statistically significant (P>0.05). The average CTDIvol of group A and B were (20.63 ± 2.24) mGy, (38.11 ± 10.69) mGy, respectively, then P <0.01. The average DLP of group A and B are (235.75 ± 28.64) mGycm and (492.59 ± 125.49) mGycm respectively, then P <0.01, the dif- ference of radiation dose had statistical significance (P<0.05). Conclusions: For coronary artery imaging with DSCT the heart electric pul se (AUTO) regulation technology can meet the diagnostic requirements and effectively reduce the radiation dose. Keywords: Dual-Sou rce CT(DS C T); Corona ry CT Angiog raphy; L ow dose ; N oi s e; 1. INTRODUCTION The study sho ws that t he DSCT c oronar y arter y imagin g has a hi gh d egre e of consistency in the diag nostic results of coronary stenosis and selective coronary arteriongra- phy (SCA) [1]. DSCT evaluation on moderate to severe coronary artery stenosis has higher compliance and con- sistency with the SC A, DSCT can be used as a noninva- sive conventional means in clinical screening and diag- nosis [2]. DSCT has two sets of X-ray tubes and relative detectors, two sets of DAS systems are installed in 90 degree angle on the rack. Compared with multi-slice spiral CT ( MSCT), DSCT reaches higher time resol ution, its detector covers more areas, its scanning speed be- comes fa ster, so the scan time is gre atly shor ten, and the radiation doses is significantly reduced by about 15% to 20% [3]. It also has other advantages, such as the pitch can be automatically adjusted with the heart rate without the limit of the heart rate, and the negative prognosis is high [4]. With the appearance of DSCT, the radiation dose is reduced, but the radiation dose is still widely con- cerned. The heart disease committee declared that if 2000 patients receive CT examination with the radiation dose of 10mSv, one of them will suffer from malignant tumors. For the overall risk of cancer caused by radiation, male is less than the women, and the gap between men of different ages, and there is little gap between men of different ages; but the overall cancer risk of women de- creases with increasing age [5]. In this paper for coronary artery imaging with DSCT, we compared heart electric pulse (AUTO) wit h conventional full-dose (OFF) sc an mode, compared the image quality, image noise, and radiation dose of the two sets. Ensurin g the quality of the image to meet the diagnostic requirements, we tried to find methods to minimize the radiatio n d ose. 2. MATERIALS AND METHODS 2.1. Case Selection From May 10, 2012 to May 25, 2012, we randomly se- lected 200 patients from West China Ho spital of Sichuan University, these patients were clinical suspected or di- agnosed with coronary heart disease (BIM<25kg/m2). 100 cases are in group A (63 cases are male, female 37  Z. W. Huang et al. / Journal of Biosciences and Medicines 1 (2013) 6-10 Copyright © 2013 SciRes. JBM 7 cases are female, their ages were 34 - 82 years old, the average age was 58 years old ), and in their scanning mode, we used AUTO scanning mode . Another 100 cas- es ar e i n gro up B (5 7 cases are male, 43 cases are female, their ages were 33 - 80 years old, their average age is 56.5 years old), we applied OFF scanning mode on them. Two groups of patients are not restricted by heart rate, age and gender, except serious arrhythmia or frequent premature beats patients. In b oth groups we used retros- pective cardiac-gated imaging technique. 2.2. Scanning Preparation We tried to understand whether patients are allergic to iodine, and their renal functions are normal. We also tried to eliminate the tension and depression of the pa- tients. We conducted strict breath training on patients, and e njoined patie n ts to keep respiratory amplitude con- sistent for ever y time. The patients are in the supine po- sition, the feet of the patients entered the CT gantry first. ECG electrodes were correctly placed, and the leads with higher R wave were selected. For the patients without hypotension, we sprayed Nitroglycerin Aerosol 2-3 times under their tongues. 2.3. Scanning Method 2.3.1. Scanning O peratio n We used the Siemens Somatom Definition as DSCT scanner. For the patients in group A and B, we applied the same time resolution, space resolution, rotation time(0.33s), collimator width (64*0.6mm), image recon- struction thickness (0.75mm), reconstruction interval (0.5mm). At the same time, the scanning range (from 1 to 2cm under the bifurcation of trachea to diaphragmatic surface of heart), contrasted medium injection scheme, and image processing methods were kept consistent. We chose Iopamidol (370 mgI/ml) contrast agent and Ger- many binocular high-pressure syringe (Ulrich Medical), Syringe needle was placed on the forearm vein. Firstly physiological saline was injected, then contrast agent Iopamidol was injected, at last physiological saline was injected. 2.3.2. Iodine Concentration Monitoring We used contrast agent tracer method. In the center of ascending aorta (it is under the tracheal bifurcation and away from the bi f urc atio n 2-3cm), we chose the region of interest and detected the CT value, and the threshold value was set to 100HU. When the CT values in the re- gion o f i ntere st reac h 100 H U, the CT will automatically trigge r sca n with a delay of 6s. Pay attention to avoiding the impact of the superior vena cava. 2.3.3. ECG We scanned the patients after their heart rate was steady and used AUTO scanning mode: the exposure range of the full dose scan mode was a certain time window in the R-R interval, and the rest exposure dose was 1/4 of the ful l d ose. The ti me wi ndow o f the ful l do se exp os ure was in the R-R interval, and this time window corres- ponded to different heart rate range. For relativel y fast or slow heart rate, the ful l-dose exposure range in R-R in- terval was the smallest. For normal heart rate, full-dose expo sure ran ge was the maximum. O FF scanning mode: the full dose-exp osure ra nge is the entire R-R interva l . 2.3.4 Ima ge Pos t-processing We adopted Siemens Syngo Miltimodalit y Workp lace as the workstation software for automatically selecting the best time and phase. By calculating the movement speed of each vessel coronary, the best time and phase were selected for reconstruction of 0.75mm thickness, so we got the best corona ry a rtery i mages at systole and dia stole. We used the software Circulation to perform the image post-processing, main technologies includes: Maximum Intensity Projection, Curved Surface Reconstruction), Volume Reproduction in order to multi-facedly show the left main of coronar y artery and its main branches Right Coronary Artery, Anterior Descending and Circumflex Artery. 2.4. Image Quality Assessment and Radiation dose Calculation 2.4.1. Image Quality Assessment Two experienced diagnostic physicians rated images by using the double-blind method. For the inconsistent judgments, they jointly and secondly read the film to reach agreement. We used 5-p oi nt sc al e in t he gr ad i ng of the image quality. The standard of 5 points is that the image can be display clearly without artifacts, the blood flow filling in all the vascular is good. The stand ard o f 4 points is that there is minor artifacts, only a certain sec- tion o f the mai n cor onar y arte ry is sligh tl y fuzz y without split-level or ladder-like artifacts, the diagnosis is not affected. The standard of 3 points is that in the film the artifacts are medium, more than 1/2 of one coronary ar- tery trunk is fuzzy, but we can diagnose the illness. The axial image is rather vague, but the reconstructed image can be used for diagnosis. The standard of 2 points is that in the film the artifacts are severe, all the parts of one coronary artery are fuzzy or discontinuous, parts of the blood vessels ha ve split-level artifacts, and the diag- nosis is limited. The standard of 1 point is that the coro- nary artery can not be recognized, the tube p ulse can no t be analyzed, and we can not diagnose the illness. If the score of the image quality can reach 4-5 points, the im- age can be considered to be a high-quality image; if the score is 3 points, the image is evaluated image; if the 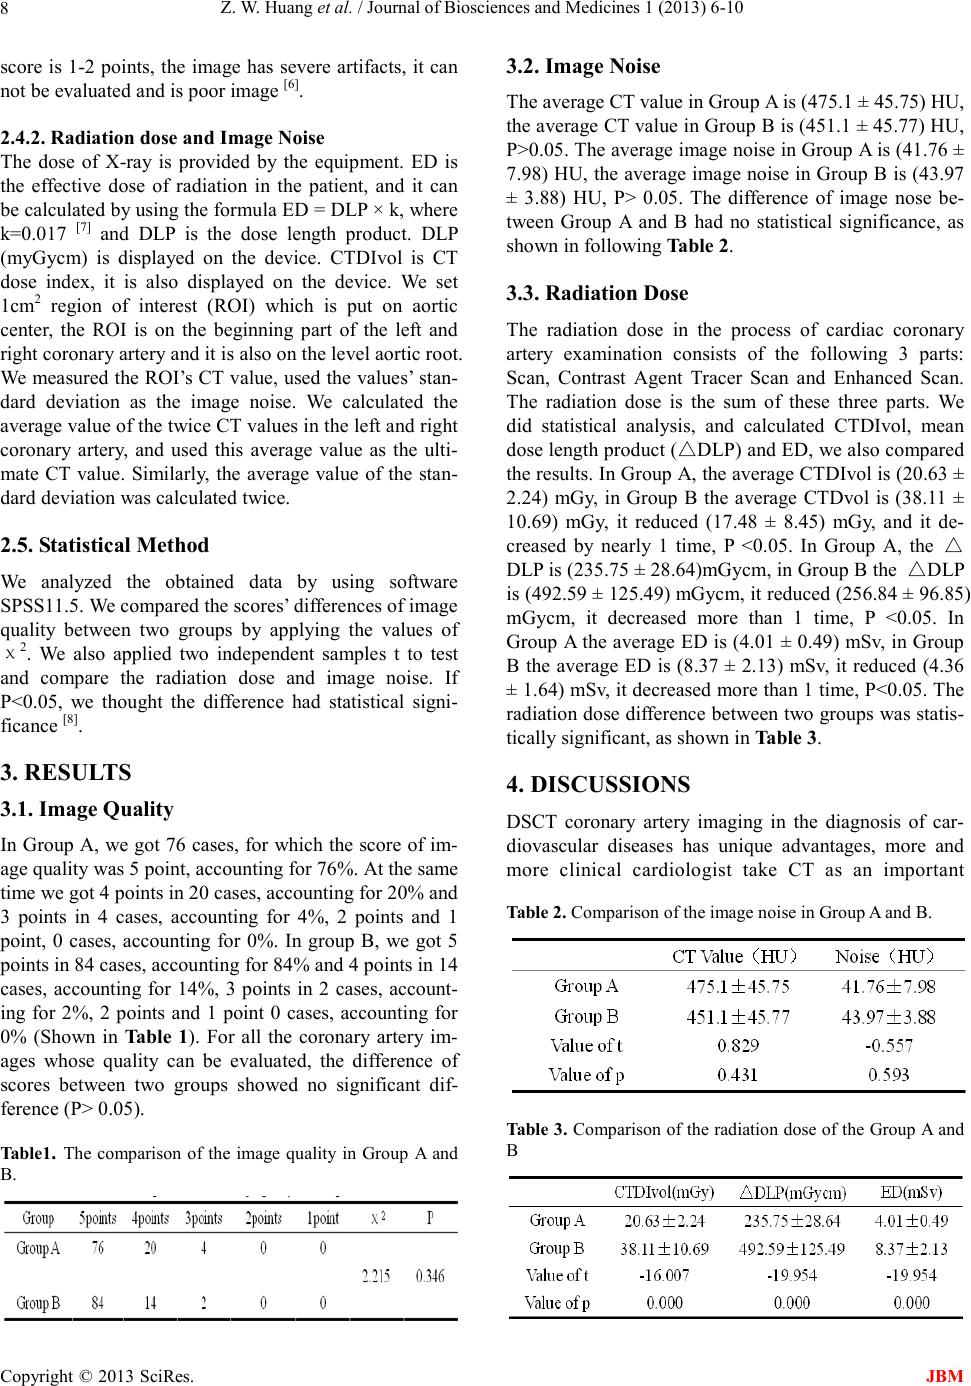 Z. W. Huang et al. / Journal of Biosciences and Medicines 1 (2013) 6-10 Copyright © 2013 SciRes. JBM 8 score is 1-2 points, the image has severe artifacts, it can not be evaluated and is poor image [6]. 2.4.2. Radiatio n dose and Image Noise The dose of X-ray is provided by the equipment. ED is the effective dose of ra d ia tion in the patient, and it can be calculated by using the formula ED = DLP × k, where k=0.017 [7] and DLP is the dose length product. DLP (myGycm) is displayed on the device. CTDIvol is CT dose index, it is also displayed on the device. We set 1cm2 region of interest (ROI) which is put on aortic center, the ROI is on the beginning part of the left and right coronary arter y and it is also on the level aortic roo t. We measured the ROI’s CT value, used the value s’ stan- dard deviation as the image noise. We calculated the average value of the twice CT values in the left a nd rig ht coronary artery, and used this average value as the ulti- mate CT value. Similarly, the average value of the stan- dard deviation was calculated twice. 2.5. Statistical Method We analyzed the obtained data by using software SPSS11.5. We compared the scores’ differences of image quality between two groups by applying the values of χ2. We also applied two independent samples t to test and compare the radiation dose and image noise. If P<0.05, we thought the difference had statistical signi- ficance [8]. 3. RESULTS 3.1. Image Quality In Group A, we got 76 cases, for which the score of im- age quality was 5 point, accounting for 76%. At the same time we got 4 points in 20 cases, accounting for 20% and 3 points in 4 cases, accounting for 4%, 2 points and 1 point, 0 cases, accounting for 0%. In group B, we got 5 points in 84 cases, accounting for 84% and 4 points in 14 cases, accounting for 14%, 3 points in 2 cases, account- ing for 2%, 2 points and 1 point 0 cases, accounting for 0% (Shown in Tabl e 1). For all the coronary artery im- ages whose quality can be evaluated, the difference of scores between two groups showed no significant dif- ference (P> 0.05). Table1. The comparison of the image quality in Group A and B. 3.2. Image Noise The average CT value in Group A is (475.1 ± 45.75) HU, the a vera ge CT va lue i n Group B is (451.1 ± 45.77) HU, P>0.05. The average image noise in Group A is (41.76 ± 7.9 8) HU, the average i mage noi se in Gro up B is ( 43.97 ± 3.88) HU, P> 0.05. The difference of image nose be- tween Group A and B had no statistical significance, as sho wn in fol lo wi ng Table 2. 3.3. Radiation Dose The radiation dose in the process of cardiac coronary artery examination consists of the following 3 parts: Scan, Contrast Agent Tracer Scan and Enhanced Scan. The radiation dose is the sum of these three parts. We did statistical analysis, and calculated CTDIvol, mean dose length product (△DLP) and ED, we also compared the results. In Group A, the average CTDIvol is (20.63 ± 2.24) mGy, in Group B the average CTDvol is (38.11 ± 10.69) mGy, it reduced (17.48 ± 8.45) mGy, and it de- creased by nearly 1 time, P <0.05. In Group A, the △ DLP is (235.75 ± 28.64)mGycm, in Group B the △DLP is (492.59 ± 125.49) mGycm, it reduced (256.84 ± 96.85) mGycm, it decreased more than 1 time, P <0.05. In Group A the average ED is (4.01 ± 0.49) mSv, in Group B the average ED is (8.37 ± 2.13) mSv, it reduced (4.36 ± 1.64) mSv, it decreased more t h a n 1 t i me , P<0.05. The radiation dose difference between two groups was statis- tically significant, as shown in Table 3. 4. DISCUSSIONS DSCT coronary artery imaging in the diagnosis of car- diovascular diseases has unique advantages, more and more clinical cardiologist take CT as an important Table 2. Comparison of the image noise in Group A and B. Table 3. Comparison of the radiation dose of the Group A and B  Z. W. Huang et al. / Journal of Biosciences and Medicines 1 (2013) 6-10 Copyright © 2013 SciRes. JBM 9 examination tool for non-invasive coronary artery imag- ing, it can be used as a supplement Cardiovascular Angi- ography, sometimes it can even replace Cardiovascular Angiography. In the process of the entire examination of DSCT, X-ray dose is large, the radiation hazards it pro- duces gets more and more attention. In order to follow the principle of ALARA (as low as reasonable achieva- ble), many scholars have done a lot of research in this respect, including hardware, software and optimizing programs of scan, such as Heart Bowtie, ECG Current Control, Cardiac noise subtraction filter, etc [9]. But the factors which affect the image quality are complex, some of these factors are closely related and influence each other. Some parameter settings may improve the image quality, but on the other hand, they may reduce the im- age quality in another aspect. So we must comprehen- sivel y co ns i de r, and separately set the parameters of scan according to the different clinical needs. But it is diffi- cult for us to balance the various factors to obtain high-quality images in order to improve the diagnostic rate. Cur ren tl y, the re i s no sta nda rd for q ualit y co ntr ol i n cor onar y arter y ima gi ng o f Dua l-So urce CT in o ur co un- try. So far, people have paid more and more attention to the potential hazards of ionizing radiation in CT. When ionizing radiation is wo rk ing on human body, it can produce biological impacts and do harm to human body. The break of the structure of DNA double helix in hu- man body is the critical damage to the cells. Radiation induces gene mutations or the break of the double helix structure, the distortion increases, and eventually, the radiation can lead to cancer [10]. The reports pointed out that for every more radiation dose of 10mSv, the mortal- ity rate will increase by 0.04% [11]. The actual radiation dose of CT examination is 2-5 times the dose of effec- tive radiation [12]. The dose of effective radiation mainly comes from the enhanced period. In the aspect of opti- mizing scanning program, people mostly focus on con- trolling the radiation dose of enhanced period. In most cases, the image quality and the radiation dose have the inverse relationship. To balance the relationship between them, we need to change the fixed scan mode. In prac- tical application, we should pay attention to the individ- ual conditions of the different patients, such as the size of the heart, breast size of the female patient s and cardi- othoracic ratio, etc. According to these conditions, we determine the appropriate scan mode and scan parame- ters. So we can achieve the personalized and reasonable scanning. A recent survey, which is an international re- search for radiation dose in coronary artery CTA, dis- plays that the radiation dose in different hospitals have obvi ous gap , fro m an a vera ge of 5 mSv to an a verage of 30 mSv. This demonstrates that reasonable scan mode can effectively reduce the radiation dose [13]. Therefore, on the premise that the ima ge quality meets the require- ments of clinical diagnosis, it becomes important for us to effectively reduce the radiation dose in the CTA ex- amination of coronary artery, and this can reduce the radiation damage caused by human factors. Reducing the radiation dose is generally divided into two categorie s: new low-dose technology and optimizing scan parameters. The new scanning technology uses the ECG current modulation technique, Prospective ECG Trigger Scan Technology and noise red uction al gorithms. The methods of optimizing scan parameters are lowering tube current, lowering tube voltage, reducing the scan rage of Z-axis and reducing the number of scans based on body mass or body mass index (BMI). In this article, in order to reduce the radiation dose, we used the tech- nology of regulating the dose of heart electric pulse (AUTO), and this technology belongs to retrospective cardiac-gated i magin g techniq ue. T hrough t he stud y and analysis, we concluded that the regulation technology of dose of heart electric pulse (AUTO) can make the image quality completely meets the requirements of clinical diagnosis, and compared with the conventional full dose (OFF), thi s techno logy can significa ntly reduce the radi- ation dose of (4.36 ± 1.64) mSv, the radiation dose de- creased more than 1 time. Of course, it also has inade- quacies: 1. Data acqui sition is not ca rried o ut throughout the whole cardiac cycle, and we can not analyze the car- diac function. 2. If the patient’s heart rate in unstable, it is easy for us to select the wrong full-dose regions. 3. In the non-full-dose exposure regions of the R-R interval, the image quality is a little bit worse than that of the image in full-dose regions. 4. If there are heart prema- ture beats in the scan, we can not edit the ECG. The study has t he follo wing limitatio ns. T he ind ividu- alized scan mode according the patient’s BMI was not adopted, the radiation dose still has some space to be reduced, a nd i n thi s a sp ec t t he study s ho uld b e c o nti nue d. If the post-processing of image only uses one of the two periods in image reconstruction, we can only reconstruct the image of one period, therefore the radiation dose will be reduced by 1 time, and in this aspect can be studied much fur t her. REFERENCES [1] Lei ZHUANG, Jihong GAN, Jianjun LIU. Diagnosis of coronary artery disease by dual source CT coronary angiography. Medical Journal of National Defending Forces in Northwest China, 2010, 31 (4): 273-275. [2] Yuan Zhao, Hong Pu. Comparatively Studying the Application of Dual Source CT in Coronary  Z. W. Huang et al. / Journal of Biosciences and Medicines 1 (2013) 6-10 Copyright © 2013 SciRes. JBM 10 Angiography. Journal of Sichuan Continuing Education College of Medical Sciences. 2009, 28 (2): 87-89. [3] Yan Gao. Exploration of the low dose technique in the examination of the coronary arteries angio gra phy wit h dua l-sour ce CT. Sichuan Medical Journal, 2009, 30(12):1967-1969. [4] Chiwei Wang. T he c urr e nt stu d y of Dual-source CT coronary artery imaging. Anhui Medical Journal, 2010, 31(10): 1256-1258 [5] Renwei Liu. Research Progress of Dual-source Computed Tomography (DSCT) Low-dose Coronary Angiography. Medi cal Recapitulate, 2009, 15(21):3317-3320. [6] Jiong Li. The application of optimizing scan parameters of Dual-Source CT in coronary artery imaging for reducing radiation dose. Nei Mongol Journal of Traditional Chinese Medicine, 2012, 10:82-83. [7] Lifeng Zhang, Maoyi Zhou, Li Yang. Influence of coronal arterial image quality of 64 detector row CT in patients with ECG-gated scanned and optimal R-R phase imaging reconstructed. Chinese Journal of Medical Imaging Technology, 2008, 24(1):88-91. [8] Wanshi Zhang, Jiaxing Xu. See Development of Low-dose CT from RSNA 2008. China Medical Device Information, 2009, 7(1):12-13 [9] Aijun Wang, Jianguo Zhao, Xuejun Ping. The comparison of two different methods of coronary artery imaging in Dual-Source CT. Journal of Ningxia Med ic a l College, 2010, 32(3): 443-445. [10] Zixu Yan, Zhaoqi Zhang. Low tube voltage in reduction of radiation dose in dual-source CT coronary angiography. Chinese Journal of Medical Imaging T echnology, 2009, 25(9): 1614-1616. [11] Weiwei Qi, Xiangke Du, Ying Guo. A method to optimize the selectio n of tube current for consistent image noise and dose control in 64-slice spiral helical CT cardiac imaging. Image Technology, 2008, 452(10):1026-1030. [12] Xiaoyang Chen, Jiankun Zhai, Hui Li. Clinical application and radiation prevention of CT scanning technology. China Modern Medicine, 2010, 17(8):61-62. [13] Gou Wenjing, S hiyuan Li u, Hong Yu. Strategy and research progress in coronary computed tomography angiography with low-dose scan. International Journal of Medical Radiology, 2012, 35(2): 147-150. [14] Hausleiter J,Meyer T,Hermann F. Estimated radiation dose associated with cardiac CT angio- graphy. JAMA,2009, 301:500-700. [15] Yan Qi, Shuang Qi. The application study of Dual-Source CT in cardiac imaging. Chinese Heart Journal, 2010, 22(2):302-304. |