

Paper Menu >>
Journal Menu >>
 Journal of Materials Science and Chemical Engineering, 2013, 1, 1-5 http://dx.doi.org/10.4236/msce.2013.11001 Published Online February 2013 (http://www.scirp.org/journal/msce) Copyright © 2013 SciRes. MSCE Adsorption Capacity of Expansion Graphite for Xylenol Orange* Xiuyan Pang1*, Chunyan Yang1,2, Shuxia Ren1 1College of Chemistry and Environmental Science, Hebei University, Baoding, China 2Baoding Tianwei Wind Power Blade Co. Ltd, Baoding, China Email: *[email protected] Received 2013 Abstract Expansion graphite (EG) processing of an expanded volume of 400 mL/g was prepared with 50 mesh crude graphite after chemical oxidation intercalation of potassium permanganate and vitriol, and its adsorption kinetics and thermody- namics characteristics for xylenol orange (XO) was investigated. In thermodynamic study, adsorption isotherm and free energy change (⊿G°) were detected and calculated, respectively. Influence of ionic strength on adsorbance was inves- tigated. Kinetic studies were carried out with a series of XO concentration under different temperatures, and the data were simulated with pseudo first-order and second-order kinetic model, respectively. Results illustrate: adsorption of EG for XO is a spontaneous process, and adsorption isotherm is type II; equilibrium adsorbance increases with the in- crease of ionic strength. Kinetic studies show that the kinetic data can be delineated by pseudo second-order kinetic model. Initial adsorption rate increases with the increase of temperature. Adsorption activation energy is less than 20 kJ/mol; physical adsorption is the major mode of the overall adsorption process. Keywords: Expansion Graphite; Xylenol Orange; Adsorption Kinetics; Adsorption Thermodynamics; Physical Adsorption 1. Introduction Expansion graphite (EG) is a kind of porous material prepared through chemical oxidation or electric chemical oxidation [1,2]. EG had attracted attention of scientists and engineers as an adsorbent of organic substance, such as heavy oil [3-7]. As for the adsorption study for dyes, Wang pressed the worm-like particles into a low-density plate of 0.1g/cm3 [8], then the plate was used to treat dye waste-water from woolen mill, and the optimum apply- ing condition was tested. Wang investigated the influ- ence factors in adsorption process [9], and concluded that the adsorption capacity was affected by EG expansion volume and dosage, primary concentration of dyes, con- tact time, pH and temperature. But they neglected the influence of pH both on absorbency and adsorption ca- pacity, and improper pH was used. At the same time, high EG dosage along with dyes low initial concentration caused adsorption isotherms of the tested dyes were all type I. Pang investigated the adsorption kinetic charac- teristics of Acid Red 3B on EG [10], and the kinetic data could be delineated by pseudo second-order kinetic model. Xylenol orange (XO) is one kind of dye with triphe- nylmethane structure, it is widely used as chemical indi- cator and dye, and then causes plenty of wastewater. In its decoloration with coal powder [11] as adsorbent, the influence of adsorbent dosage, XO primary concentration, contact time and pH was investigated. Under the condi- tion of pH 4, dosage of coal powder 8.0 g/L and XO ini- tial concentration of 7.6 mg/L, A decoloration rate of 85% was gained after a 2.0 h decoloration treatment. With chitosan microsphere as adsorbent [12], the opti- mum decoloration condition of XO was gained as: pH 5, 2.0 h, dosage of chitosan microsphere with a diameter of 74 μm 0.3 g/L and XO initial concentration of 32 mg/L. As an adsorbent, EG adsorption capacity for XO has not been reported. The aim of the study is to investigate the adsorption characteristics of EG-XO system in water solution, and discuss the effect of ionic strength, concen- tration, temperature, and do further evaluation of appli- cability of common isotherm model (i.e., Langmuir and Freundlich) and pseudo-second-order rate model. 2. Experimental 2.1. Adsorbent EG was prepared according to [13]. Its pore distribution was detected with Micromeritics Instrument Corporation 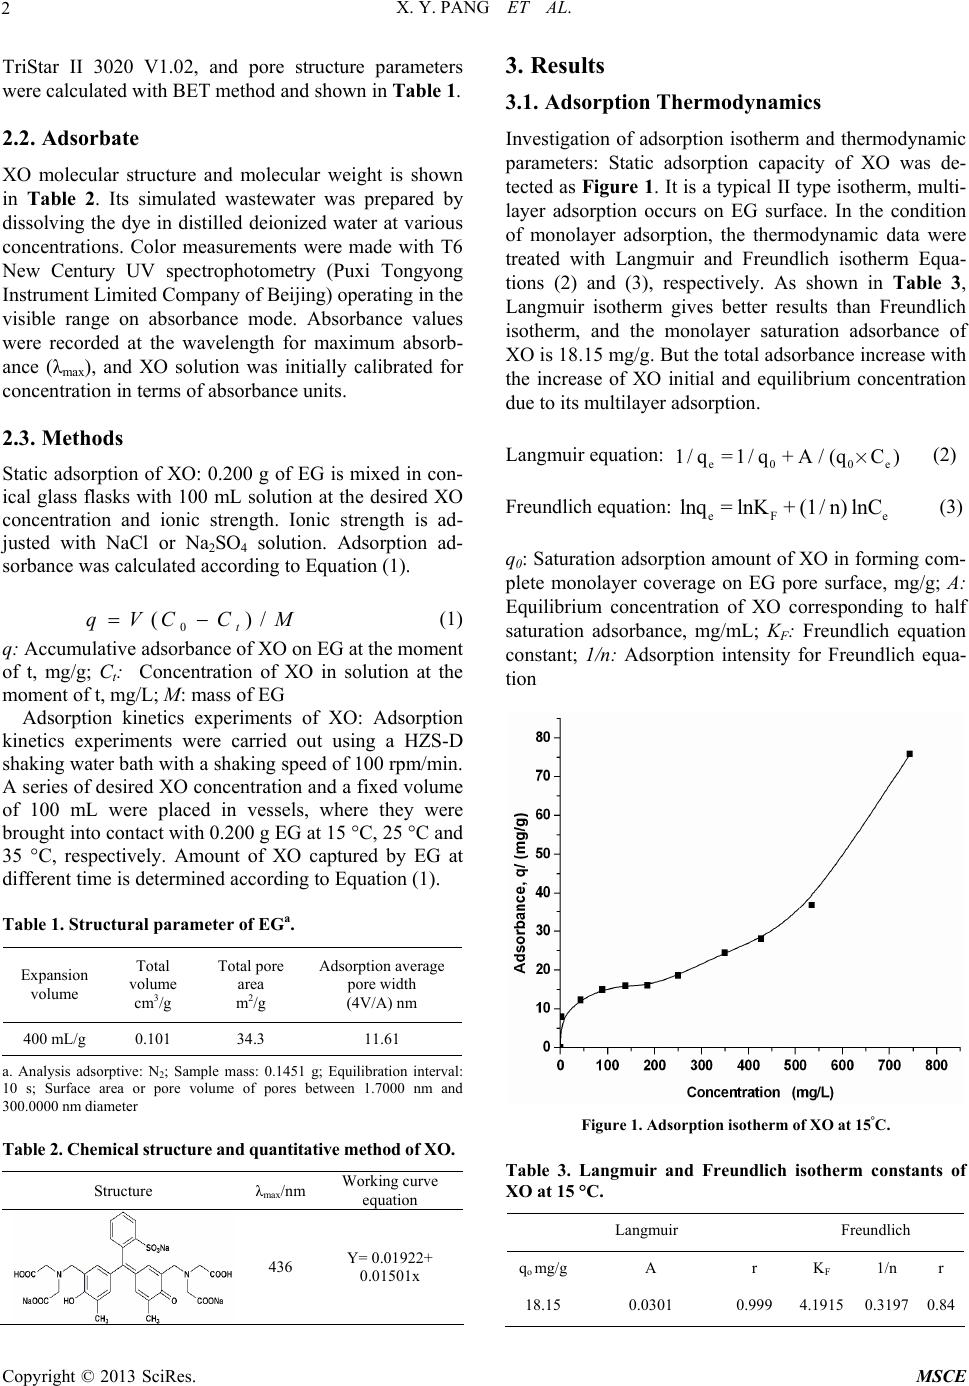 X. Y. PANG ET AL. 2 TriStar II 3020 V1.02, and pore structure parameters were calculated with BET method and shown in Table 1. 2.2. Adsorbate XO molecular structure and molecular weight is shown in Table 2. Its simulated wastewater was prepared by dissolving the dye in distilled deionized water at various concentrations. Color measurements were made with T6 New Century UV spectrophotometry (Puxi Tongyong Instrument Limited Company of Beijing) operating in the visible range on absorbance mode. Absorbance values were recorded at the wavelength for maximum absorb- ance (λmax), and XO solution was initially calibrated for concentration in terms of absorbance units. 2.3. Methods Static adsorption of XO: 0.200 g of EG is mixed in con- ical glass flasks with 100 mL solution at the desired XO concentration and ionic strength. Ionic strength is ad- justed with NaCl or Na2SO4 solution. Adsorption ad- sorbance was calculated according to Equation (1). 0 ()/ t qVC CM (1) q: Accumulative adsorbance of XO on EG at the moment of t, mg/g; Ct: Concentration of XO in solution at the moment of t, mg/L; M: mass of EG Adsorption kinetics experiments of XO: Adsorption kinetics experiments were carried out using a HZS-D shaking water bath with a shaking speed of 100 rpm/min. A series of desired XO concentration and a fixed volume of 100 mL were placed in vessels, where they were brought into contact with 0.200 g EG at 15 °C, 25 °C and 35 °C, respectively. Amount of XO captured by EG at different time is determined according to Equation (1). Table 1. Structural parameter of EGa. Expansion volume Total volume cm3/g Total pore area m2/g Adsorption average pore width (4V/A) nm 400 mL/g 0.101 34.3 11.61 a. Analysis adsorptive: N2; Sample mass: 0.1451 g; Equilibration interval: 10 s; Surface area or pore volume of pores between 1.7000 nm and 300.0000 nm diameter Table 2. Chemical structure and quantitative method of XO. Structure λmax/nm Working curve equation 436 Y= 0.01922+ 0.01501x 3. Results 3.1. Adsorption Thermodynamics Investigation of adsorption isotherm and thermodynamic parameters: Static adsorption capacity of XO was de- tected as Figure 1. It is a typical II type isotherm, multi- layer adsorption occurs on EG surface. In the condition of monolayer adsorption, the thermodynamic data were treated with Langmuir and Freundlich isotherm Equa- tions (2) and (3), respectively. As shown in Table 3, Langmuir isotherm gives better results than Freundlich isotherm, and the monolayer saturation adsorbance of XO is 18.15 mg/g. But the total adsorbance increase with the increase of XO initial and equilibrium concentration due to its multilayer adsorption. Langmuir equation: (2) e0 0e e 1/q= 1/q + A / (qC)´ Freundlich equation: (3) eF lnq= lnK + (1/ n) lnC q0: Saturation adsorption amount of XO in forming com- plete monolayer coverage on EG pore surface, mg/g; A: Equilibrium concentration of XO corresponding to half saturation adsorbance, mg/mL; KF: Freundlich equation constant; 1/n: Adsorption intensity for Freundlich equa- tion Figure 1. Adsorption isotherm of XO at 15°C. Table 3. Langmuir and Freundlich isotherm constants of XO at 15 °C. Langmuir Freundlich qo mg/gA r KF 1/n r 18.15 0.0301 0.999 4.1915 0.31970.84 C opyright © 2013 SciRes. MSCE 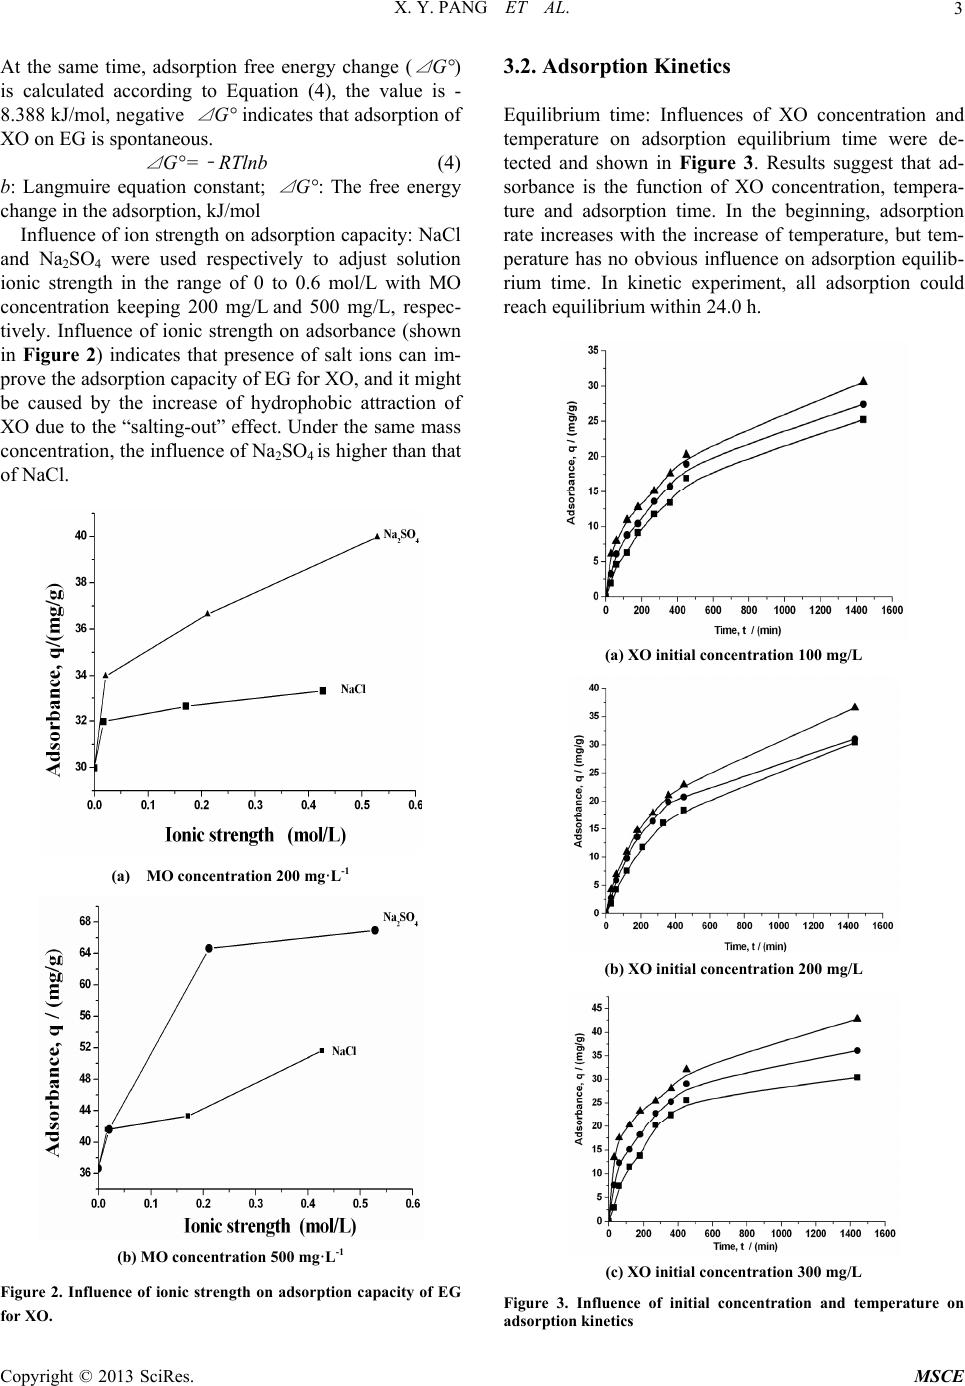 X. Y. PANG ET AL.3 At the same time, adsorption free energy change ( ⊿ G°) is calculated according to Equation (4), the value is - 8.388 kJ/mol, negative ⊿ G° indicates that adsorption of XO on EG is spontaneous. ⊿ G°= ﹣ RTlnb (4) b: Langmuire equation constant; ⊿ G°: The free energy change in the adsorption, kJ/mol Influence of ion strength on adsorption capacity: NaCl and Na2SO4 were used respectively to adjust solution ionic strength in the range of 0 to 0.6 mol/L with MO concentration keeping 200 mg/L and 500 mg/L, respec- tively. Influence of ionic strength on adsorbance (shown in Figure 2) indicates that presence of salt ions can im- prove the adsorption capacity of EG for XO, and it might be caused by the increase of hydrophobic attraction of XO due to the “salting-out” effect. Under the same mass concentration, the influence of Na2SO4 is higher than that of NaCl. (a) MO concentration 200 mg·L-1 (b) MO concentration 500 mg·L-1 Figure 2. Influence of ionic strength on adsorption capacity of EG for XO. 3.2. Adsorption Kinetics Equilibrium time: Influences of XO concentration and temperature on adsorption equilibrium time were de- tected and shown in Figure 3. Results suggest that ad- sorbance is the function of XO concentration, tempera- ture and adsorption time. In the beginning, adsorption rate increases with the increase of temperature, but tem- perature has no obvious influence on adsorption equilib- rium time. In kinetic experiment, all adsorption could reach equilibrium within 24.0 h. (a) XO initial concentration 100 mg/L (b) XO initial concentration 200 mg/L (c) XO initial concentration 300 mg/L Figure 3. Influence of initial concentration and temperature on adsorption kinetics Copyright © 2013 SciRes. MSCE 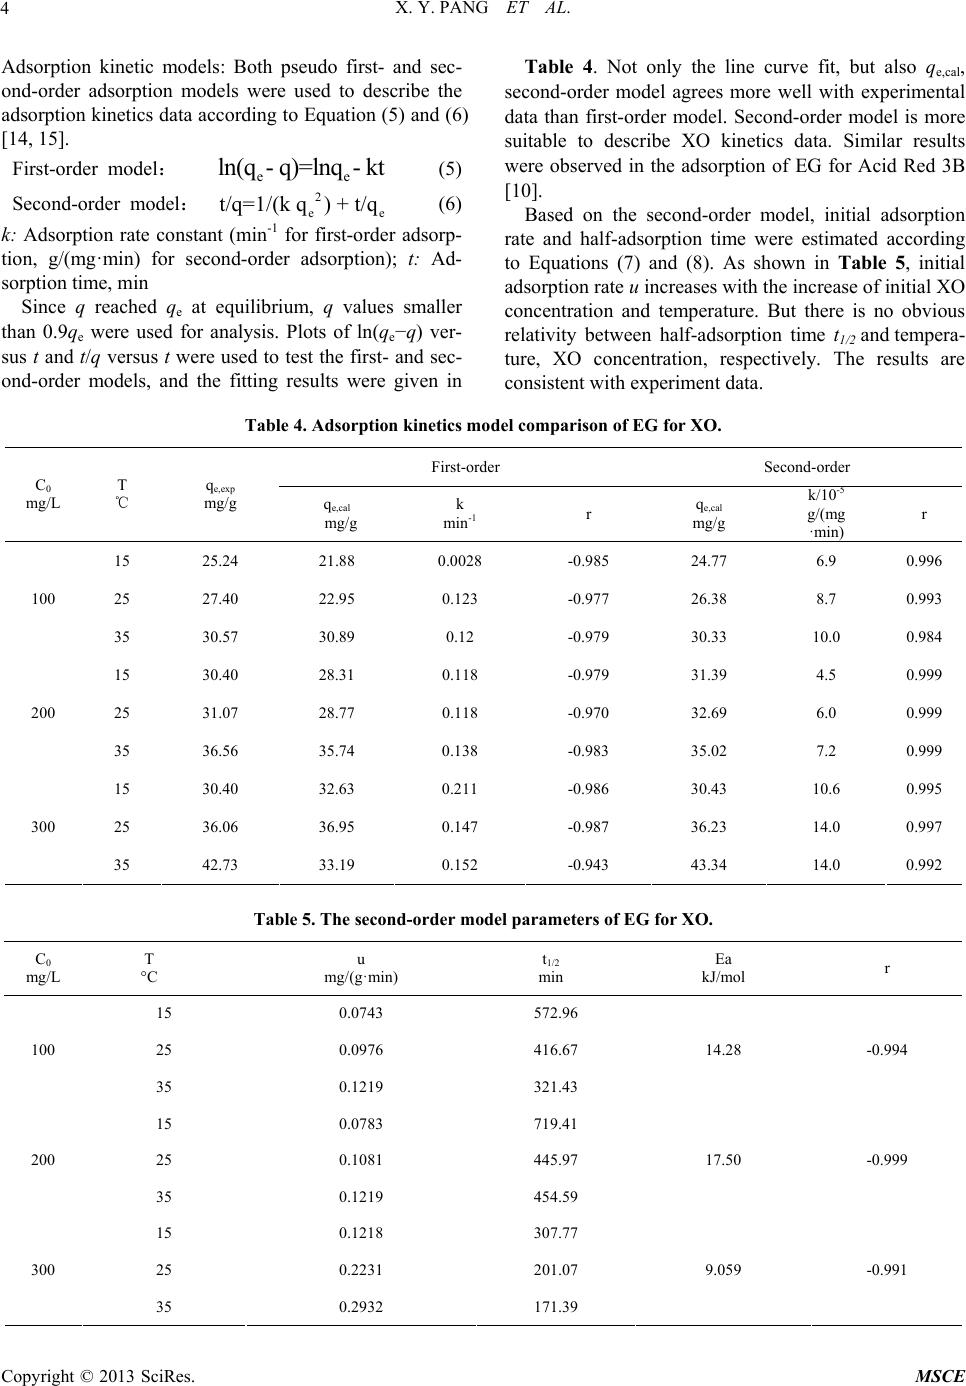 X. Y. PANG ET AL. Copyright © 2013 SciRes. MSCE 4 e Adsorption kinetic models: Both pseudo first- and sec- ond-order adsorption models were used to describe the adsorption kinetics data according to Equation (5) and (6) [14, 15]. Table 4. Not only the line curve fit, but also qe,cal, second-order model agrees more well with experimental data than first-order model. Second-order model is more suitable to describe XO kinetics data. Similar results were observed in the adsorption of EG for Acid Red 3B [10]. First-order model: (5) ee ln(q- q)=lnq- kt Second-order model: (6) 2 e t/q=1/(k q) + t/qBased on the second-order model, initial adsorption rate and half-adsorption time were estimated according to Equations (7) and (8). As shown in Table 5, initial adsorption rate u increases with the increase of initial XO concentration and temperature. But there is no obvious relativity between half-adsorption time t 1/2 and tempera- ture, XO concentration, respectively. The results are consistent with experiment data. k: Adsorption rate constant (min-1 for first-order adsorp- tion, g/(mg·min) for second-order adsorption); t: Ad- sorption time, min Since q reached qe at equilibrium, q values smaller than 0.9qe were used for analysis. Plots of ln(qe−q) ver- sus t and t/q versus t were used to test the first- and sec- ond-order models, and the fitting results were given in Table 4. Adsorption kinetics model comparison of EG for XO. First-order Second-order C0 mg/L T ℃ qe,exp mg/g qe,cal mg/g k min -1 r qe,cal mg/g k/10-5 g/(mg ·min) r 15 25.24 21.88 0.0028 -0.985 24.77 6.9 0.996 25 27.40 22.95 0.123 -0.977 26.38 8.7 0.993 100 35 30.57 30.89 0.12 -0.979 30.33 10.0 0.984 15 30.40 28.31 0.118 -0.979 31.39 4.5 0.999 25 31.07 28.77 0.118 -0.970 32.69 6.0 0.999 200 35 36.56 35.74 0.138 -0.983 35.02 7.2 0.999 15 30.40 32.63 0.211 -0.986 30.43 10.6 0.995 25 36.06 36.95 0.147 -0.987 36.23 14.0 0.997 300 35 42.73 33.19 0.152 -0.943 43.34 14.0 0.992 Table 5. The second-order model parameters of EG for XO. C0 mg/L T °C u mg/(g·min) t1/2 min Ea kJ/mol r 15 0.0743 572.96 25 0.0976 416.67 100 35 0.1219 321.43 14.28 -0.994 15 0.0783 719.41 25 0.1081 445.97 200 35 0.1219 454.59 17.50 -0.999 15 0.1218 307.77 25 0.2231 201.07 300 35 0.2932 171.39 9.059 -0.991  X. Y. PANG ET AL.5 2 e u=kq (7) 1/2 e t=1/(k q) (8) u: Initial adsorption rate, (mg/g·min); t 1/2: Half-adsorption time (min) To judge the sorption belongs to physical adsorption or chemical adsorption, the second-order rate constants are used to estimate activation energy of XO adsorption on EG using Arrhenius Equation (9). Plots of lnk versus 1/T is used to evaluate Ea, and it is found less than 20.0 kJ/mol (as shown in Table 5). So, the adsorption between EG and XO is mainly physical adsorption. Lnk=LnA - Ea/(RT) (9) A: The re-exponential factor, g/(mg·min); Ea: The ad- sorption activation energy, kJ/mol 4. Conclusion This study has provided an insight into the adsorption characteristics of EG for XO. Thermodynamics study illustrates: adsorption of XO on EG is a spontaneous process, and the adsorption isotherm is type II. Adsorption process is affected by multifactor, not only the initial concentration, temperature, but also the ionic strength of solution. High XO initial concentra- tion and ionic strength are propitious to adsorbance. Kinetic study illustrates: adsorption kinetics can be well described by the pseudo second-order kinetic model. Initial adsorption rate increases with the increase of temperature. Active energy of adsorption is less than 20 kJ/mol; and the sorption between EG and XO belongs to physical adsorption. REFERENCES [1] M. L. Xue, Y. L. Yu, Z. H. Ren and J. S. Zhang, “Im- provement in Electrochemical Synthesis of Expanded Graphite,” Fine Chemicals, Vol. 19, No. 10, 2002, pp. 567-570. [2] J. H. Li, Q. Y. Liu, M. Li and Z. R. Liu, “Preparation of Low-sulphur Expandable Graphite,” Fine Chemicals, Vol. 20, No. 6, 2003, pp. 341-342. [3] M. Toyoda, K. Moriya, J. I. Aizawa, H. Konno and M. Inagaki, “Sorption and Recovery of Heavy Oils by Using Exfoliated Graphite Part I: Maximum Sorption Capacity,” Desalination, Vol. 128, No. 3, 2000, pp. 205-211. doi:10.1016/S0011-9164(00)00034-5 [4] M. Inagaki, H. Konno, M. Toyoda, K. Moriya and T. Kihara, “Sorption and Recovery of Heavy Oils by Using Exfoliated Graphite Part II: Recovery of Heavy Oil and Recycling of Exfoliated Graphite,” Desalination, Vol. 128, No. 3, 2000, pp. 213-218. doi:10.1016/S0011-9164(00)00035-7 [5] M. Inagaki, K. Shibata, S. Setou, M. Toyoda and J. I. Aizawa, “Sorption and Recovery of Heavy Oils by Using Exfoliated Graphite Part III: Trials for Practical Applica- tions,” Desalination, Vol. 128, No. 3, 2000, pp. 219-222. doi.:10.1016/S0011-9164(00)00036-9 [6] M. Toyoda, Y. Nishi, N. Iwashita and M. Inagaki, “Sorp- tion and Recovery of Heavy Oils Using Exfoliated Gra- phite Part IV: Discussion of High Oil Sorption of Exfoli- ated Graphite,” Desalination, Vol. 151, No. 3, 2003, pp. 139-144. doi:10.1016/S0011-9164(02)00992-X [7] M. Inagaki, T. Nagata, T. Suwa and M. Toyoda, “Sorp- tion Kinetics of Various Oils onto Exfoliated Graphite,” New Carbon Materials, Vol. 21, No. 2, 2006, pp. 97-102. [8] L. N. Wang, X. Chen, Y. P. Zheng, F. Y. Kang, J. F. Chen and W. C. Shen, “Application of Expansion Graph- ite on the Treatment of Woolen Mill Waste-water,” Guide Journal of Chinese Non-metal Mine Industry, No. 5, 2004, pp. 59-62. [9] L. N. Yang, “Study on the Adsorption of Expansion Graphite for Dyes,” Master of Science, Thesis, Hebei Normal University, Shijiazhuang, 2004. [10] X. Y. Pang and F. Gong, “Study on the Adsorption Ki- netics of Acid Red 3B on Expanded Graphite,” E-Journal of Chemistry, Vol. 5, No. 4, 2008, pp. 802-809. doi:10.1155/2008/786025 [11] Q. K. Hu and W. Jie, “Study on Removal of Xylenol Orange from Water by Fly-ash,” Shanghai Chemical In- dustry, Vol. 31, No. 9, 2006, pp. 5-7. [12] S. Wang, M. Y. Zheng, G. H. Ye and J. C. Guo, “Prepa- ration of Chitosan Microspheres for Adsorptive Removal of Xylenol Orange,” Environmental Pollution & Control, Vol. 30, No. 12, 2008, pp. 43-46. [13] L. J. Xu, “Study on the Adsorption and Competitive Ad- sorption Capacities of Expanded Graphite for Environ- mental Pollutants,” Master of Science, Hebei University, Baoding, 2011. [14] Z. Aksu, “Biosorption of Reactive Dyes by Dried Acti- vated Sludge: Equilibrium and Kinetic Modeling,” Bio- chemical Engineering, Vol. 7, No. 1, 2001, pp. 79-84. doi:10.1016/S1369-703X(00)00098-X [15] Z. J. Wu, H. Joo and K. Lee, “Kinetics and Thermody- namics of the Organic Dye Adsorption on the Mesopor- ous Hybrid Xerogel,” Chemical Engineering Journal, Vol. 112, No. 1-3, 2005, pp. 227-236. doi:10.1016/j.cej.2005.07.011 Copyright © 2013 SciRes. MSCE |