

Paper Menu >>
Journal Menu >>
 Journal of Biosciences and Medicines, 2013, 1, 1-5 JBM doi:10.4236/jbm.2013.11001 Published Online February 2013 (http://www.SciRP.org/journal/jbm/) Published Online Febru ar y 2013 in SciRes. http://www.scirp.org/journal/jbm Isoform Inference From RN A-Seq Samples Based on Gene Structures on Chromosomes Yan Ji, Jia Wei R&D Information, AstraZeneca, Shanghai, China Email: yan.ji@ as trazeneca.com, [email protected] Received 2013. ABSTRACT The emerging RNA-Seq technology makes it possible to infer splicing variants from millions of short sequence reads. Here we present a method to i dentify isoforms by their specific signatures on ch romo some s including both exons and junctions. By applying this method to a RNA-Seq dataset of gastric cancer, we showed that our method is more accurate and sensitive than other isoform inference tools such as RSEM and Cufflinks. By constructing a network from gene list identified by our method but misse d by other tools, we found that some cancer-related genes enriched in network modules have significant implications for cancer drug discovery. Keywords: RNA-Seq; isoform inference; cancer genes; Cuffli nks; RSEM 1. INTRODUCTION Next–generation sequencing (NGS) platforms have been widely available recently [1]. A massively parallel sequencing technology termed RNA-Seq has made it possible to sequence cDNA derived from cellular RNA [2]. Recently, many studies have applied RNA-Seq to various biological and medical studies. Quantification of alternative slicing in tissues [3] and new transcript identification [4] have all benefited from this new tech- nology. To fully enable RNA-Seq technology to solve biological problems, powerful computational tools are required. Since identifying disease driven differentially expressed isoforms is extremely important for drug re- search and development, we focus on inferring iso- for ms fr o m RN A-Seq datasets. In this work, we present an accurate and sensitive method to identify isoforms b y their specific signatures. Expression values of an exon or junction can be calculated by counting the number of reads of a RNA-Seq dataset falling withi n a n e xon o r sp annin g a j uncti o n if b ot h the genome sequence and gene structure annotation are available. For each isoform, there must be single exon (junction) or a combination of exons (junctions) which uniquely belong to the isoform. We term such exons (junctions) as specific exons (junctions) of an isoform. Comparing with other isoform inference tools such as RSEM and Cufflinks, our method has two significant advantages [5, 6]. First, for all the isoforms in the gene structure annotations, our method can determine whether or not they are expressed in a RNA-Seq dataset. In the result section, we show that our method has the capabilit y to identify isofor ms which are missed by both RSEM and Cufflinks. Second, because some exons or junctions of an isoform may be overlapped by other isoforms, the estimation of the expression value of an isoform is always affected by expression levels of other isoforms. Therefore, instead of using expression values of an isofo rm, using expression values of specific exons or junctions of an isoform calculated in our method are better choice for finding differently expressed isoforms by comparing samples from patient and healthy donors. 2. METHODOLOGIES AND RESULTS 2.1. The Desc rip tion o f Our method for Inf erring Iso for ms from RN A-Seq Datasets First, RPKM expression values of both exons and junc- tions are calculated. In this step, two files are needed including a BAM file of the mapping result against reference genome and an annotation file in GFF format containing the structure information of genes on ch r omosomes describing the relationship between exons and is ofor ms. The RPK M exp re ssio n val ue o f an e xon i s calculated by the read counts mapped to a chromosome region of the exon normalized by the total read counts in a sample and the length of the exon. The RPKM expres sio n value of a junct ion is calculated in th e same way except normalization by an extension length spanning the j unct ion p osit io n. Second, a set o f e xons or j unct io ns specific for an isoform are used to determine whether an isoform exists in a sample or not. The rationale to determine the expre ssion status of an iso form in a sample  Y. Ji et al. / Journal of Biosciences and Medicines 1 (2013) 1-5 Copyright © 2013 SciRes. JBM 2 is described as following. If more than sixty percent of exons in an isoform are not expressed or with ver y s mall expr ession va lues, the e xpr ess io n stat us o f the i sofo r m is assigned a term “no expression”. Then, if either the set of specific exons or the set of specific junctions of an isoform are all expressed in a sample, the expression status of the isoform is assigned a term “existence”. Then, if one or more of specific exons or junctions are not expressed and they are located in the 5’ end of the isoform, the expression status of the isoform is assigned a term “uncertainty”. It is because that in the process of RNA- Seq sample preparation, a small fraction of sequences at the 5’ end of an isoform may be degraded or lost due to various reasons. Otherwise the expression status of the isoform is assigned a term “absence”. 2.2. Datasets We apply this method to a Gas tric cancer sample o btained from gastric cancer patient. mRNA was fragmented and plus- and minus- strand cDNA were synthesized for illumina pair-end sequencing. A 300-bp fragment size was selected by gel excision and the sample was sequenced twice to avoid technical variance. There are totally 30,121,416 and 17,510,256 read pairs for each replica. We use TopHat with reference genome hg19 and UCSC gene structure annotation to align the two RNA- Seq datasets [7]. 3. Results In the UCSC gene structure annotation, there are 22920 genes. Our method is designed to determine expression status of isoforms of all the genes having at least two isoforms. That is, 18967 isoforms of 7209 genes can be processed by our method. Because we only processed genes mapped by RNA-Seq reads, our r esult s o n the t wo RNA-Seq datasets, as shown in Figure 1, determined expre ssio n stat us of 16151 isoforms of 5891 genes. Fi g ure 1 . Comparisons of expression status of isoform between our method and RSEM. Level 1 is the evidence used to in- fer isofo rm by our method: exon, junction and no expression. Level 2 is the type of isoform expression status inferred by our method: existence, uncertainty and absence. Level 3 is the expression level of an isoform inferred from their expression values calcu lated b y RSEM: i sofor ms marked with ‘yes’ ar e taken as express ed iso forms if their exp ression values are b ig- ger than 0.3; isoforms marked with ‘no’ are taken to be absent in a RNA-seq dataset if their expression valu es are no bigger than 0.3 . 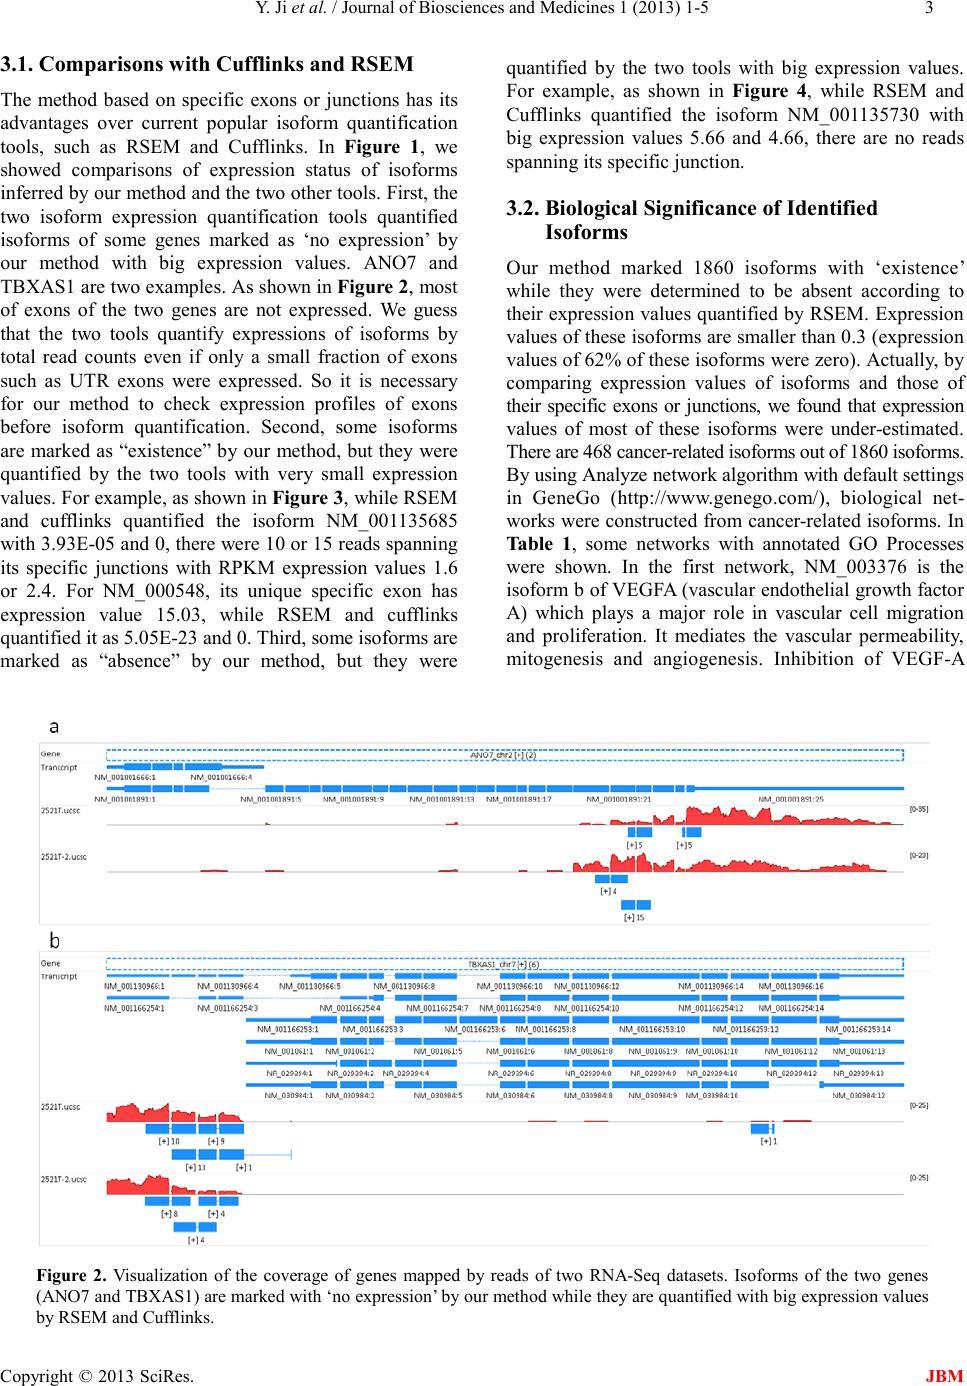 Y. Ji et al. / Journal of Biosciences and Medicines 1 (2013) 1-5 Copyright © 2013 SciRes. JBM 3 3.1. Comparisons with Cufflinks and RSEM The method based on specific exons or junctions has its advantages over current popular isoform quantification tools, such as RSEM and Cufflinks. In Figure 1, we showed comparisons of expression status of isoforms inferred by our method and the two other tools. First, t he two isoform expression quantification tools quantified isoforms of some genes marked as ‘no expression’ by our method with big expression values. ANO7 and TB XAS 1 are two examples. As sho wn i n Fi gu re 2, mo st of exons of the two genes are not expressed. We guess that the two tools quantify expressions of isoforms by total read counts even if only a small fraction of exons such as UTR exons were expressed. So it is necessary for our method to check expression profiles of exons before isoform quantification. Second, some isoforms are marked as “existence” by our method, but they were quantified by the two tools with very small expression value s. Fo r exa mpl e, as s ho w n in Fi gu re 3, while RSEM and cufflinks quantified the isoform NM_001135685 with 3.93E-05 and 0, there were 10 or 15 reads spanning its specific junctions with RPKM expression values 1.6 or 2.4. For NM_000548, its unique specific exon has expression value 15.03, while RSEM and cufflinks quantified it as 5.05E-23 and 0. Third, some isoforms are marked as “absence” by our method, but they were quantified by the two tools with big expression values. For example, as shown in Figure 4, while RSEM and Cufflinks quantified the isoform NM_001135730 with big expression values 5.66 and 4.66, there are no reads spanning its specific junction. 3.2. Biological Significance of Identified Isof orm s Our method marked 1860 isoforms with ‘existence’ while they we re determined to be absent according to their expressio n value s quantifi ed by RSEM . Expre ssion values of these isoforms are smaller than 0.3 (e xpre ssio n values of 62% of these isoforms were zero). Actually, b y comparing expression values of isoforms and those of their specific exons or junctions, we found that expression values of most of these isoforms were under-estimated. There are 468 cancer-related isoforms out of 1860 isoforms. By using Analyze network algorithm with default settings in GeneGo (http://www.genego.com/), biological net- works were constructed from cancer-related iso forms. In Table 1, some networks with annotated GO Processes were shown. In the first network, NM_003376 is the isoform b of VEGFA (vascula r endothelial growth factor A) which plays a major role in vascular cell migration and proliferation. It mediates the vascular permeability, mitogenesis and angiogenesis. Inhibition of VEGF-A Figure 2. Visualization of the coverage of genes mapped by reads of two RNA-Seq datasets. Isoforms of the two genes (ANO7 and TBXAS1) are marked with ‘no expression’ by our method while they are quantified with big expression values by RSEM and Cufflinks.  Y. Ji et al. / Journal of Biosciences and Medicines 1 (2013) 1-5 Copyright © 2013 SciRes. JBM 4 Figure 3. Visualization of the coverage of genes mapped by reads of two RNA-Seq datasets. As shown in ‘a’, NM_001135685 has two specific junctions highlighted by arrows. As shown in ‘b’, NM_000548 has a specific exon. The two isoforms are marked with ‘existence’ by our method while they are quantified with very small or zero expression val- ues by RSEM and Cufflinks. Figure 4. Visualization of the coverage of genes mapped by reads of two RNA-Seq datasets. NM_001135730 has a specific junction highlighted by an arrow. It is marked with ‘absence’ by our method while it is quantified with big expression values by both RSEM and Cufflinks. promoter may be a useful approach for treating diseases in which aberrant angiogensis is present such as inflammatory diseases, cancer and diabetic retinopathy among others [8]. In the second network, NM_021872 is the smallest isoform of CDC25B (M-phase inducer phosphatase 2) which plays a role in endogenous tyrosine 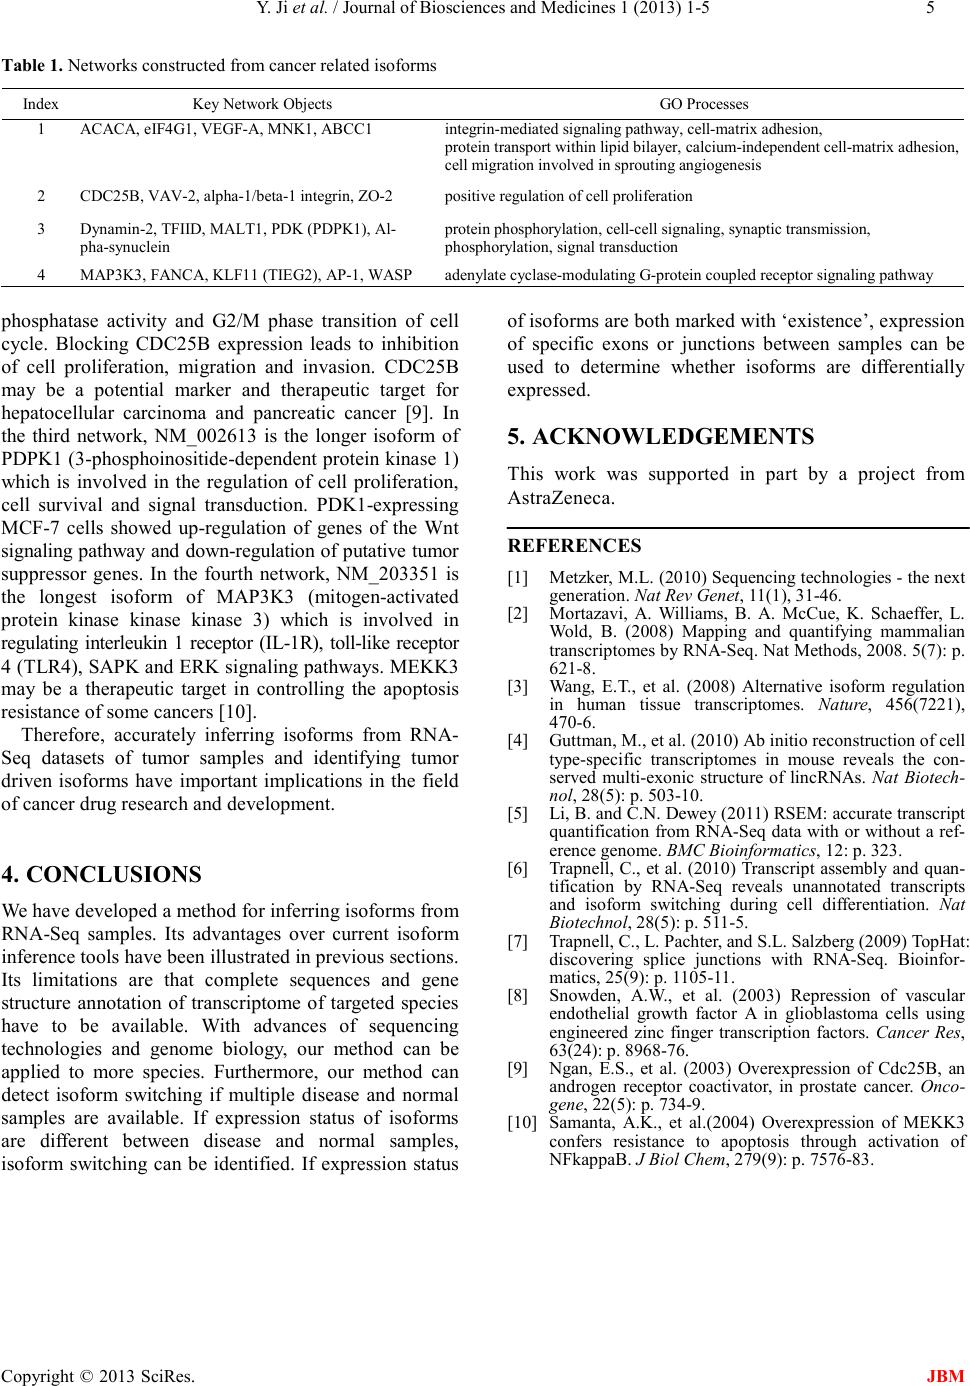 Y. Ji et al. / Journal of Biosciences and Medicines 1 (2013) 1-5 Copyright © 2013 SciRes. JBM 5 Table 1. Networks constructed from cancer related iso fo r ms Index Key Network Objects GO Process es 1 ACACA, eIF4 G1, VEG F -A, MNK1, ABC C1 integrin-mediated signaling pathway, cell-mat r ix adhesi on, prote in tr ans po r t w ith in lip id bilaye r , calcium -independent cell-ma trix adhesion, cell mi gr ation involved in spro uting angiogenesis 2 CDC25B, VAV-2, al ph a-1/beta-1 integrin, ZO-2 posi tive regulati on of cell prolifera tion 3 Dyn a m in -2, TFIID, MALT1, PDK (PDPK1), Al- pha-synuclein protein phosphorylation, cell-cell signaling, synaptic transmission, phosp horylation, signal transduction 4 MAP3K3, FANCA, KLF1 1 (TIEG2) , AP-1, WAS P adenylate cyclase-modulating G-protein coupled receptor signaling pathway phosphatase activity and G2/M phase transition of cell cycle. Blocking CDC25B expression leads to inhibition of cell proliferation, migration and invasion. CDC25B may be a potential marker and therapeutic target for hepatocellular carcinoma and pancreatic cancer [9]. In the third network, NM_002613 is the longer isoform of PDPK1 (3-phosphoinositide-dependent protein kinase 1) which is involved in the regulation of cell proliferation, cell survival and signal transduction. PDK1-expressing MCF-7 cells showed up-regulation of genes of the Wnt signaling pathway and down-regula tion of p utati ve t umor suppressor genes. In the fourth network, NM_203351 is the longest isoform of MAP3K3 (mitogen-activated protein kinase kinase kinase 3) which is involved in regulating interleukin 1 receptor (IL-1R), toll-like receptor 4 (TLR4), SAPK and ERK signaling pathways. MEKK3 may be a therapeutic target in controlling the apoptosis resistance of some cancers [10]. Therefore, accurately inferring isoforms from RNA- Seq datasets of tumor samples and identifying tumor driven isoforms have important implications in the field of cancer drug res earch and development. 4. CONCLUSIONS We have developed a method for inferring isoforms from RNA-Seq samples. Its advantages over current isoform inference tools have been illustrated in previous sections. Its limitations are that complete sequences and gene structure annotation of transcriptome of targeted species have to be available. With advances of sequencing technologies and genome biology, our method can be applied to more species. Furthermor e , our method can detect isoform switching if multiple disease and no rmal samp l e s are available. If expression status of isoforms are different between disease and normal samples, isoform switching can be identi fied . If expression status of isofo r ms ar e both marked with ‘e xis tenc e’, expr essio n of specific exons or junctions between samples can be used to determine whether isoforms are differentially expressed. 5. ACKNOWLEDGEMENTS This work was supported in part by a project from AstraZeneca. REFERENCES [1] Met zker, M.L. (2010) Sequencing technologies - the ne xt generation. Nat R ev Genet, 11(1), 31-46. [2] Mortazavi, A. Williams, B. A. McCue, K. Schaeffer, L. Wold, B. (2008) Mapping and quantifying mammalian transcri pt omes b y RNA-Seq . Nat M ethods, 2008. 5(7): p. 621-8. [3] Wang, E.T., et al. (2008) Alternative isoform regulation in human tissue transcriptomes. Nature, 456(7221), 470-6. [4] Guttman, M., et al. (2010) Ab initio reconstruction of cell type-specific transcriptomes in mouse reveals the con- served multi-exonic structure of lincRNAs. Nat Biotech- nol, 28(5): p. 503-10. [5] Li, B. and C.N. Dewey (2011) RSEM: accu rate t rans crip t quantification from RNA-Seq data with or without a ref- erence genome. BMC Bioinformatics, 12: p. 323. [6] Trapnel l, C., et al. (2010) Transcript assembly and quan- tification by RNA-Seq reveals unannotated transcripts and isoform switching during cell differentiation. Nat Biotechnol, 28(5): p. 511-5. [7] Trapnell, C., L. Pachter, and S.L. Salzberg (2009) TopHat: discovering splice junctions with RNA-Seq. Bioinfor- matics, 25(9): p. 1105-11. [8] Snowden, A.W., et al. (2003) Repression of vascular endothelial growth factor A in glioblastoma cells using engineered zinc finger transcription factors. Cancer Res, 63(24): p. 8968-76. [9] Ngan, E.S., et al. (2003) Overexpression of Cdc25B, an androgen receptor coactivator, in prostate cancer. On co- gene, 22(5): p. 734-9. [10] Samanta, A.K., et al.(2004) Overexpression of MEKK3 confers resistance to apoptosis through activation of NFkappaB. J Biol Chem, 27 9( 9): p. 757 6-83. |