

Paper Menu >>
Journal Menu >>
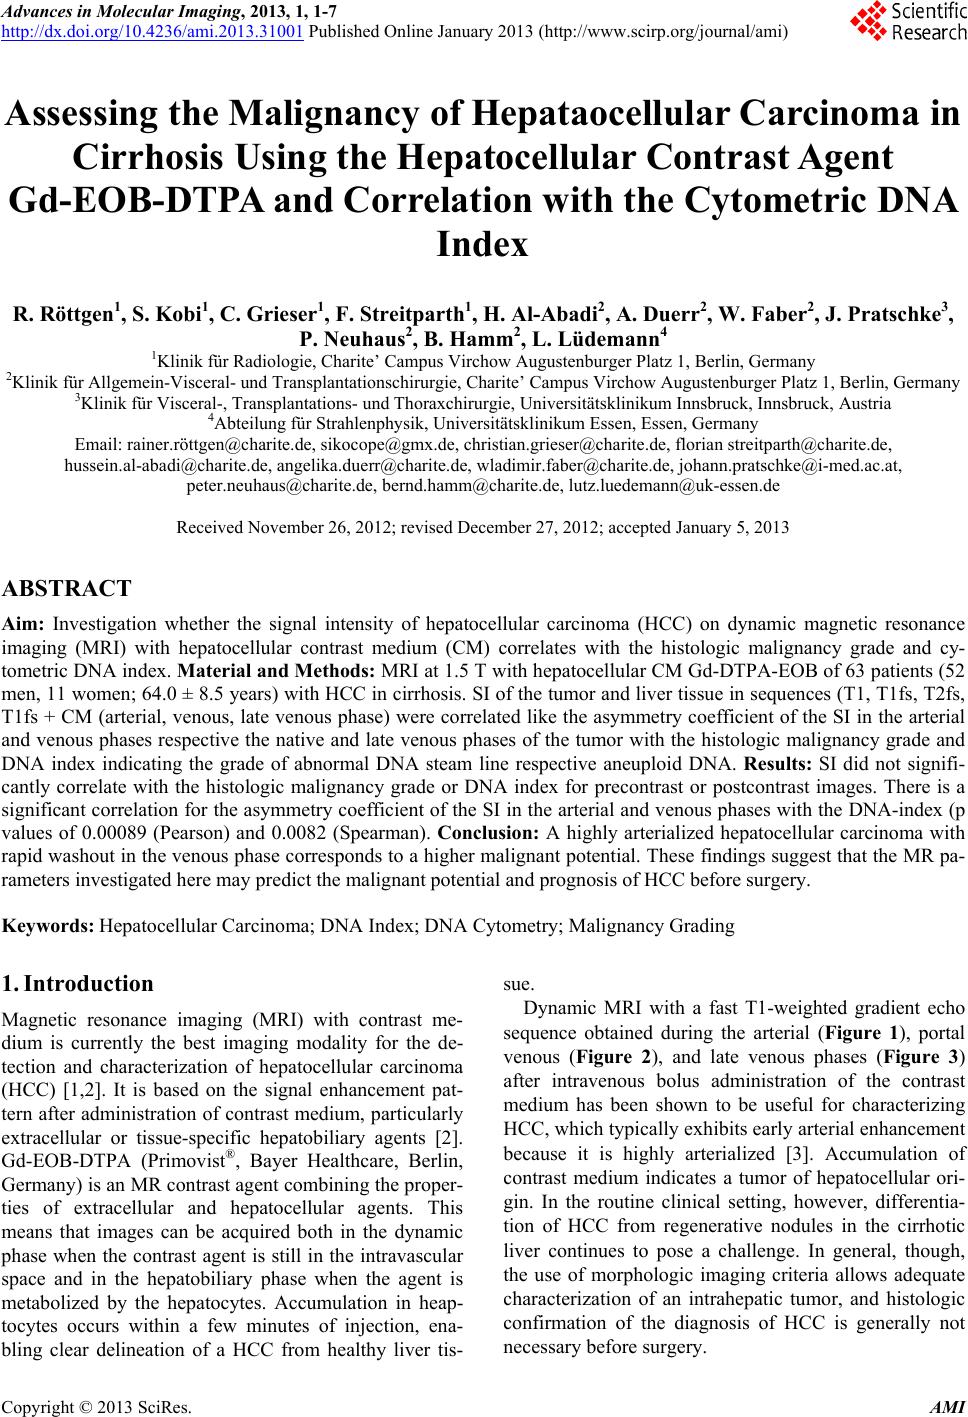 Advances in Molecular Imaging, 2013, 1, 1-7 http://dx.doi.org/10.4236/ami.2013.31001 Published Online January 2013 (http://www.scirp.org/journal/ami) Assessing the Malignancy of Hepataocellular Carcinoma in Cirrhosis Using the Hepatocellular Contrast Agent Gd-EOB-DTPA and Correlation with the Cytometric DNA Index R. Röttgen1, S. Kobi1, C. Grieser1, F. Streitparth1, H. Al-Abadi2, A. Duerr2, W. Faber2, J. Pratschke3, P. Neuhaus2, B. Hamm2, L. Lüdemann4 1Klinik für Radiologie, Charite’ Campus Virchow Augustenburger Platz 1, Berlin, Germany 2Klinik für Allgemein-Visceral- und Transplantationschirurgie, Charite’ Campus Virchow Augustenburger Platz 1, Berlin, Germany 3Klinik für Visceral-, Transplantations- und Thoraxchirurgie, Universitätsklinikum Innsbruck, Innsbruck, Austria 4Abteilung für Strahlenphysik, Universitätsklinikum Essen, Essen, Germany Email: rainer.rö[email protected], [email protected], christ[email protected], florian streitparth @charite.de, [email protected], bernd.hamm@charite.de , lutz.luedemann@u k - e ssen.de Received November 26, 2012; revised December 27, 2012; accepted January 5, 2013 ABSTRACT Aim: Investigation whether the signal intensity of hepatocellular carcinoma (HCC) on dynamic magnetic resonance imaging (MRI) with hepatocellular contrast medium (CM) correlates with the histologic malignancy grade and cy- tometric DNA index. Material and Methods: MRI at 1.5 T with hepatocellular CM Gd-DTPA-EOB of 63 patients (52 men, 11 women; 64.0 ± 8.5 years) with HCC in cirrhosis. SI of the tumor and liver tissue in sequences (T1, T1fs, T2fs, T1fs + CM (arterial, venous, late venous phase) were correlated lik e the asymmetry coefficient of the SI in the arterial and venous phases respective the native and late venous phases of the tumor with the histologic malignancy grade and DNA index indicating the grade of abnormal DNA steam line respective aneuploid DNA. Results: SI did not signifi- cantly correlate with the histologic malignancy grade or DNA index for precontrast or postcontrast images. There is a significant correlation for the asymmetry coefficient of the SI in the arterial and venous phases with the DNA-index (p values of 0.00089 (Pearson) and 0.0082 (Spearman). Conclusion: A highly arterialized hepatocellular carcinoma with rapid washout in the venous phase corresponds to a higher malignant potential. These findings suggest that the MR pa- rameters investigated here may predict the malignant potential and prognosis of HCC before surgery. Keywords: Hepatocellular Carcinoma; DNA Index; DNA Cytometry; Malignancy Grading 1. Introduction Magnetic resonance imaging (MRI) with contrast me- dium is currently the best imaging modality for the de- tection and characterization of hepatocellular carcinoma (HCC) [1,2]. It is based on the signal enhancement pat- tern after administration of contrast medium, particularly extracellular or tissue-specific hepatobiliary agents [2]. Gd-EOB-DTPA (Primovist®, Bayer Healthcare, Berlin, Germany) is an MR contrast agent combining the proper- ties of extracellular and hepatocellular agents. This means that images can be acquired both in the dynamic phase when the contrast agent is still in the intravascular space and in the hepatobiliary phase when the agent is metabolized by the hepatocytes. Accumulation in heap- tocytes occurs within a few minutes of injection, ena- bling clear delineation of a HCC from healthy liver tis- sue. Dynamic MRI with a fast T1-weighted gradient echo sequence obtained during the arterial (Figure 1), portal venous (Figure 2), and late venous phases (Figure 3) after intravenous bolus administration of the contrast medium has been shown to be useful for characterizing HCC, which typically exhibits early arterial enhancement because it is highly arterialized [3]. Accumulation of contrast medium indicates a tumor of hepatocellular ori- gin. In the routine clinical setting, however, differentia- tion of HCC from regenerative nodules in the cirrhotic liver continues to pose a challenge. In general, though, the use of morphologic imaging criteria allows adequate characterization of an intrahepatic tumor, and histologic confirmation of the diagnosis of HCC is generally not necessary before surgery. C opyright © 2013 SciRes. AMI 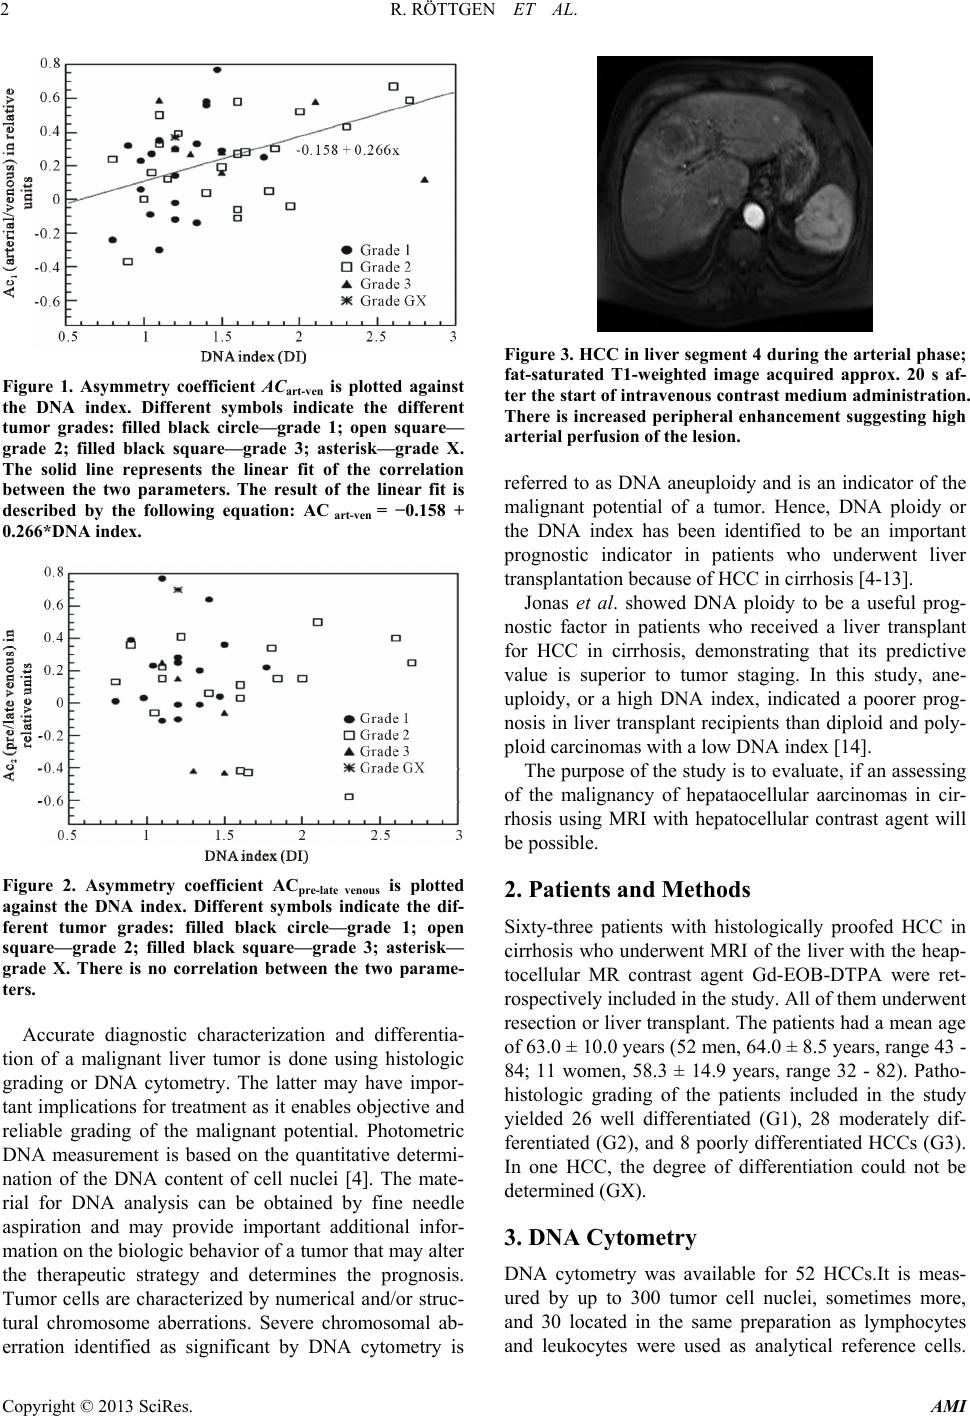 R. RÖTTGEN ET AL. 2 Figure 1. Asymmetry coefficient ACart-ven is plotted against the DNA index. Different symbols indicate the different tumor grades: filled black circle—grade 1; open square— grade 2; filled black square—grade 3; asterisk—grade X. The solid line represents the linear fit of the correlation between the two parameters. The result of the linear fit is described by the following equation: AC art-ven = −0.158 + 0.266*DNA index. Figure 2. Asymmetry coefficient ACpre-late venous is plotted against the DNA index. Different symbols indicate the dif- ferent tumor grades: filled black circle—grade 1; open square—grade 2; filled black square—grade 3; asterisk— grade X. There is no correlation between the two parame- ters. Accurate diagnostic characterization and differentia- tion of a malignant liver tumor is done using histologic grading or DNA cytometry. The latter may have impor- tant implications fo r treatment as it enables objectiv e and reliable grading of the malignant potential. Photometric DNA measurement is based on the quantitative determi- nation of the DNA content of cell nuclei [4]. The mate- rial for DNA analysis can be obtained by fine needle aspiration and may provide important additional infor- mation on the biologic behavior of a tumor that may alter the therapeutic strategy and determines the prognosis. Tumor cells are characterized by numerical and/or struc- tural chromosome aberrations. Severe chromosomal ab- erration identified as significant by DNA cytometry is Figure 3. HCC in liver segment 4 during the arterial phase; fat-saturated T1-weighted image acquired approx. 20 s af- ter the start of intravenous contrast medium administration. There is increased peripheral enhancement suggesting high arterial perfusion of the lesion. referred to as DNA aneuploidy and is an indicator of the malignant potential of a tumor. Hence, DNA ploidy or the DNA index has been identified to be an important prognostic indicator in patients who underwent liver transplantation because of HCC in cirrhosis [4-13]. Jonas et al. showed DNA ploidy to be a useful prog- nostic factor in patients who received a liver transplant for HCC in cirrhosis, demonstrating that its predictive value is superior to tumor staging. In this study, ane- uploidy, or a high DNA index, indicated a poorer prog- nosis in liver transplant recipients than diploid and poly- ploid carcinomas with a low DNA index [14]. The purpose of the study is to evaluate, if an assessing of the malignancy of hepataocellular aarcinomas in cir- rhosis using MRI with hepatocellular contrast agent will be possible. 2. Patients and Methods Sixty-three patients with histologically proofed HCC in cirrhosis who underwent MRI of the liver with the heap- tocellular MR contrast agent Gd-EOB-DTPA were ret- rospectively included in the study. All of them underwent resection or liver transplant. The patients had a mean age of 63.0 ± 10.0 years (5 2 men, 64 .0 ± 8.5 year s, range 43 - 84; 11 women, 58.3 ± 14.9 years, range 32 - 82). Patho- histologic grading of the patients included in the study yielded 26 well differentiated (G1), 28 moderately dif- ferentiated (G2), and 8 poorly differentiated HCCs (G3). In one HCC, the degree of differentiation could not be determined (GX). 3. DNA Cytometry DNA cytometry was available for 52 HCCs.It is meas- ured by up to 300 tumor cell nuclei, sometimes more, and 30 located in the same preparation as lymphocytes and leukocytes were used as analytical reference cells. Copyright © 2013 SciRes. AMI 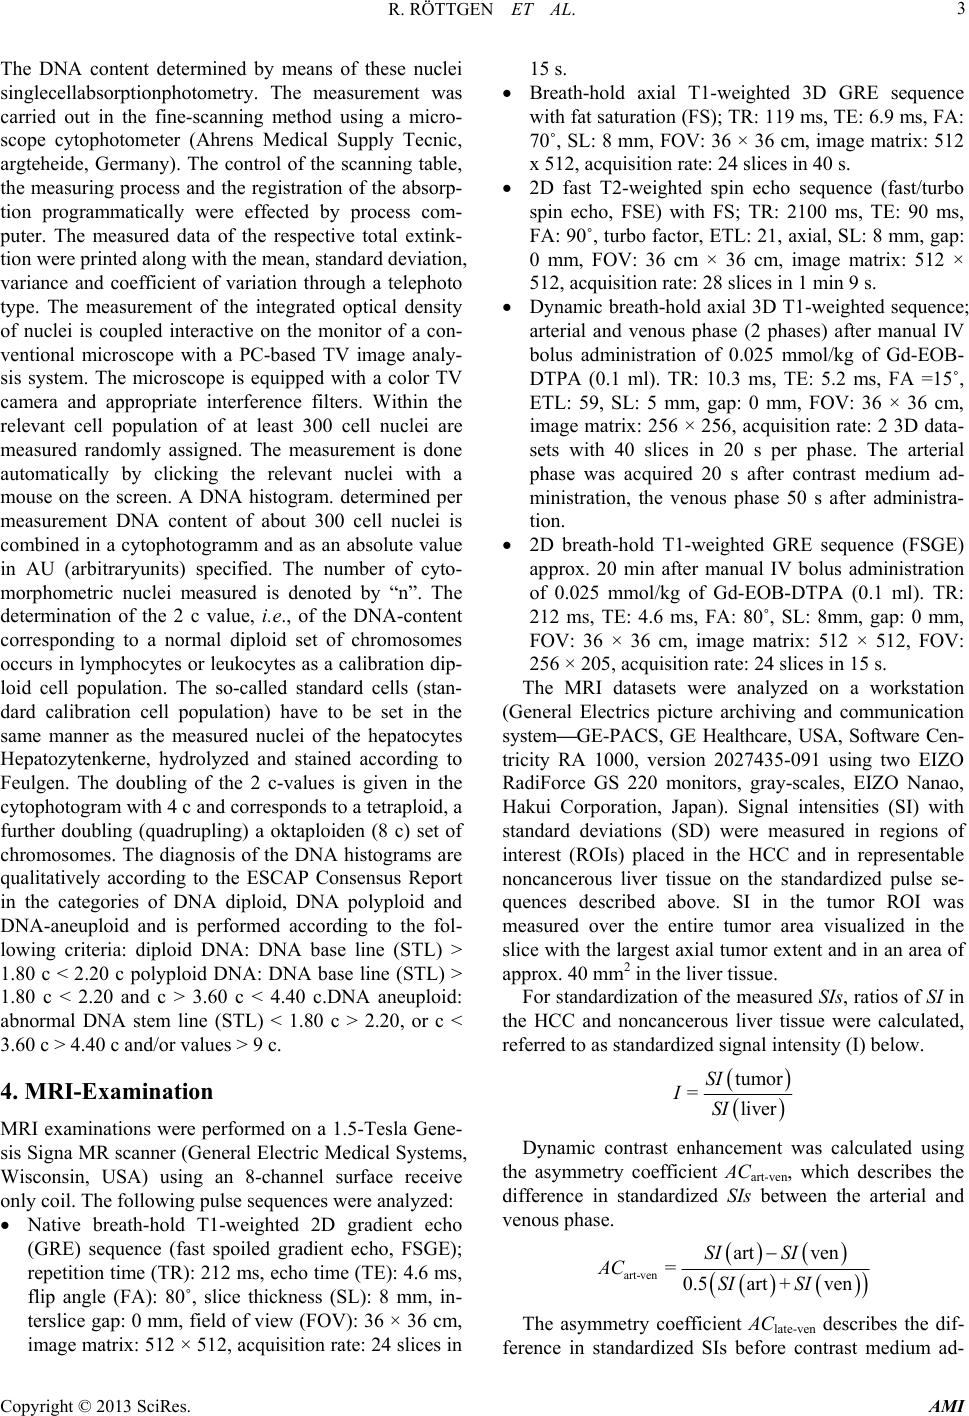 R. RÖTTGEN ET AL. 3 The DNA content determined by means of these nuclei singlecellabsorptionphotometry. The measurement was carried out in the fine-scanning method using a micro- scope cytophotometer (Ahrens Medical Supply Tecnic, argteheide, Germany). The control of the scanning table, the measuring process and the registration of the absorp- tion programmatically were effected by process com- puter. The measured data of the respective total extink- tion were printed along with the mean, standard deviation, variance and coefficient of variation through a telephoto type. The measurement of the integrated optical density of nuclei is coupled interactive on the monitor of a con- ventional microscope with a PC-based TV image analy- sis system. The microscope is equipped with a color TV camera and appropriate interference filters. Within the relevant cell population of at least 300 cell nuclei are measured randomly assigned. The measurement is done automatically by clicking the relevant nuclei with a mouse on the screen. A DNA histogram. determined per measurement DNA content of about 300 cell nuclei is combined in a cytophotogramm and as an absolute value in AU (arbitraryunits) specified. The number of cyto- morphometric nuclei measured is denoted by “n”. The determination of the 2 c value, i.e., of the DNA-content corresponding to a normal diploid set of chromosomes occurs in lymphocytes or leukocytes as a calibration dip- loid cell population. The so-called standard cells (stan- dard calibration cell population) have to be set in the same manner as the measured nuclei of the hepatocytes Hepatozytenkerne, hydrolyzed and stained according to Feulgen. The doubling of the 2 c-values is given in the cytophotogram with 4 c and corresponds to a tetraplo id, a further doubling (quadrupling) a oktaploiden (8 c) set of chromosomes. The diagnosis of the DNA histograms are qualitatively according to the ESCAP Consensus Report in the categories of DNA diploid, DNA polyploid and DNA-aneuploid and is performed according to the fol- lowing criteria: diploid DNA: DNA base line (STL) > 1.80 c < 2.20 c polyploid DNA: DNA base line (STL) > 1.80 c < 2.20 and c > 3.60 c < 4.40 c.DNA aneuploid: abnormal DNA stem line (STL) < 1.80 c > 2.20, or c < 3.60 c > 4.40 c and/or values > 9 c. 4. MRI-Examination MRI examinations were performed on a 1.5-Tesla Gene- sis Signa MR scanner (General Electric Medical Systems, Wisconsin, USA) using an 8-channel surface receive only coil. The following pulse sequences were analyzed: Native breath-hold T1-weighted 2D gradient echo (GRE) sequence (fast spoiled gradient echo, FSGE); repetition time (TR): 212 ms, echo time (TE): 4.6 ms, flip angle (FA): 80˚, slice thickness (SL): 8 mm, in- terslice gap: 0 mm, field of view (FOV): 36 × 36 cm, image matrix: 512 × 512, acquisition rate: 24 slices in 15 s. Breath-hold axial T1-weighted 3D GRE sequence with fat saturation (FS); TR: 119 ms, TE: 6.9 ms, FA: 70˚, SL: 8 mm, FOV: 36 × 36 cm, image matrix: 512 x 512, acquisition rate: 24 slices in 40 s. 2D fast T2-weighted spin echo sequence (fast/turbo spin echo, FSE) with FS; TR: 2100 ms, TE: 90 ms, FA: 90˚, turbo factor, ETL: 21, axial, SL: 8 mm, gap: 0 mm, FOV: 36 cm × 36 cm, image matrix: 512 × 512, acquisition rate: 28 slices in 1 min 9 s. Dynamic breath-hold axial 3D T1-weighted sequence; arterial and venous phase (2 phases) after manual IV bolus administration of 0.025 mmol/kg of Gd-EOB- DTPA (0.1 ml). TR: 10.3 ms, TE: 5.2 ms, FA =15˚, ETL: 59, SL: 5 mm, gap: 0 mm, FOV: 36 × 36 cm, image matrix: 256 × 256, acquisition rate: 2 3D data- sets with 40 slices in 20 s per phase. The arterial phase was acquired 20 s after contrast medium ad- ministration, the venous phase 50 s after administra- tion. 2D breath-hold T1-weighted GRE sequence (FSGE) approx. 20 min after manual IV bolus administration of 0.025 mmol/kg of Gd-EOB-DTPA (0.1 ml). TR: 212 ms, TE: 4.6 ms, FA: 80˚, SL: 8mm, gap: 0 mm, FOV: 36 × 36 cm, image matrix: 512 × 512, FOV: 256 × 205, acquisition rate: 24 slices in 15 s. The MRI datasets were analyzed on a workstation (General Electrics picture archiving and communication system—GE-PACS, GE Healthcare, USA, Software Cen- tricity RA 1000, version 2027435-091 using two EIZO RadiForce GS 220 monitors, gray-scales, EIZO Nanao, Hakui Corporation, Japan). Signal intensities (SI) with standard deviations (SD) were measured in regions of interest (ROIs) placed in the HCC and in representable noncancerous liver tissue on the standardized pulse se- quences described above. SI in the tumor ROI was measured over the entire tumor area visualized in the slice with the largest axial tumor extent and in an area of approx. 40 mm2 in the liver tissue. For standardization of the measured SIs, ratios of SI in the HCC and noncancerous liver tissue were calculated, referred to as standardized signal intensity (I) below. tumor liver SI I= SI Dynamic contrast enhancement was calculated using the asymmetry coefficient ACart-ven, which describes the difference in standardized SIs between the arterial and venous phase. art-ven art ven 0.5 artven SI SI AC =SI +SI The asymmetry coefficient AClate-ven describes the dif- ference in standardized SIs before contrast medium ad- Copyright © 2013 SciRes. AMI 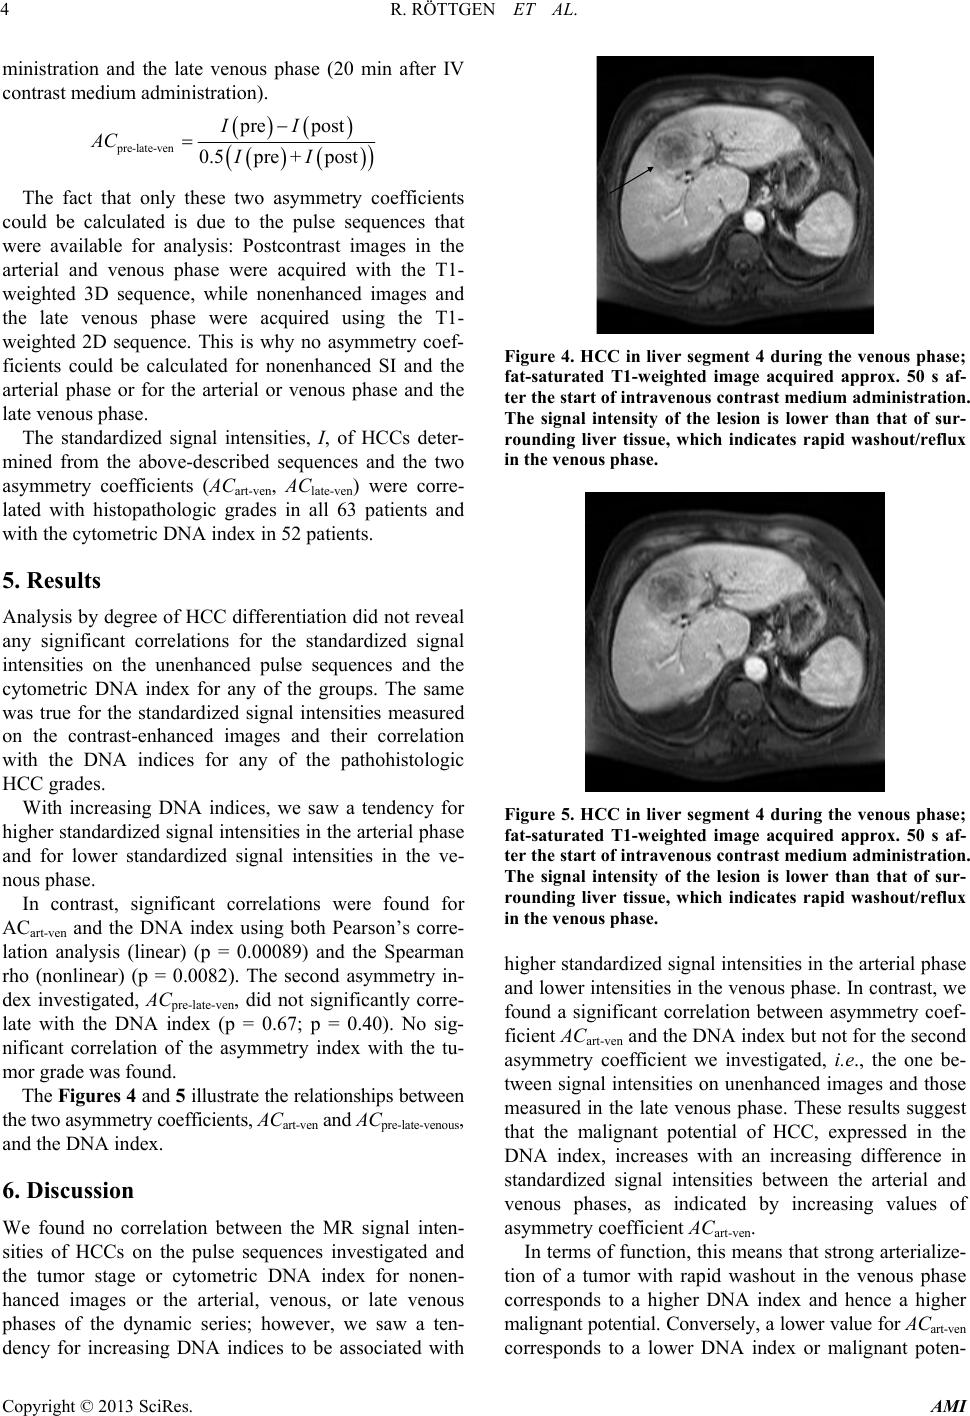 R. RÖTTGEN ET AL. 4 ministration and the late venous phase (20 min after IV contrast medium administration). pre-late-ven pre 0.5 pr AC post e post II I+I The fact that only these two asymmetry coefficients could be calculated is due to the pulse sequences that were available for analysis: Postcontrast images in the arterial and venous phase were acquired with the T1- weighted 3D sequence, while nonenhanced images and the late venous phase were acquired using the T1- weighted 2D sequence. This is why no asymmetry coef- ficients could be calculated for nonenhanced SI and the arterial phase or for the arterial or venous phase and the late venous phase. The standardized signal intensities, I, of HCCs deter- mined from the above-described sequences and the two asymmetry coefficients (ACart-ven, AClate-ven) were corre- lated with histopathologic grades in all 63 patients and with the cytometric DNA index in 52 patients. 5. Results Analysis by degree of HCC differentiation did not reveal any significant correlations for the standardized signal intensities on the unenhanced pulse sequences and the cytometric DNA index for any of the groups. The same was true for the standardized signal intensities measured on the contrast-enhanced images and their correlation with the DNA indices for any of the pathohistologic HCC grades. With increasing DNA indices, we saw a tendency for higher standardized sign al intensities in the arterial ph ase and for lower standardized signal intensities in the ve- nous phase. In contrast, significant correlations were found for ACart-ven and the DNA index using both Pearson’s corre- lation analysis (linear) (p = 0.00089) and the Spearman rho (nonlinear) (p = 0.0082). The second asymmetry in- dex investigated, ACpre-late-ven, did not significantly corre- late with the DNA index (p = 0.67; p = 0.40). No sig- nificant correlation of the asymmetry index with the tu- mor grade was found. The Figures 4 and 5 illustrate the relationsh ips between the two asymmetry coefficients, ACart-ven and ACpre-late-veno us, and the DNA index. 6. Discussion We found no correlation between the MR signal inten- sities of HCCs on the pulse sequences investigated and the tumor stage or cytometric DNA index for nonen- hanced images or the arterial, venous, or late venous phases of the dynamic series; however, we saw a ten- dency for increasing DNA indices to be associated with Figure 4. HCC in liver segment 4 during the venous phase; fat-saturated T1-weighted image acquired approx. 50 s af- ter the start of intravenous contrast medium administration. The signal intensity of the lesion is lower than that of sur- rounding liver tissue, which indicates rapid washout/reflux in the venous phase. Figure 5. HCC in liver segment 4 during the venous phase; fat-saturated T1-weighted image acquired approx. 50 s af- ter the start of intravenous contrast medium administration. The signal intensity of the lesion is lower than that of sur- rounding liver tissue, which indicates rapid washout/reflux in the venous phase. higher standardized sign al intensities in the arterial ph ase and lower intensities in the ven ous phase. In contrast, we found a significant correlation between asymmetry coef- ficient ACart-ven and the DNA index but not for the second asymmetry coefficient we investigated, i.e., the one be- tween signal intensities on unenh anced images and those measured in the late venous phase. These results suggest that the malignant potential of HCC, expressed in the DNA index, increases with an increasing difference in standardized signal intensities between the arterial and venous phases, as indicated by increasing values of asymmetry coefficient ACart-ven. In terms of function, this means that strong arterialize- tion of a tumor with rapid washout in the venous phase corresponds to a higher DNA index and hence a higher malignant potential. Conversely, a lower value for ACart-ven corresponds to a lower DNA index or malignant poten- Copyright © 2013 SciRes. AMI 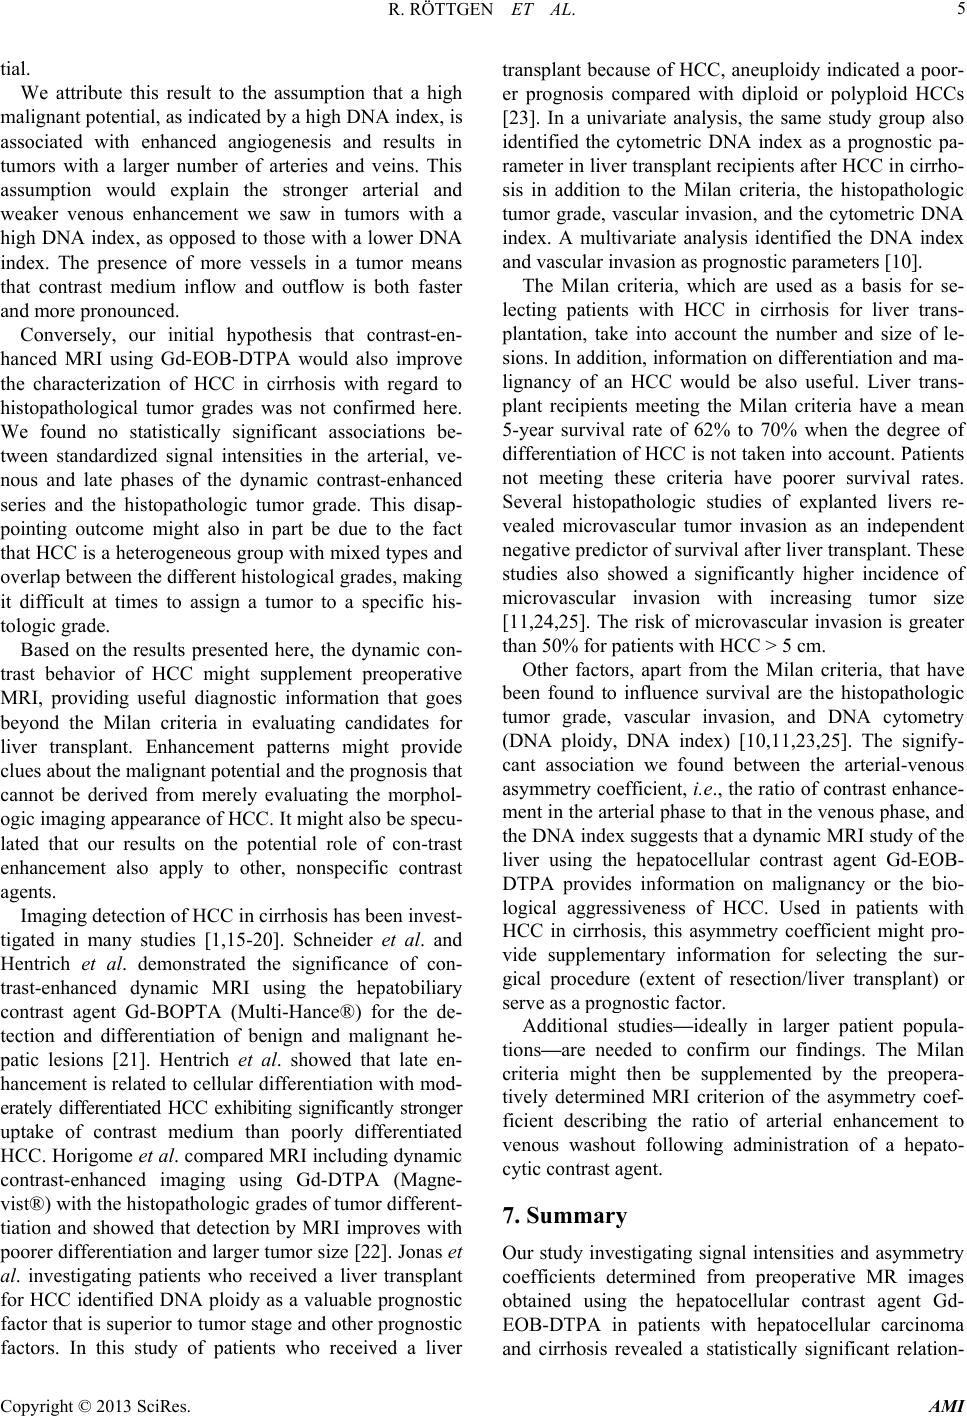 R. RÖTTGEN ET AL. 5 tial. We attribute this result to the assumption that a high malignant potential, as indicated by a high DNA index, is associated with enhanced angiogenesis and results in tumors with a larger number of arteries and veins. This assumption would explain the stronger arterial and weaker venous enhancement we saw in tumors with a high DNA index, as opposed to tho se with a lower DNA index. The presence of more vessels in a tumor means that contrast medium inflow and outflow is both faster and more pronounced. Conversely, our initial hypothesis that contrast-en- hanced MRI using Gd-EOB-DTPA would also improve the characterization of HCC in cirrhosis with regard to histopathological tumor grades was not confirmed here. We found no statistically significant associations be- tween standardized signal intensities in the arterial, ve- nous and late phases of the dynamic contrast-enhanced series and the histopathologic tumor grade. This disap- pointing outcome might also in part be due to the fact that HCC is a heterogeneous group with mixed types and overlap between the different histological grades, making it difficult at times to assign a tumor to a specific his- tologic grade . Based on the results presented here, the dynamic con- trast behavior of HCC might supplement preoperative MRI, providing useful diagnostic information that goes beyond the Milan criteria in evaluating candidates for liver transplant. Enhancement patterns might provide clues about the malig na nt poten tial and th e progno sis that cannot be derived from merely evaluating the morphol- ogic imaging appearance of HCC. It might also be specu- lated that our results on the potential role of con-trast enhancement also apply to other, nonspecific contrast agents. Imaging detection of HCC in cirrhosis has been invest- tigated in many studies [1,15-20]. Schneider et al. and Hentrich et al. demonstrated the significance of con- trast-enhanced dynamic MRI using the hepatobiliary contrast agent Gd-BOPTA (Multi-Hance®) for the de- tection and differentiation of benign and malignant he- patic lesions [21]. Hentrich et al. showed that late en- hancement is related to cellular differentiation with mod- erately differentiated HCC exhibiting significantly stronger uptake of contrast medium than poorly differentiated HCC. Horigome et al. compared MRI including dynamic contrast-enhanced imaging using Gd-DTPA (Magne- vist®) with the histopathologic grades of tumor different- tiation and showed that detection by MRI improves with poorer differentiation and larger tumor size [22]. Jonas et al. investigating patients who received a liver transplant for HCC identified DNA ploidy as a valuable prognostic factor that is superior to tumor stage and other prognostic factors. In this study of patients who received a liver transplant because of HCC, aneuploidy indicated a poor- er prognosis compared with diploid or polyploid HCCs [23]. In a univariate analysis, the same study group also identified the cytometric DNA index as a prognostic pa- rameter in liver transplant recipients after HCC in cirrho- sis in addition to the Milan criteria, the histopathologic tumor grade, vascular invasion, and the cytometric DNA index. A multivariate analysis identified the DNA index and vascular invasion as prognostic parameters [10]. The Milan criteria, which are used as a basis for se- lecting patients with HCC in cirrhosis for liver trans- plantation, take into account the number and size of le- sions. In addition, information on differentiation and ma- lignancy of an HCC would be also useful. Liver trans- plant recipients meeting the Milan criteria have a mean 5-year survival rate of 62% to 70% when the degree of differentiation of HCC is not taken into account. Patients not meeting these criteria have poorer survival rates. Several histopathologic studies of explanted livers re- vealed microvascular tumor invasion as an independent negative predictor of survival after liver transplan t. These studies also showed a significantly higher incidence of microvascular invasion with increasing tumor size [11,24,25]. The risk of microvascular invasion is greater than 50% for patients with HCC > 5 cm. Other factors, apart from the Milan criteria, that have been found to influence survival are the histopathologic tumor grade, vascular invasion, and DNA cytometry (DNA ploidy, DNA index) [10,11,23,25]. The signify- cant association we found between the arterial-venous asymmetry coefficient, i.e., the ratio of contrast enhance- ment in the arterial phase to that in the venous phase, and the DNA index suggests that a dynamic MRI study of the liver using the hepatocellular contrast agent Gd-EOB- DTPA provides information on malignancy or the bio- logical aggressiveness of HCC. Used in patients with HCC in cirrhosis, this asymmetry coefficient might pro- vide supplementary information for selecting the sur- gical procedure (extent of resection/liver transplant) or serve as a progno s tic factor. Additional studies—ideally in larger patient popula- tions—are needed to confirm our findings. The Milan criteria might then be supplemented by the preopera- tively determined MRI criterion of the asymmetry coef- ficient describing the ratio of arterial enhancement to venous washout following administration of a hepato- cytic contrast agent. 7. Summary Our study investigating signal intensities and asymmetry coefficients determined from preoperative MR images obtained using the hepatocellular contrast agent Gd- EOB-DTPA in patients with hepatocellular carcinoma and cirrhosis revealed a statistically significant relation- Copyright © 2013 SciRes. AMI 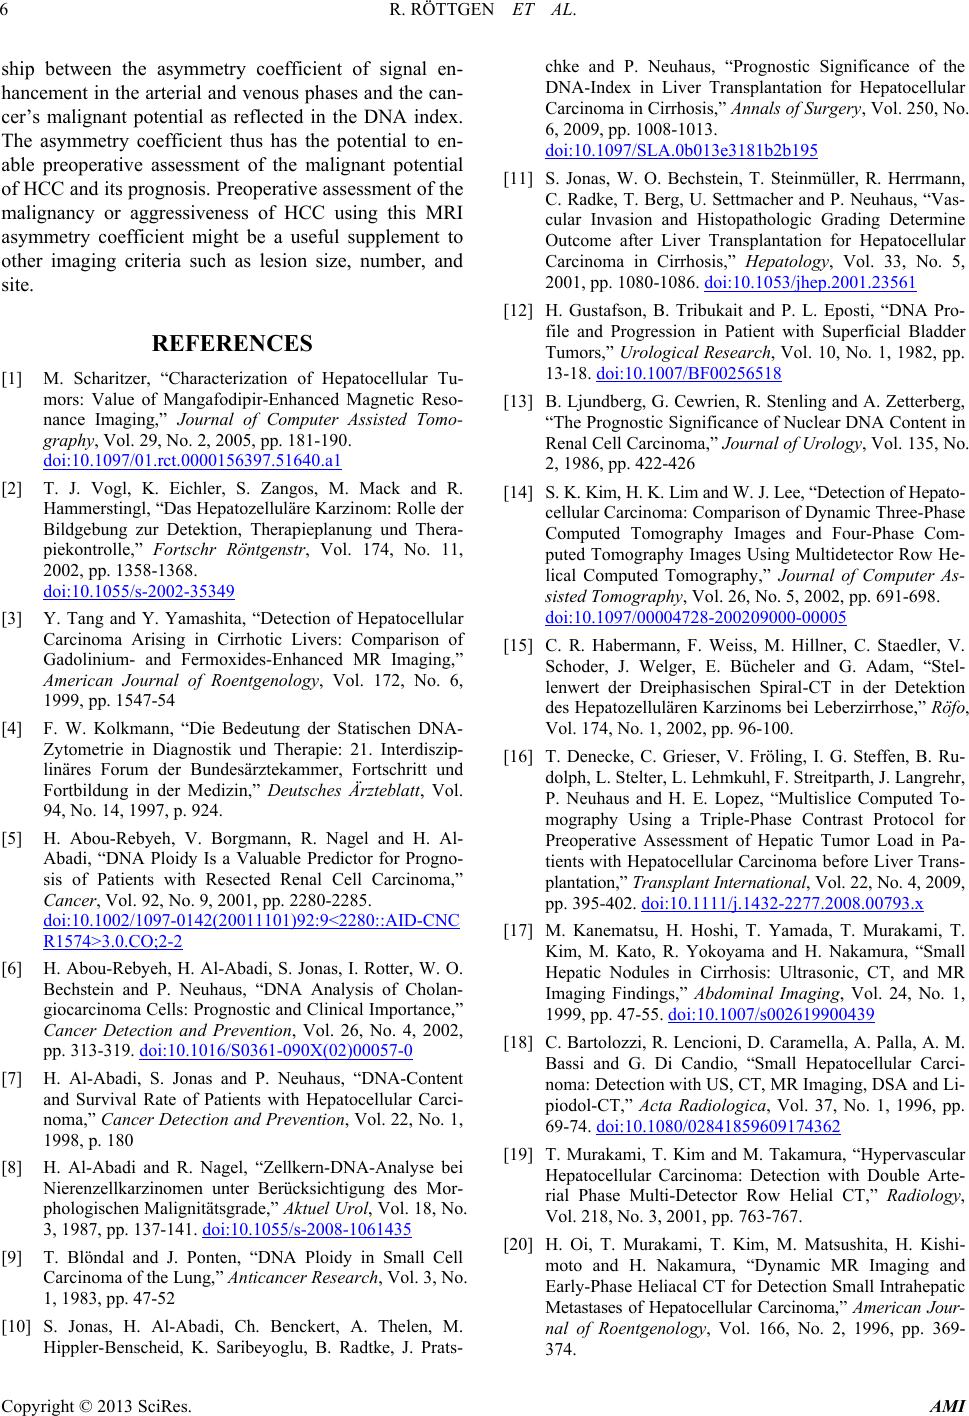 R. RÖTTGEN ET AL. 6 ship between the asymmetry coefficient of signal en- hancement in the arterial and venous phases and the can- cer’s malignant potential as reflected in the DNA index. The asymmetry coefficient thus has the potential to en- able preoperative assessment of the malignant potential of HCC and its prognosis. Preoperative assessment of the malignancy or aggressiveness of HCC using this MRI asymmetry coefficient might be a useful supplement to other imaging criteria such as lesion size, number, and site. REFERENCES [1] M. Scharitzer, “Characterization of Hepatocellular Tu- mors: Value of Mangafodipir-Enhanced Magnetic Reso- nance Imaging,” Journal of Computer Assisted Tomo- graphy, Vol. 29, No. 2, 2005, pp. 181-190. doi:10.1097/01.rct.0000156397.51640.a1 [2] T. J. Vogl, K. Eichler, S. Zangos, M. Mack and R. Hammerstingl, “Das Hepatozelluläre Karzinom: Rolle der Bildgebung zur Detektion, Therapieplanung und Thera- piekontrolle,” Fortschr Röntgenstr, Vol. 174, No. 11, 2002, pp. 1358-1368. doi:10.1055/s-2002-35349 [3] Y. Tang and Y. Yamashita, “Detection of Hepatocellular Carcinoma Arising in Cirrhotic Livers: Comparison of Gadolinium- and Fermoxides-Enhanced MR Imaging,” American Journal of Roentgenology, Vol. 172, No. 6, 1999, pp. 1547-54 [4] F. W. Kolkmann, “Die Bedeutung der Statischen DNA- Zytometrie in Diagnostik und Therapie: 21. Interdiszip- linäres Forum der Bundesärztekammer, Fortschritt und Fortbildung in der Medizin,” Deutsches Ärzteblatt, Vol. 94, No. 14, 1997, p. 924. [5] H. Abou-Rebyeh, V. Borgmann, R. Nagel and H. Al- Abadi, “DNA Ploidy Is a Valuable Predictor for Progno- sis of Patients with Resected Renal Cell Carcinoma,” Cancer, Vol. 92, No. 9, 2001, pp. 2280-2285. doi:10.1002/1097-0142(20011101)92:9<2280::AID-CNC R1574>3.0.CO;2-2 [6] H. Abou-Rebyeh, H. Al-Abadi, S. Jonas, I. Rotter, W. O. Bechstein and P. Neuhaus, “DNA Analysis of Cholan- giocarcinoma Cells: Prognostic and Clinical Importance,” Cancer Detection and Prevention, Vol. 26, No. 4, 2002, pp. 313-319. doi:10.1016/S0361-090X(02)00057-0 [7] H. Al-Abadi, S. Jonas and P. Neuhaus, “DNA-Content and Survival Rate of Patients with Hepatocellular Carci- noma,” Cancer Detection and Prevention, Vol. 22, No. 1, 1998, p. 180 [8] H. Al-Abadi and R. Nagel, “Zellkern-DNA-Analyse bei Nierenzellkarzinomen unter Berücksichtigung des Mor- phologischen Malignitätsgrade,” Aktuel Urol, Vol. 18, No. 3, 1987, pp. 137-141. doi:10.1055/s-2008-1061435 [9] T. Blöndal and J. Ponten, “DNA Ploidy in Small Cell Carcinoma of the Lung,” Anticancer Research, Vol. 3, No. 1, 1983, pp. 47-52 [10] S. Jonas, H. Al-Abadi, Ch. Benckert, A. Thelen, M. Hippler-Benscheid, K. Saribeyoglu, B. Radtke, J. Prats- chke and P. Neuhaus, “Prognostic Significance of the DNA-Index in Liver Transplantation for Hepatocellular Carcinoma in Cirrhosis,” Annals of Surgery, Vol. 250, No. 6, 2009, pp. 1008-1013. doi:10.1097/SLA.0b013e3181b2b195 [11] S. Jonas, W. O. Bechstein, T. Steinmüller, R. Herrmann, C. Radke, T. Berg, U. Settmacher and P. Neuhaus, “Vas- cular Invasion and Histopathologic Grading Determine Outcome after Liver Transplantation for Hepatocellular Carcinoma in Cirrhosis,” Hepatology, Vol. 33, No. 5, 2001, pp. 1080-1086. doi:10.1053/jhep.2001.23561 [12] H. Gustafson, B. Tribukait and P. L. Eposti, “DNA Pro- file and Progression in Patient with Superficial Bladder Tumors,” Urological Research, Vol. 10, No. 1, 1982, pp. 13-18. doi:10.1007/BF00256518 [13] B. Ljundberg, G. Cewrien, R. Stenling and A. Zetterberg, “The Prognostic Significance of Nuclear DNA Content in Renal Cell Carc inoma, ” Journal of Urology, Vol. 135, No. 2, 1986, pp. 422-426 [14] S. K. Kim, H. K. Lim and W. J. Lee, “Detection of Hepato- cellular Carcinoma: Comparison of Dynamic Three-Phase Computed Tomography Images and Four-Phase Com- puted Tomography Images Using Multidetector Row He- lical Computed Tomography,” Journal of Computer As- sisted Tomography, Vol. 26, No. 5, 2002, pp. 691-698. doi:10.1097/00004728-200209000-00005 [15] C. R. Habermann, F. Weiss, M. Hillner, C. Staedler, V. Schoder, J. Welger, E. Bücheler and G. Adam, “Stel- lenwert der Dreiphasischen Spiral-CT in der Detektion des Hepatozellulären Karzinoms bei Leberzirrhose,” Röfo, Vol. 174, No. 1, 2002, pp. 96-100. [16] T. Denecke, C. Grieser, V. Fröling, I. G. Steffen, B. Ru- dolph, L. Stelter, L. Lehmkuhl, F. Streitparth, J. Langrehr, P. Neuhaus and H. E. Lopez, “Multislice Computed To- mography Using a Triple-Phase Contrast Protocol for Preoperative Assessment of Hepatic Tumor Load in Pa- tients with Hepatocellular Carcinoma before Liver Trans- plantation,” Tran splant I nternatio nal, Vol. 22, No. 4, 2009, pp. 395-402. doi:10.1111/j.1432-2277.2008.00793.x [17] M. Kanematsu, H. Hoshi, T. Yamada, T. Murakami, T. Kim, M. Kato, R. Yokoyama and H. Nakamura, “Small Hepatic Nodules in Cirrhosis: Ultrasonic, CT, and MR Imaging Findings,” Abdominal Imaging, Vol. 24, No. 1, 1999, pp. 47-55. doi:10.1007/s002619900439 [18] C. Bartolozzi, R. Lencioni, D. Caramella, A. Palla, A. M. Bassi and G. Di Candio, “Small Hepatocellular Carci- noma: Detection with US, CT, MR Imaging, DSA and Li- piodol-CT,” Acta Radiologica, Vol. 37, No. 1, 1996, pp. 69-74. doi:10.1080/02841859609174362 [19] T. Murakami, T. Kim and M. Takamura, “Hypervascular Hepatocellular Carcinoma: Detection with Double Arte- rial Phase Multi-Detector Row Helial CT,” Radiology, Vol. 218, No. 3, 2001, pp. 763-767. [20] H. Oi, T. Murakami, T. Kim, M. Matsushita, H. Kishi- moto and H. Nakamura, “Dynamic MR Imaging and Early-Phase Heliacal CT for Detection Small Intrahepatic Metastases of Hepatocellular Carcinoma,” American Jour- nal of Roentgenology, Vol. 166, No. 2, 1996, pp. 369- 374. Copyright © 2013 SciRes. AMI  R. RÖTTGEN ET AL. Copyright © 2013 SciRes. AMI 7 [21] H. R. Hentrich, L. Marti-Bonmati, A. Vanzulli, M. A. Kirchin, G. Piorovano, A. Spinazzi and K. P. Lodemann, “Charakterisierung Fokaler Leberläsionen: Wertigkeit von Multi-Hance (Gd-BOPTA) in der Kontrast verstärkten MR- Bildgebung,” Vortrag auf dem Deutschen Röntgenkon- gress, Wiesbaden, 2000. [22] H. Horigome, T. Nomura, K. Saso, M. Itoh, T. Joh and H. Ohara, “Limitation of Imaging Diagnosis for Small Hepa- tocellular Carcinoma: Comparison with Histological Find- ings,” Journal of Gastroenterology and Hepatology, Vol. 14, No. 6, 1999, pp. 559-565. doi:10.1046/j.1440-1746.1999.01915.x [23] S. Jonas, T. Steinmüller, U. Settmacher, J. Langrehr, A. Müller and P. Neuhaus, “Liver Transplantation for Re- current Hepatocellular Carcinoma in Europe,” Journal of Hepato-Biliary-Pancreatic Surgery, Vol. 8, No. 5, 2001, pp. 422-426. doi:10.1007/s005340100004 [24] V. Mazzaferro, E. Regalia and R. Doci, “Liver Trans- plantation for the Treatment of Small Hepatocellular Car- cinomas in Patients with Cirrhosis,” The New England Journal of Medicine, Vol. 334, No. 11, 1996, pp. 693-699. doi:10.1056/NEJM199603143341104 [25] C. Benckert, S. Jonas, A. Thelen, A. Spinelli, G. Schu- macher, M. Heise, J. Langrehr and P. Neuhaus, “Liver Transplantation for Hepatocellular Carcinoma in Cirrho- sis: Prognostic Parameters,” Transplantation Proceedings, Vol. 37, No. 4, 2005, pp. 1693-1694. doi:10.1016/j.transproceed.2005.03.143 |