

Paper Menu >>
Journal Menu >>
 Social Networking, 2013, 2, 32-41 http://dx.doi.org/10.4236/sn.2013.21004 Published Online January 2013 (http://www.scirp.org/journal/sn) Dyad and Triad Census Analysis of Crisis Communication Network Shahadat Uddin*, Liaquat Hossain The University of Sydney, Sydney, Australia Email: *[email protected] Received November 11, 2012; revised December 12, 2012; accepted January 11, 2012 ABSTRACT Dyad and triad census summarize much of the network-level structural information of a given directed network. They have been found very useful in analyzing structural properties of social networks. This study aims to explore crisis communication network by following dyad and triad census analysis approach to investigate the association of mi- cro-level communication patterns with organizational crisis. This study further tests hypothesis related to the process of data generation and tendency of the structural pattern of transitivity using dyad and triad census output. The changing communication network at Enron Corporation during the period of its crisis is analyzed in this study. Significant dif- ferences in the presence of different isomorphism classes or micro-level patterns of both dyad and triad census are no- ticed in crisis and non-crisis period network of Enron email corpus. It is also noticed that crisis communication network shows more transitivity compared to the non-crisis communication network. Keywords: Dyad Census; Triad Census; Crisis Communication Network; Organizational Crisis 1. Introduction Communication networks are represented as patterns of contacts which are created due to the flow of messages among participating actors or communicators through time and space. The word “message” encompasses eve- rything (e.g. data, information, knowledge, image and symbol) that can be co-created by network members and that can flow from one point of contact to another within and between networks. In contemporary organizations, a communication network could take various forms such as personal contact network, work related contact network, strategic alliances among various firms, global network of organizations, and flow of information within and between groups [1]. By applying dyad and triad census analysis approach this study explores the changing micro-level structure in order to investigate patterns associated with the final stage of a crisis communication network. The dyad cen- sus seeks the tendency of reciprocity of relations within a communication network. Frequencies of different micro- level patterns are examined in triad census analysis. Both dyad and triad census analysis have gained noticeable popularity in recent social network research [2,3]. Crisis communication network of an organization is the context of this study. A crisis communication net- work can be defined as the network that has been evol- ved among actors (e.g. staff) during an organizational crisis period. Organizational crisis has been defined in many ways by many different researchers such as organi- zational mortality, organizational death, organizational exit, bankruptcy, decline, retrenchment and failure to characterize various forms of organizational needs [4]. Although there is limited consensus among researchers on the precise definition of organizational crisis, there is evidence of shared meaning. Hermann [5] defined crisis as a situation that threatens goals of an organization, sur- prises the decision makers by its occurrences, put them under time pressure for appropriate responses and con- sequently engender high level of stress. Milburn et al. [6] identified several important elements of an organiza- tional crisis such as: organizational crisis produces indi- vidual crisis; crisis can be associated with positive or negative condition; crises can be situations having been precipitated quickly or suddenly or situations that have developed over time; and crises are predictable. Weitzel and Johnson [7] defined organizational crisis as a state in which firms fail to anticipate, recognize, avoid, neutral- ize, or adapt to external or internal pressures that threaten the organization’s long term survival. Sheppard [8] de- fined crisis as “a critical and irreversible loss by the sys- tem” and posited that an organization dies when it stops performing its expected functions. A drastic form of criti- cal loss occurs when firms moves into bankruptcy as in the case of Enron Corporation in the final quarter of 2001. This study starts with the premise that email networks *Corresponding author. C opyright © 2013 SciRes. SN 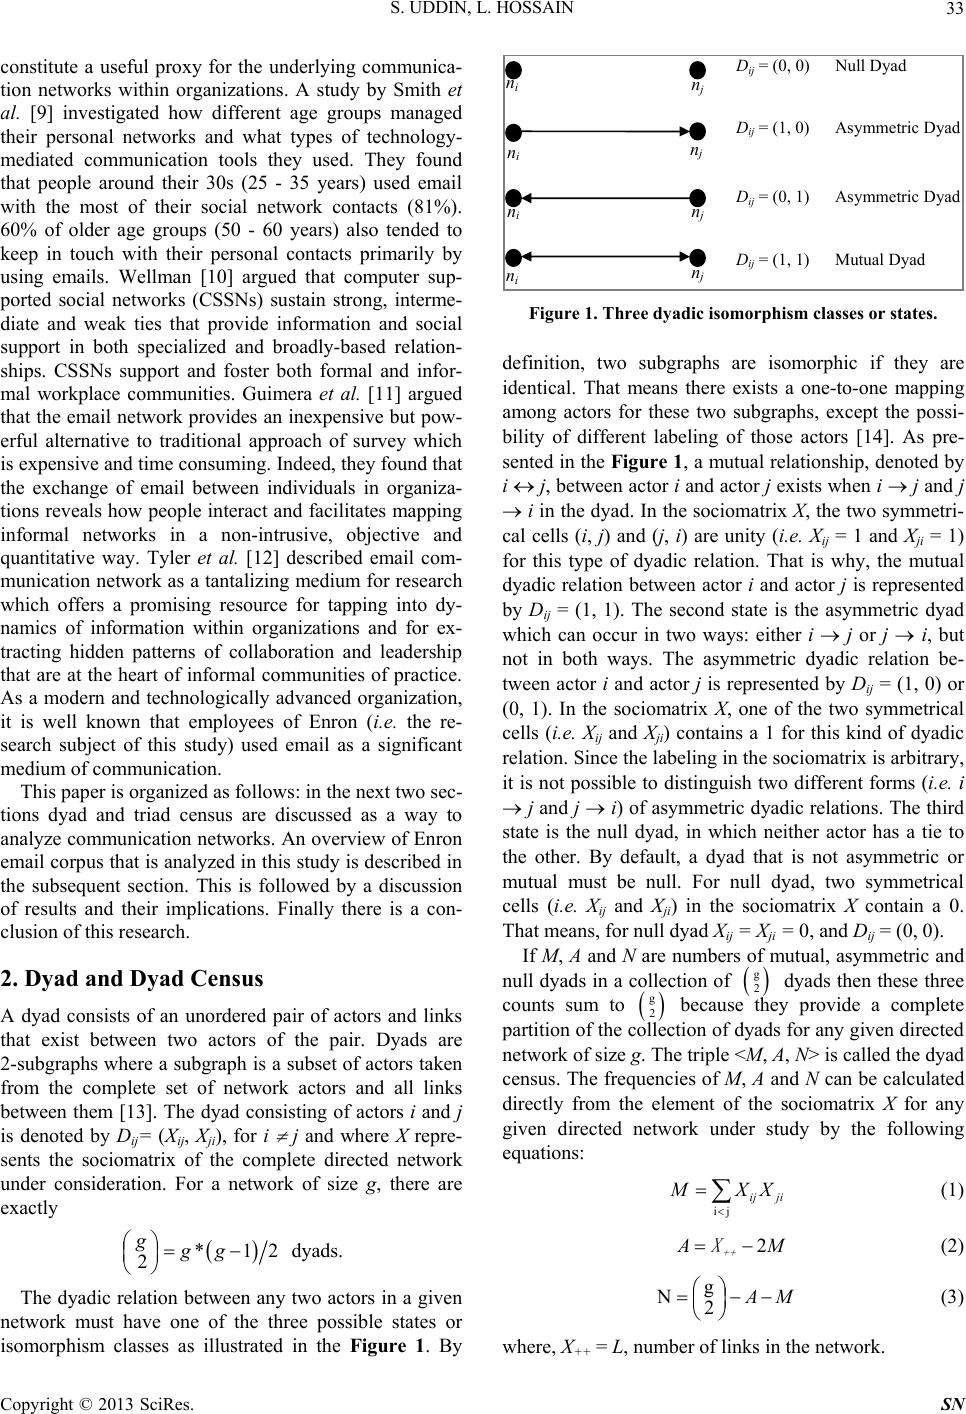 S. UDDIN, L. HOSSAIN 33 constitute a useful proxy for the underlying communica- tion networks within organizations. A study by Smith et al. [9] investigated how different age groups managed their personal networks and what types of technology- mediated communication tools they used. They found that people around their 30s (25 - 35 years) used email with the most of their social network contacts (81%). 60% of older age groups (50 - 60 years) also tended to keep in touch with their personal contacts primarily by using emails. Wellman [10] argued that computer sup- ported social networks (CSSNs) sustain strong, interme- diate and weak ties that provide information and social support in both specialized and broadly-based relation- ships. CSSNs support and foster both formal and infor- mal workplace communities. Guimera et al. [11] argued that the email network provides an inexpensive but pow- erful alternative to traditional approach of survey which is expensive and time consuming. Indeed, they found that the exchange of email between individuals in organiza- tions reveals how people interact and facilitates mapping informal networks in a non-intrusive, objective and quantitative way. Tyler et al. [12] described email com- munication network as a tantalizing medium for research which offers a promising resource for tapping into dy- namics of information within organizations and for ex- tracting hidden patterns of collaboration and leadership that are at the heart of informal communities of practice. As a modern and technologically advanced organization, it is well known that employees of Enron (i.e. the re- search subject of this study) used email as a significant medium of communication. This paper is organized as follows: in the next two sec- tions dyad and triad census are discussed as a way to analyze communication networks. An overview of Enron email corpus that is analyzed in this study is described in the subsequent section. This is followed by a discussion of results and their implications. Finally there is a con- clusion of this research. 2. Dyad and Dyad Census A dyad consists of an unordered pair of actors and links that exist between two actors of the pair. Dyads are 2-subgraphs where a subgraph is a subset of actors taken from the complete set of network actors and all links between them [13]. The dyad consisting of actors i and j is denoted by Dij= (Xij, Xji), for i j and where X repre- sents the sociomatrix of the complete directed network under consideration. For a network of size g, there are exactly *1 2 ggg 2 dyads. The dyadic relation between any two actors in a given network must have one of the three possible states or isomorphism classes as illustrated in the Figure 1. By D ij = (0, 0) Null Dyad D ij = (0, 1) Asymmetric Dyad D ij = (1, 0) Asymmetric Dyad D ij = (1, 1) Mutual Dyad n i n i n i n i n j n j n j n j Figure 1. Three dyadic isomorphism classes or states. definition, two subgraphs are isomorphic if they are identical. That means there exists a one-to-one mapping among actors for these two subgraphs, except the possi- bility of different labeling of those actors [14]. As pre- sented in the Figure 1, a mutual relationship, denoted by i j, between actor i and actor j exists when i j and j i in the dyad. In the sociomatrix X, the two symmetri- cal cells (i, j) and (j, i) are unity (i.e. Xij = 1 and Xji = 1) for this type of dyadic relation. That is why, the mutual dyadic relation between actor i and actor j is represented by Dij = (1, 1). The second state is the asymmetric dyad which can occur in two ways: either i j or j i, but not in both ways. The asymmetric dyadic relation be- tween actor i and actor j is represented by Dij = (1, 0) or (0, 1). In the sociomatrix X, one of the two symmetrical cells (i.e. Xij and Xji) contains a 1 for this kind of dyadic relation. Since the labeling in the sociomatrix is arbitrary, it is not possible to distinguish two different forms (i.e. i j and j i) of asymmetric dyadic relations. The third state is the null dyad, in which neither actor has a tie to the other. By default, a dyad that is not asymmetric or mutual must be null. For null dyad, two symmetrical cells (i.e. Xij and Xji) in the sociomatrix X contain a 0. That means, for null dyad Xij = Xji = 0, and Dij = (0, 0). If M, A and N are numbers of mutual, asymmetric and null dyads in a collection of g 2 dyads then these three counts sum to g 2 because they provide a complete partition of the collection of dyads for any given directed network of size g. The triple <M, A, N> is called the dyad census. The frequencies of M, A and N can be calculated directly from the element of the sociomatrix X for any given directed network under study by the following equations: ij ij ji M XX (1) 2 A M ++ X (2) g N2 A M (3) where, X++ = L, number of links in the network. Copyright © 2013 SciRes. SN  S. UDDIN, L. HOSSAIN 34 2.1. Katz and Powell Index for Mutuality In order to measure the tendency for actors in a group to reciprocate choices more frequently than it would occur simply by chance, Katz and Powell [15] proposed an index which was named according to their names—Katz and Powell Index for Mutuality (kp). Like other statisti- cal indices, this index is dimensionless and has the range of − < kp 1; where 0 indicates no tendency for re- ciprocation, 1 represents maximal tendency for recipro- cation, negative values indicate tendencies toward asym- metric and null dyads. Based on the assumption that choices are made by ac- tors in some random manner, Kat and Powell [15] nor- malize this index for two particular network data collec- tion designs: fixed choice and free choice. While no re- striction is placed on the number of actors each actor can relate to in a free choice design, the investigator gathers data or instructs each respondent to name a fixed number of others that the actor relates to on the relation under study in a fixed choice design. For a fixed choice design, if d is the fixed number of choices made by each of the g actors then kp can be estimated by the following equa- tion [15]: 2 21 ˆ1 kp g Mgd gd gd (4) In free choice designs, choices made by different ac- tors are not necessarily equal. Katz and Powell [15] de- rived the following equation to estimate kp in a free choice design: 22 2 22 2 21 ˆ 1 kp g ML L LgL L (5) where, i is the total number of choices, and i is the sum of squares of the choices. And, xi+ represents the number of choices made by the ith ac- tor. Lx 2 x 2 L 3. Triad and Triad Census A triad or 3-subgraph is a set of three actors ni, nj and nk where i j k [14]. While a triad could be without any tie between its three constituent actors, there could be links between the three actors of a triad. There are ex- actly gg*g1 *g26 3 triads for a network of size g. As three actors constitute a triad and each actor can relate to other two actors, there are six possible ties or links between actors. In the mathematical presentation of a triad, each of these six arcs can be present or absent. Thus, there are 26 = 64 realizations or possible states for a triad if node labels are considered. However, some of these 64 states are isomorphic or structurally indistin- guishable if node labels are ignored. There are sixteen isomorphism classes for the 64 different triad states [16], which are pictured in Figure 2. The triad census consists of these sixteen isomorphism categories. Like dyad cen- sus, models based on triad census can be used to test the presence of configurable biases such as transitivity bias. 4. Research Dataset This study considers Enron email communication data of the year 2001 as the data for crisis communication net- work. In order to fully understand the context of this re- search, it is required to understand Enron’s organiza- tional downfall, mostly instigated by the unethical busi- ness practices of its senior management and overall or- ganizational culture. Enron was founded in 1985 through the merger of two gas pipeline companies. Within a de- cade, this organization became a global player and a symbol of innovative and progressive business conglo- merate. It also became actively involved in the area of metals, pulps and paper, broadband assets, water plants and financial markets internationally [17]. In the year 2000, Enron’s annual revenue was $101 billion which made it the seventh largest company in the United States, bigger than IBM or Sony [18]. On mysterious circum- stances, Jeff Skilling resigned as CEO on August 14, 1-003 2-012 3-102 4-021D 5-021U 6-021C 7-111D 8-111U 9-030T 10-030C 11-201 12-120D 13-120U 14-120C 15-210 16-300 Figure 2. Sixteen triad isomorphism classes. The number (i.e. 1 to 16) before the hyphen for each labeling represents the triad ID number. The characters after the hyphen fol- low standard M-A-N labeling convention: the first charac- ter gives the number of mutual dyads, the second character gives the number of asymmetric dyads, the third character gives the number of null dyads and the last character (if present) is used to distinguish further among the types of classes (“D” for down, “U” for up, “T” for transitive and “C” for cycle). Copyright © 2013 SciRes. SN  S. UDDIN, L. HOSSAIN 35 2001 and was replaced by Kenneth Lay, the founder. During the same month, it became slowly evident that, with the help of Arthur Andersen (Enron’s auditor since 1985), Enron had been grossly overstating its profits and understating debts for the previous 5 years. On October 16, 2001, Enron disclosed that it had lost $618 million in the third quarter earnings. On December 2, 2001, Enron filed for chapter 11 bankruptcy protection in a New York Bankruptcy court. With $62 billion in assets, this was the largest bankruptcy in the history of the US up to that time. By January 2002, Enron stock lost 99% of its value. Stockholders lost tens of billions of dollars and many of the company’s 20,000 employees lost their retirement saving pensions and jobs [17-19]. Since filing for bank- ruptcy on December 2, 2001, the Justice Department conducted an ongoing criminal investigation into the fall of Enron. This investigation had been resulted in a num- ber of criminal charges including fraud, conspiracy and insider trading being filed against several top executives. In May 2002, the US Federal Energy Regulatory Commission (FERC) publicly released a large set of email messages, the Enron corpus. The corpus contains 619,446 email messages belonging to 158 users over a period of 3.5 years. Shetty and Adibi [20] of University of Southern California created a MySQL database of this corpus. They also cleaned the database by removing a large number of duplicate emails, computer generated folders, junk data, invalid email addresses and blank messages. The resulting dataset contains 252,759 mes- sages from 151 employees distributed in and around 3000 user defined folders. In this study, this database is utilized to perform required data experiment. In the area of organizational science and social network research, the Enron corpus is of great value because it allows aca- demics to conduct research on real-life organization over a number of years. Even though Enron email corpus has the email com- munication data prior to and after the year 2001, this study considers data only for the year 2001 since Enron’s organizational crisis was at its peak during this period which resulted in the bankruptcy declaration during the first week of December 2001. UCINET [21] and Pajek software were used for triad census analysis; whereas, for dyad census analysis (i.e. Katz and Powell Index) vari- ables of Equation (5) are first measured in Microsoft Ex- cel. After that, kp is calculated from these variables. 5. Result This section presents results of dyad and triad census analysis of the crisis communication network of Enron. These results highlight the presence of different struc- tural patterns of communication structure associated with the last stage of organizational crisis of Enron. 5.1. Dyad Census The number of dyads in the communication network for each of 52 weeks of the year 2001 is first identified. The result is presented in Figure 3. Then, values for kp of the same time period (i.e. 52 weeks of the year 2001) are compared in Fi g u r e 4. From Figures 3 and 4, it is evident that there is a sharp increase in the number of dyads and in the value of kp as the Enron’s crisis communication network moves to- wards the peak crisis period. Although the trend is not monotonically increasing, the dramatic increase in dyads and kp during September, October and November of 2001 are significant. 5.1.1. Testing for the Distribution of Data Generation Dyadic statistics are used to test hypothesis related to the process of data generation for weekly networks under study. It is assumed that weekly networks are distributed as uniform random directed graph. This assumption im- plies that elements of the sociomatrix X for each weekly network are independent and have a constant probability of 0.5 of being unity. That is, each element of X is a Bernoulli random variable. Let, L is equal to the count of how many of these Bernoulli random variables are unity. Since, the sum of independent Bernoulli variables, with constant probability P of being unity, is a Binomial ran- dom variable with parameters equal to number of Ber- noulli random variables being summed (i.e. g (g − 1)) and Number of Dyad over Time 0 50 100 150 200 250 300 051015 20 25 30 35 4045 50 55 We e ks of the ye ar 2001 Number of Dya d Figure 3. Change of the number of dyads in 52 different weeks of the year 2001 for the crisis communication net- work of Enron. Change of Katz-Powell Index 0.00 0.05 0.10 0.15 0.20 0.25 0.30 051015 20 25 30 35 40 45 50 55 Weeks of the year 2001 KP Inde x Figure 4. Change of kp in 52 different weeks of 2001 for the crisis communication network of Enron. Copyright © 2013 SciRes. SN 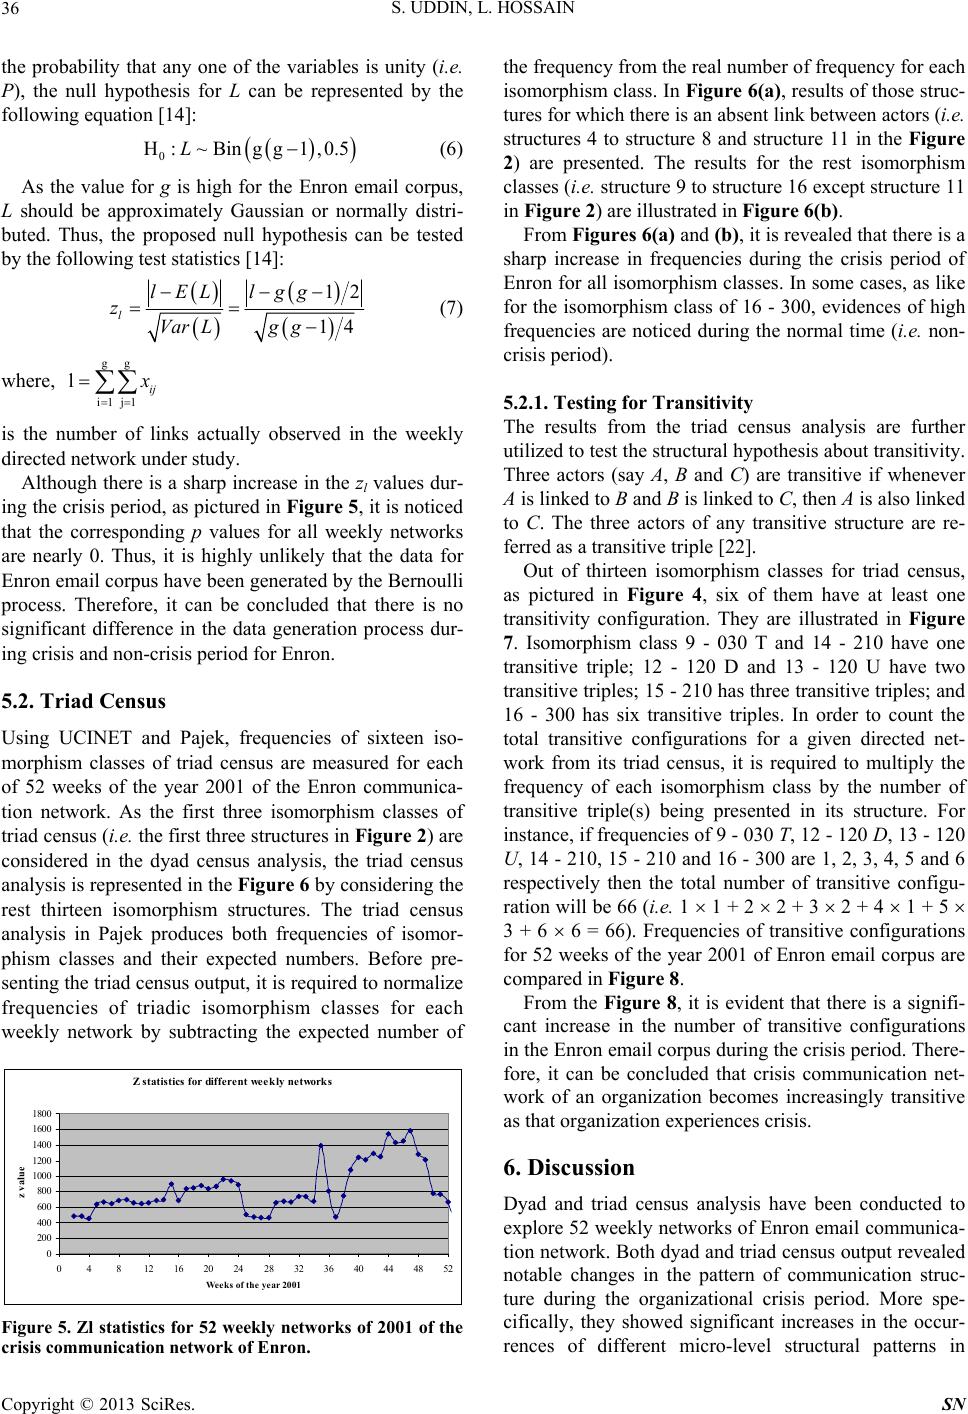 S. UDDIN, L. HOSSAIN 36 the probability that any one of the variables is unity (i.e. P), the null hypothesis for L can be represented by the following equation [14]: 0 H:~Bingg 1,0.5L (6) As the value for g is high for the Enron email corpus, L should be approximately Gaussian or normally distri- buted. Thus, the proposed null hypothesis can be tested by the following test statistics [14]: 12 14 l lELlgg zVar Lgg (7) where, gg i1j1 l ij x is the number of links actually observed in the weekly directed network under study. Although there is a sharp increase in the zl values dur- ing the crisis period, as pictured in Figure 5, it is noticed that the corresponding p values for all weekly networks are nearly 0. Thus, it is highly unlikely that the data for Enron email corpus have been generated by the Bernoulli process. Therefore, it can be concluded that there is no significant difference in the data generation process dur- ing crisis and non-crisis period for Enron. 5.2. Triad Census Using UCINET and Pajek, frequencies of sixteen iso- morphism classes of triad census are measured for each of 52 weeks of the year 2001 of the Enron communica- tion network. As the first three isomorphism classes of triad census (i.e. the first three structures in Figure 2) are considered in the dyad census analysis, the triad census analysis is represented in the Figure 6 by considering the rest thirteen isomorphism structures. The triad census analysis in Pajek produces both frequencies of isomor- phism classes and their expected numbers. Before pre- senting the triad census output, it is required to normalize frequencies of triadic isomorphism classes for each weekly network by subtracting the expected number of Z statistics for different week ly network s 0 200 400 600 800 1000 1200 1400 1600 1800 04812 16 20 2428 32 36 40 44 48 52 Weeks of the year 2001 z valu e Figure 5. Zl statistics for 52 weekly networks of 2001 of the crisis communication network of Enron. the frequency from the real number of frequency for each isomorphism class. In Figure 6(a), results of those struc- tures for which there is an absent link between actors (i.e. structures 4 to structure 8 and structure 11 in the Figure 2) are presented. The results for the rest isomorphism classes (i.e. structure 9 to structure 16 except structure 11 in Figure 2) are illustrated in Fi gu r e 6 (b). From Figures 6(a) and (b), it is revealed that there is a sharp increase in frequencies during the crisis period of Enron for all isomorphism classes. In some cases, as like for the isomorphism class of 16 - 300, evidences of high frequencies are noticed during the normal time (i.e. non- crisis period). 5.2.1. Testing for Transitivity The results from the triad census analysis are further utilized to test the structural hypothesis about transitivity. Three actors (say A, B and C) are transitive if whenever A is linked to B and B is linked to C, then A is also linked to C. The three actors of any transitive structure are re- ferred as a transitive triple [22]. Out of thirteen isomorphism classes for triad census, as pictured in Figure 4, six of them have at least one transitivity configuration. They are illustrated in Figure 7. Isomorphism class 9 - 030 T and 14 - 210 have one transitive triple; 12 - 120 D and 13 - 120 U have two transitive triples; 15 - 210 has three transitive triples; and 16 - 300 has six transitive triples. In order to count the total transitive configurations for a given directed net- work from its triad census, it is required to multiply the frequency of each isomorphism class by the number of transitive triple(s) being presented in its structure. For instance, if frequencies of 9 - 030 T, 12 - 120 D, 13 - 120 U, 14 - 210, 15 - 210 and 16 - 300 are 1, 2, 3, 4, 5 and 6 respectively then the total number of transitive configu- ration will be 66 (i.e. 1 1 + 2 2 + 3 2 + 4 1 + 5 3 + 6 6 = 66). Frequencies of transitive configurations for 52 weeks of the year 2001 of Enron email corpus are compared in Figure 8. From the Figure 8, it is evident that there is a signifi- cant increase in the number of transitive configurations in the Enron email corpus during the crisis period. There- fore, it can be concluded that crisis communication net- work of an organization becomes increasingly transitive as that organization experiences crisis. 6. Discussion Dyad and triad census analysis have been conducted to explore 52 weekly networks of Enron email communica- tion network. Both dyad and triad census output revealed notable changes in the pattern of communication struc- ture during the organizational crisis period. More spe- cifically, they showed significant increases in the occur- rences of different micro-level structural patterns in Copyright © 2013 SciRes. SN 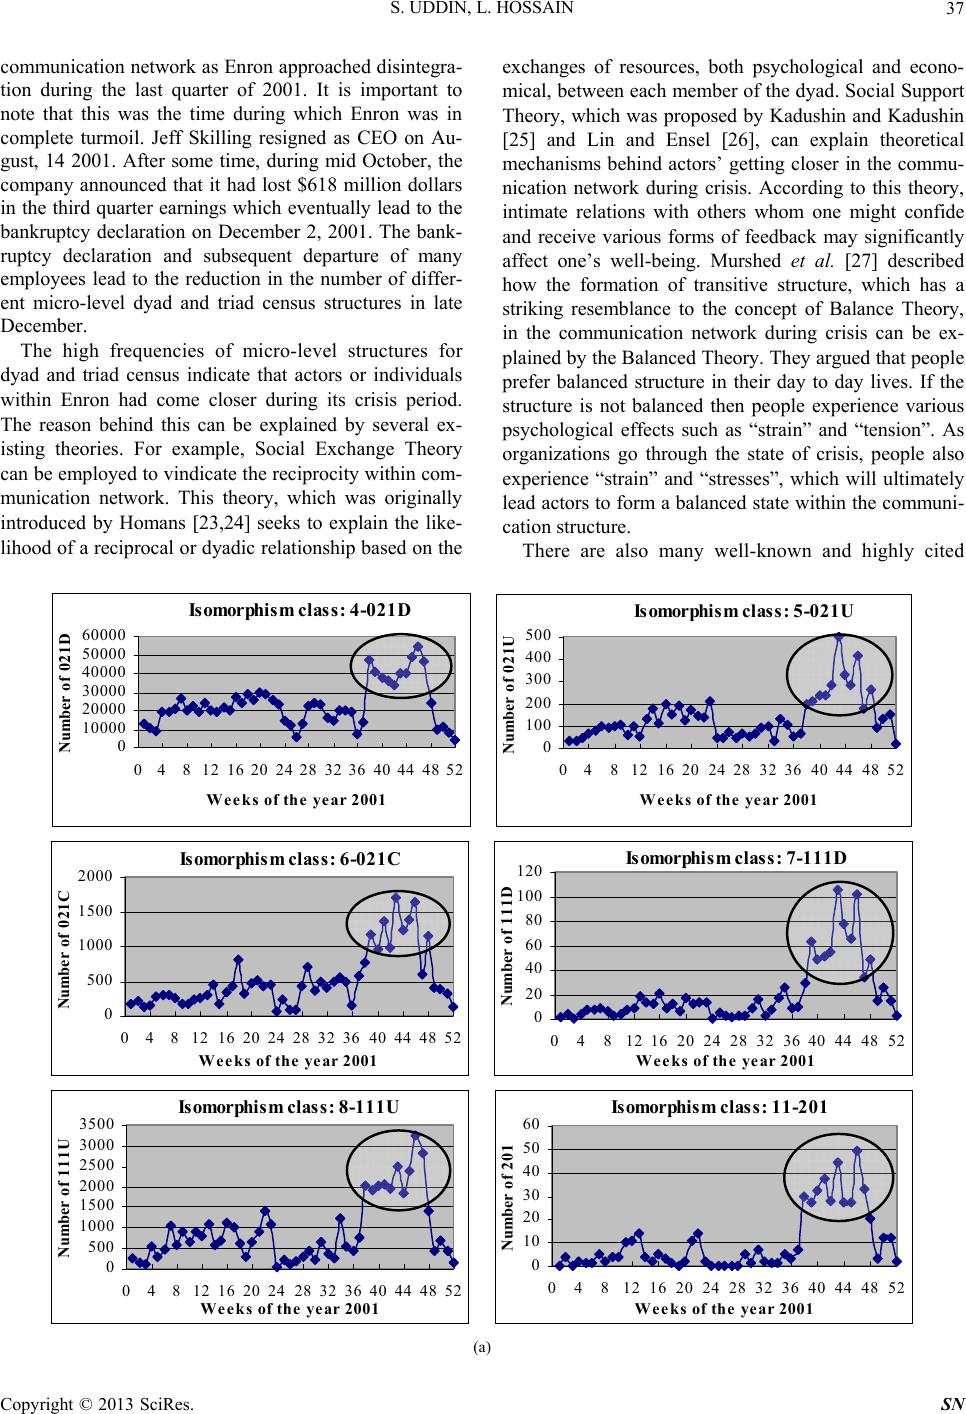 S. UDDIN, L. HOSSAIN Copyright © 2013 SciRes. SN 37 communication network as Enron approached disintegra- tion during the last quarter of 2001. It is important to note that this was the time during which Enron was in complete turmoil. Jeff Skilling resigned as CEO on Au- gust, 14 2001. After some time, during mid October, the company announced that it had lost $618 million dollars in the third quarter earnings which eventually lead to the bankruptcy declaration on December 2, 2001. The bank- ruptcy declaration and subsequent departure of many employees lead to the reduction in the number of differ- ent micro-level dyad and triad census structures in late December. exchanges of resources, both psychological and econo- mical, between each member of the dyad. Social Support Theory, which was proposed by Kadushin and Kadushin [25] and Lin and Ensel [26], can explain theoretical mechanisms behind actors’ getting closer in the commu- nication network during crisis. According to this theory, intimate relations with others whom one might confide and receive various forms of feedback may significantly affect one’s well-being. Murshed et al. [27] described how the formation of transitive structure, which has a striking resemblance to the concept of Balance Theory, in the communication network during crisis can be ex- plained by the Balanced Theory. They argued that people prefer balanced structure in their day to day lives. If the structure is not balanced then people experience various psychological effects such as “strain” and “tension”. As organizations go through the state of crisis, people also experience “strain” and “stresses”, which will ultimately lead actors to form a balanced state within the communi- cation structure. The high frequencies of micro-level structures for dyad and triad census indicate that actors or individuals within Enron had come closer during its crisis period. The reason behind this can be explained by several ex- isting theories. For example, Social Exchange Theory can be employed to vindicate the reciprocity within com- munication network. This theory, which was originally introduced by Homans [23,24] seeks to explain the like- lihood of a reciprocal or dyadic relationship based on the There are also many well-known and highly cited I somorphism class: 4-021D 0 10000 20000 30000 40000 50000 60000 048 1216202428323640444852 W ee k s of th e year 2001 Number of 021D Isomorp hism class: 5-021U 0 100 200 300 400 500 048 1216202428323640444852 Weeks of the year 2001 Number of 021U Isomorphi sm class: 6-021C 0 500 1000 1500 2000 048 1216202428323640444852 W ee ks of th e ye ar 2001 Number of 021C Isomorphism class: 7-111D 0 20 40 60 80 100 120 048 1216202428323640444852 W eeks of the ye ar 2001 Number of 111D Isomorphi sm class: 8-111U 0 500 1000 1500 2000 2500 3000 3500 04812 1620 24283236 40 4448 52 W eeks of the year 2001 Number of 111U Isomorphi sm class: 11-201 0 10 20 30 40 50 60 04812 16 20 24 28 32 36 40 44 48 52 Weeks of the year 2001 Number of 201 (a) 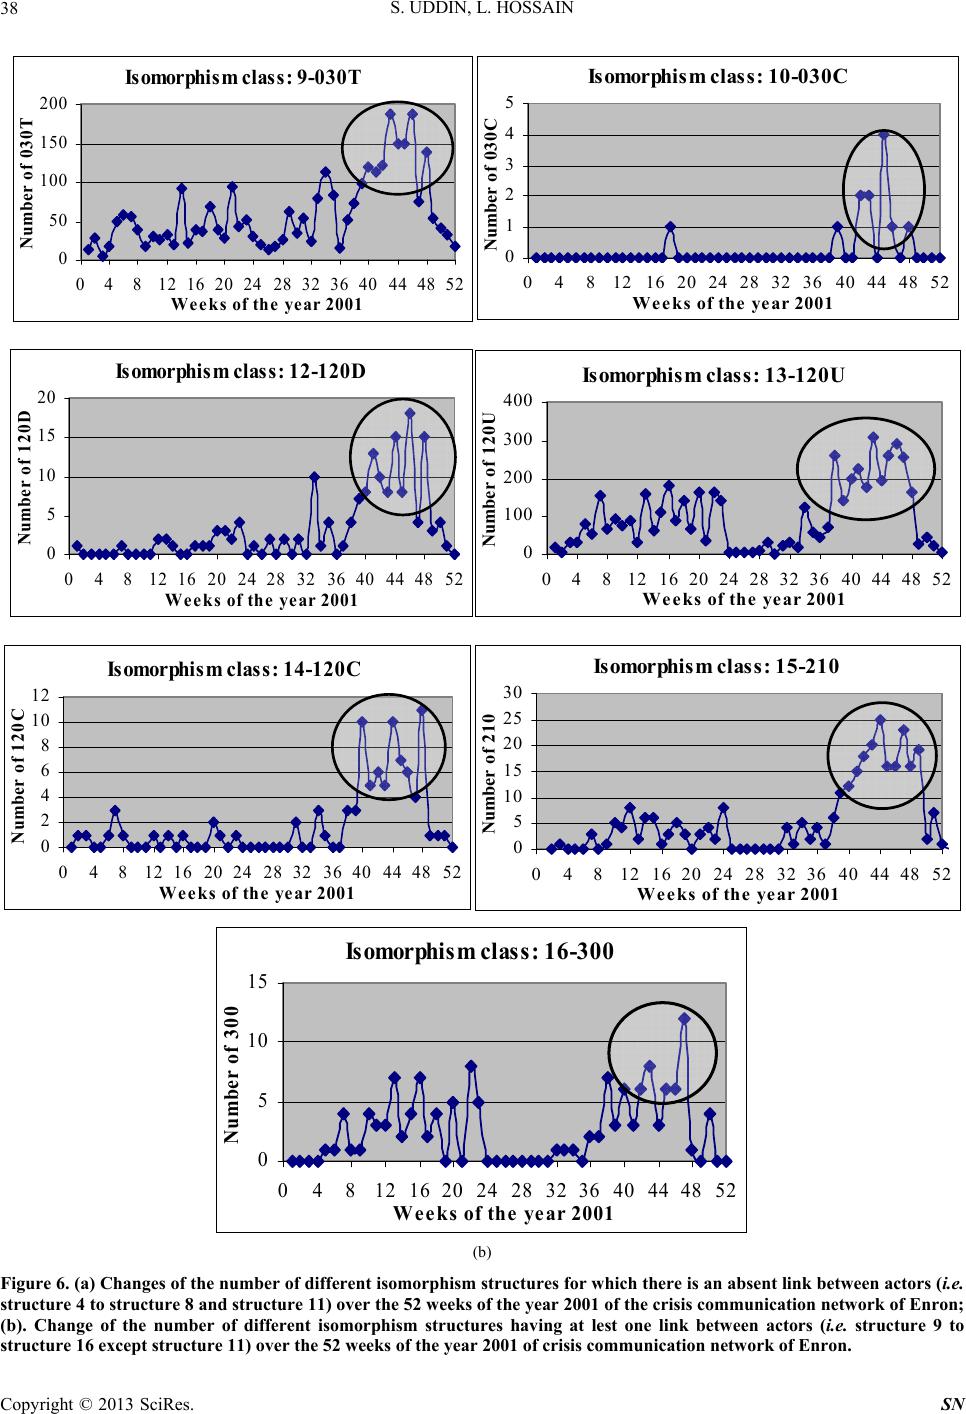 S. UDDIN, L. HOSSAIN 38 I somorp hism class: 9-030T 0 50 100 150 200 04812 16 20 2428 32 36 4044 48 52 W ee k s of the ye ar 2001 Number of 030T Isomorphism class: 10-030C 0 1 2 3 4 5 0481216 20242832 364044 48 52 W ee k s of the ye ar 2001 Number of 030C Isomor phism cl ass: 12-120D 0 5 10 15 20 048 1216202428323640444852 Weeks of th e year 2001 Number of 120D Isomor phism c l ass: 13-120U 0 100 200 300 400 048 1216202428323640444852 W ee k s of the year 2001 Number of 120U Isomorphi sm class: 14-120C 0 2 4 6 8 10 12 0481216202428323640444852 W ee k s of the ye ar 2001 Number of 120C I somorphism class: 15-210 0 5 10 15 20 25 30 048 1216202428323640444852 W ee ks of the ye ar 2001 Number of 210 I som orphism class: 16-300 0 5 10 15 0481216202428323640444852 We eks of the ye ar 2001 Number of 300 (b) Figure 6. (a) Changes of the number of different isomorphism structures for which there is an absent link between actors (i.e . structure 4 to structure 8 and structure 11) over the 52 weeks of the year 2001 of the crisis communication network of Enron; (b). Change of the number of different isomorphism structures having at lest one link between actors (i.e. structure 9 to structure 16 except structure 11) over the 52 weeks of the year 2001 of crisis communication network of Enron. Copyright © 2013 SciRes. SN 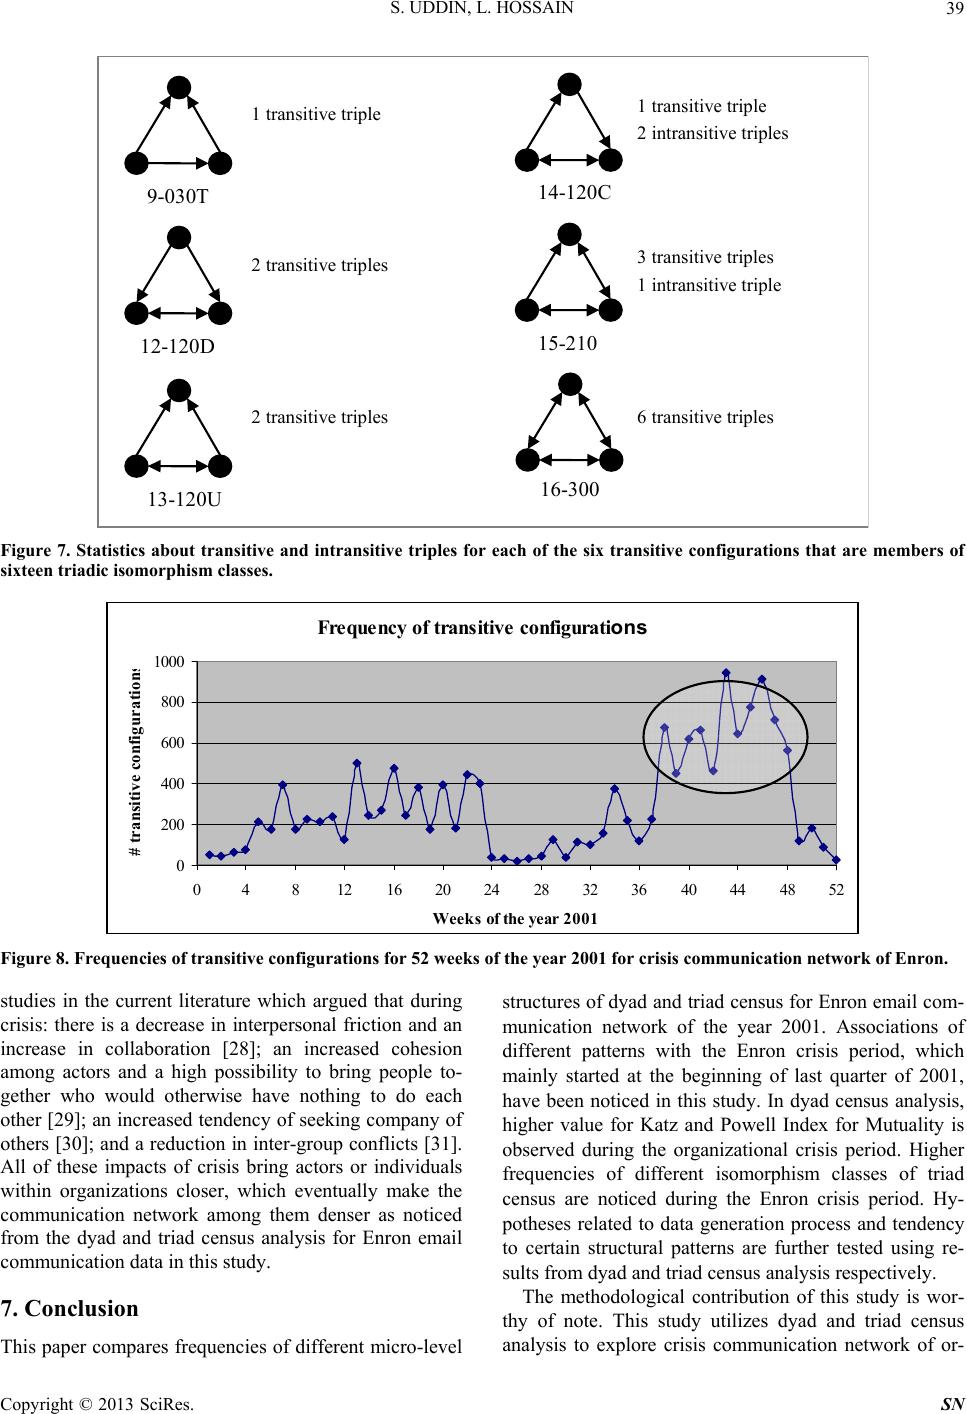 S. UDDIN, L. HOSSAIN Copyright © 2013 SciRes. SN 39 12-120D 13-120U 9-030T 14-120C 15-210 16-300 1 transitive triple 2 transitive triples 2 transitive triples 1 transitive triple 2 intransitive triples 3 transitive triples 1 intransitive triple 6 transitive triples Figure 7. Statistics about transitive and intransitive triples for each of the six transitive configurations that are members of sixteen triadic isomorphism classes. Frequency of transitive configurations 0 200 400 600 800 1000 048 1216202428323640444852 Weeks of the year 2001 # tr ansitive c onfigu r ation s Figure 8. Frequencies of transitive configurations for 52 weeks of the year 2001 for crisis communication network of Enron. studies in the current literature which argued that during crisis: there is a decrease in interpersonal friction and an increase in collaboration [28]; an increased cohesion among actors and a high possibility to bring people to- gether who would otherwise have nothing to do each other [29]; an increased tendency of seeking company of others [30]; and a reduction in inter-group conflicts [31]. All of these impacts of crisis bring actors or individuals within organizations closer, which eventually make the communication network among them denser as noticed from the dyad and triad census analysis for Enron email communication data in this study. 7. Conclusion This paper compares frequencies of different micro-level structures of dyad and triad census for Enron email com- munication network of the year 2001. Associations of different patterns with the Enron crisis period, which mainly started at the beginning of last quarter of 2001, have been noticed in this study. In dyad census analysis, higher value for Katz and Powell Index for Mutuality is observed during the organizational crisis period. Higher frequencies of different isomorphism classes of triad census are noticed during the Enron crisis period. Hy- potheses related to data generation process and tendency to certain structural patterns are further tested using re- sults from dyad and triad census analysis respectively. The methodological contribution of this study is wor- thy of note. This study utilizes dyad and triad census analysis to explore crisis communication network of or-  S. UDDIN, L. HOSSAIN 40 ganizations. With the increasing popularity of email as an interaction medium and increased popularity of social network analysis methods and tools, it is expected that a deeper understanding of the various social and organiza- tional phenomena using further concepts of dyad and triad census analysis such as subgraph analysis, distribu- tion analysis and stability analysis could be developed. Unlike studies that explored structural behaviors such as power-law behavior [32] and longitudinal topology of network dynamics [33,34], this study explores the pre- sence of different micro-structures of dyad and triad cen- sus analysis for a crisis communication network. REFERENCES [1] P. Monge and N. Contractor, “Theories of Communica- tion Networks,” Oxford University Press, New York, 2003. [2] M. Rustin, “Structural and Unconscious Implications of the Dyad and Triad: An Essay in Theoretical Integration; Durkheim, Simmel, Freud,” The Sociological Review, Vol. 19, No. 2, 2011, pp. 179-201. doi:10.1111/j.1467-954X.1971.tb00626.x [3] S. Fukuzumi, K. Ohkubo, J. Ortiz, A. M. Gutierrez, F. Fernandez-Lazaro and A. Sastre-Santos, “Control of Pho- toinduced Electron Transfer in Zinc Phthalocyanine— Perylenediimide Dyad and Triad by the Magnesium Ion,” The Journal of Physical Chemistry A, Vol. 112, No. 43, 2008, pp. 10744-10752. doi:10.1021/jp805464e [4] K. Mellahi and A. Wilkinson, “Organizational Failure: A Critique of Recent Research and a Proposed Integrative Framework,” International Journal of Management Re- views, Vol. 5, No. 1, 2004, pp. 21-41. doi:10.1111/j.1460-8545.2004.00095.x [5] C. Hermann, “Some Consequences of Crisis Which Limit the Viability of Organizations,” Administrative Science Quarterly, Vol. 8, No. 1, 1963, pp. 61-82. doi:10.2307/2390887 [6] T. Milburn, R. Schuler and K. Watman, “Organizational Crisis,” Part I: Definition and Conceptualization. Human Relations, Vol. 36, No. 12, 1983, pp. 1141-1160. doi:10.1177/001872678303601205 [7] W. Weitzel and E. Jonsson, “Decline in Organizations: A Literature Integration and Extension,” Administrative Sci- ence Quarterly, Vol. 34, No. 1, 1989, pp. 91-109. doi:10.2307/2392987 [8] J. Sheppard, “Strategy and Bankruptcy: An Exploration into Organizational Death,” Journal of Management, Vol. 20, No. 4, 1994, pp. 795-833. [9] H. Smith, Y. Rogers and M. Brady, “Managing One’s Social Network: Does Age Make a Difference,” Hu- man-Computer Interaction-INTERACT, Zurich, 2003, pp. 551-558. [10] B. Wellman, “For a Social Network Analysis of Com- puter Networks: A Sociological Perspective on Collabo- rative Work and Virtual Community,” Association for Computing Machinery, 1996. [11] R. Guimera, L. Danon, A. Diaz-Guilera, F. Giralt and A. Arenas, “Self-Similar Community Structure in a Network of Human Interactions,” Physical Review E, Vol. 68, No. 6, 2003, pp. 1-4. doi:10.1103/PhysRevE.68.065103 [12] J. Tyler, D. Wilkinson and B. Huberman, “E-mail as Spectroscopy: Automated Discovery of Community Struc- ture within Organizations,” The Information Society, Vol. 21, No. 2, 2005, pp. 143-153. doi:10.1080/01972240590925348 [13] P. Carrington, J. Scott and S. Wasserman, “Models and Methods in Social Network Analysis,” Cambridge Uni- versity Press, Cambridge, 2005. doi:10.1017/CBO9780511811395 [14] S. Wasserman and K. Faust, “Social Network Analysis: Methods and Applications,” Cambridge University Press, Cambridge, 2005. [15] L. Katz and J. Powell, “Measurement of the Tendency toward Reciprocation of Choice,” Sociometry, Vol. 18, No. 4, 1955, pp. 403-409. doi:10.2307/2785876 [16] J. Davis and S. Leinhardt, “The Structure of Positive In- terpersonal Relations in Small Groups,” In M. Berger, J. Zelditch and B. Anderson, Eds., Sociological Theories in Progress, Vol. 2, 1967. pp. 218-251. [17] P. Healy and K. Palepu, “The Fall of Enron,” The Journal of Economic Perspectives, Vol. 17, No. 2, 2003, pp. 3-26. doi:10.1257/089533003765888403 [18] L. Fox, “Enron: The Rise and Fall,” John Wiley & Sons Inc., Hoboken, 2003. [19] E. Hamilton, “An Exploration of the Relationship be- tween Loss of Legitimacy and the Sudden Death of Or- ganizations,” Group & Organization Management, Vol. 31, No. 3, 2006, pp. 327-358. doi:10.1177/1059601106286885 [20] J. Shetty and J. Adibi, “The Enron Email Dataset Data- base Schema and Brief Statistical Report,” Information Sciences Institute Technical Report, University of South- ern California, 2004. [21] S. Borgatti, M. Everett and L. Freeman, “UCINET for Windows: Software for Social Network Analysis,” Har- vard Analytic Technologies, 2002. [22] P. Holland and S. Leinhardt, “Holland and Leinhardt Reply: Some Evidence on the Transitivity of Positive In- terpersonal Sentiment,” Journal Storage, Vol. 77, No. 6, 1972, p. 1205- 1209. [23] G. Homans, “Bringing Men Back in,” American Socio- logical Review, Vol. 29, No. 6, 1964, pp. 809-818. doi:10.2307/2090864 [24] G. Homans, “Social Behavior as Exchange,” American Journal of Sociology, Vol. 63, No. 6, 1958, pp. 597-606. doi:10.1086/222355 [25] A. Kadushin and G. Kadushin, “The Social Work Inter- view,” Columbia University Press, New York, 1983. [26] N. Lin and W. Ensel, “Life Stress and Health: Stressors and Resources,” American Sociological Review, Vol. 54, No. 3, 1989, pp. 382-399. doi:10.2307/2095612 [27] S. H. Murshed, S. Uddin and L. Hossain, “Understanding Communication Network Cohesiveness during Organiza- Copyright © 2013 SciRes. SN  S. UDDIN, L. HOSSAIN Copyright © 2013 SciRes. SN 41 tional Crisis: Effects of Clique and Transitivity,” Interna- tional Conference on Information Systems, St Louis, 2010. [28] J. Lanzetta, “Group Behavior under Stress,” Human Rela- tions, Vol. 8, No. 1, 1955, p. 29. doi:10.1177/001872675500800102 [29] G. Simmel, “Conflict and the Web of Group Affiliations,” Free Press, 1964. [30] L. Weller, “The Effects of Anxiety on Cohesiveness and Rejection,” Human Relations, Vol. 16, No. 2, 1963, pp. 189. doi:10.1177/001872676301600208 [31] M. Sherif, “In Common Predicament: Social Psychology of Intergroup Conflict and Cooperation,” Houghton Mif- flin Boston, 1966. [32] S. Uddin, S. T. H. Murshed, and L. Hossain, “Power-Law Behaviour in Complex Organizational Communication Network during Crisis,” Physica A: Statistical Mechanics and Its Applications, Vol. 390, No. 15, 2011, pp. 2845- 2853. [33] S. Uddin, L. Hossain, S. T. Murshed, and J. W. Crawford, “Static versus Dynamic Topology of Complex Commu- nications Network during Organizational Crisis,” Com- plexity, Vol. 16, No. 5, 2011, pp. 27-36. doi:10.1002/cplx.20349 [34] S. Uddin, M. Piraveenan, K. Chung, and L. Hossain, “To- pological Analysis of Longitudinal Networks,” Hawaii International Conference on System Sciences, Hawaii, 2013. |