

Paper Menu >>
Journal Menu >>
 Vol.2, No.9, 984-989 (2010) Natural Science http://dx.doi.org/10.4236/ns.2010.29120 Copyright © 2010 SciRes. OPEN ACCESS Predicting human lifespan limits Byung Mook Weon1,2*, Jung Ho Je2* 1Department of Physics, School of Engineering and Applied Sciences, Harvard University, Cambridge, USA; *Corresponding Author: 2X-ray Imaging Center, Department of Materials Science and Engineering, Pohang University of Science and Technology, Pohang, Korea; *Corresponding Author: [email protected] Received 17 June 2010; revised 22 July 2010; accepted 28 July 2010. ABSTRACT Recent discoveries show steady improvements in life expectancy during modern decades. Does this support that humans continue to live longer in future? We recently put forward the maximum survival tendency, as found in survival curves of industrialized countries, which is described by extended Weibull model with age-dependent stretched exponent. The maximum survival ten- dency suggests that human survival dynamics may possess its intrinsic limit, beyond which survival is inevitably forbidden. Based on such tendency, we develop the model and explore the patterns in the maximum lifespan limits from industrialized countries during recent three decades. This analysis strategy is simple and useful to interpret the complicated human sur- vival dynamics. Keywords: Human Lifespan; Maximum Survival Tendency; Lifespan Limit 1. INTRODUCTION Humans live longer now. Indeed the life expectancy and the observed maximum age at death have significantly increased during recent decades [1-5]. Such increase is mainly attributable to non-biological aspects such as the intricate interplay of advances in income, nutrition, edu- cation, sanitation, and medicine [6,7]. Biologists and gerontologists are hunting for a variety of useful ways to prolong life in animals, including mice and worms [8]. Their research suggests that human lifespan may be re- markably pliable [8]. Can the strategies for animals help humans live longer? So far it is not practical, useful, or ethical to extend healthy life merely by modifying hu- man genes [9] or by restricting food intake [10]. The theoretical maximum lifespan (called ω) in humans is still a subject of considerable debate [6] and the life ex- tension is one of the great challenges in the 21st century [8]. Many scientists believe that human lifespan has an inherent upper limit, although they disagree on whether it is 85 or 100 or 150 [8]. The maximum human lifespan is generally postulated to be around 125 years [7,11,12], whereas the record of the oldest ages at death is increas- ing today [4]. Conventional analysis or theoretical model has not yet come up with a plausible explanation for this disagreement. Recently, based on extended Weibull model with age-dependent stretched exponent [13,14], we suggested a mathematical model for human survival dynamics, S(x) = exp(–(x/α)β(x)), which denotes survival probability with characteristic life α and age-dependent exponent β(x), and showed maximum survival tendency, dS(x)/dx → 0 [15]. In this study, we further develop the model and explore the dynamic patterns with year and country in predicting human lifespan limits (ω) for industrialized countries during recent three decades: ω = 0.458q + 54.241 where the upper x-intercept q = h + (k/p)1/2 for the quadratic model β(x) = –p(x – h)2 + k (where p, h, and k are variable with year and country). We aim to examine the lifespan puzzle—whether human lifespan is approaching a limit or not. Our analysis strategy has practical implications for aging research in biology, medicine, statistics, economy, public policy, and culture. 2. METHODS We examine the survival dynamics of Sweden female’s survival curves during recent three decades, from 1977 to 2007. The reliable demographic data were taken from the periodic life tables (1 × 1) at the Human Mortality Database (http://www.mortality.org). We analyze the survival curves by using a general expression of human survival probability (S(x)) as a function of age (x) [15]: (x) –S(x) expx/ Here, the characteristic life (α) corresponds to the spe- cific age of S(α) = exp(–1) and the age-dependent stret- 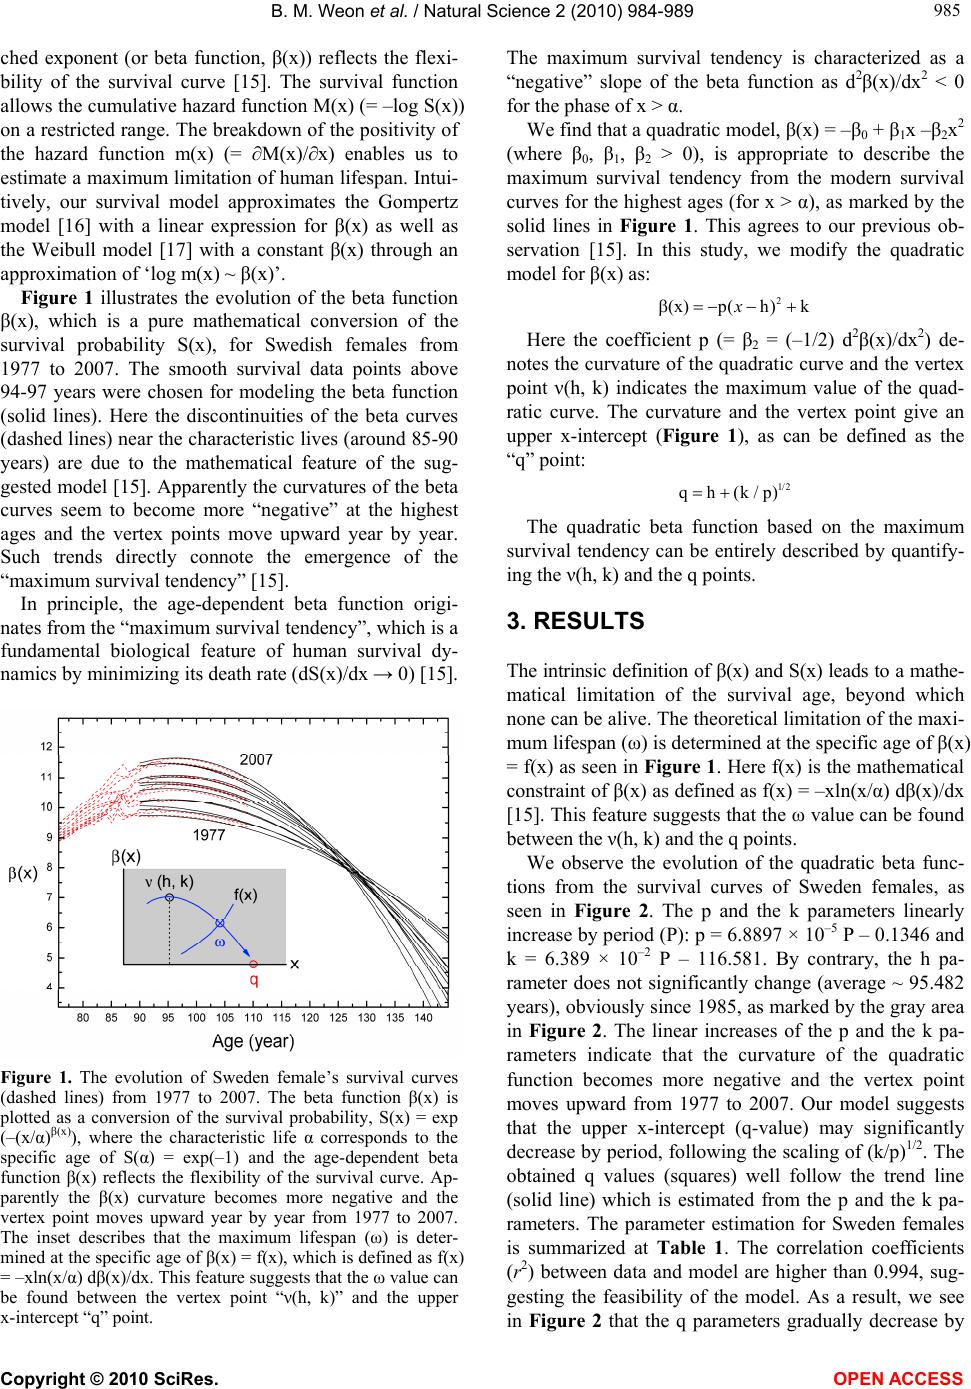 B. M. Weon et al. / Natural Science 2 (2010) 984-989 Copyright © 2010 SciRes. OPEN ACCESS 985 985 ched exponent (or beta function, β(x)) reflects the flexi- bility of the survival curve [15]. The survival function allows the cumulative hazard function M(x) (= –log S(x)) on a restricted range. The breakdown of the positivity of the hazard function m(x) (= ∂M(x)/∂x) enables us to estimate a maximum limitation of human lifespan. Intui- tively, our survival model approximates the Gompertz model [16] with a linear expression for β(x) as well as the Weibull model [17] with a constant β(x) through an approximation of ‘log m(x) ~ β(x)’. Figure 1 illustrates the evolution of the beta function β(x), which is a pure mathematical conversion of the survival probability S(x), for Swedish females from 1977 to 2007. The smooth survival data points above 94-97 years were chosen for modeling the beta function (solid lines). Here the discontinuities of the beta curves (dashed lines) near the characteristic lives (around 85-90 years) are due to the mathematical feature of the sug- gested model [15]. Apparently the curvatures of the beta curves seem to become more “negative” at the highest ages and the vertex points move upward year by year. Such trends directly connote the emergence of the “maximum survival tendency” [15]. In principle, the age-dependent beta function origi- nates from the “maximum survival tendency”, which is a fundamental biological feature of human survival dy- namics by minimizing its death rate (dS(x)/dx → 0) [15]. Figure 1. The evolution of Sweden female’s survival curves (dashed lines) from 1977 to 2007. The beta function β(x) is plotted as a conversion of the survival probability, S(x) = exp (–(x/α)β(x)), where the characteristic life α corresponds to the specific age of S(α) = exp(–1) and the age-dependent beta function β(x) reflects the flexibility of the survival curve. Ap- parently the β(x) curvature becomes more negative and the vertex point moves upward year by year from 1977 to 2007. The inset describes that the maximum lifespan (ω) is deter- mined at the specific age of β(x) = f(x), which is defined as f(x) = –xln(x/α) dβ(x)/dx. This feature suggests that the ω value can be found between the vertex point “ν(h, k)” and the upper x-intercept “q” point. The maximum survival tendency is characterized as a “negative” slope of the beta function as d2β(x)/dx2 < 0 for the phase of x > α. We find that a quadratic model, β(x) = –β0 + β1x –β2x2 (where β0, β1, β2 > 0), is appropriate to describe the maximum survival tendency from the modern survival curves for the highest ages (for x > α), as marked by the solid lines in Figure 1. This agrees to our previous ob- servation [15]. In this study, we modify the quadratic model for β(x) as: 2 (x)p(h) kx Here the coefficient p (= β2 = (–1/2) d2β(x)/dx2) de- notes the curvature of the quadratic curve and the vertex point ν(h, k) indicates the maximum value of the quad- ratic curve. The curvature and the vertex point give an upper x-intercept (Figure 1), as can be defined as the “q” point: 1/2 qh(k/p) The quadratic beta function based on the maximum survival tendency can be entirely described by quantify- ing the ν(h, k) and the q points. 3. RESULTS The intrinsic definition of β(x) and S(x) leads to a mathe- matical limitation of the survival age, beyond which none can be alive. The theoretical limitation of the maxi- mum lifespan (ω) is determined at the specific age of β(x) = f(x) as seen in Figure 1. Here f(x) is the mathematical constraint of β(x) as defined as f(x) = –xln(x/α) dβ(x)/dx [15]. This feature suggests that the ω value can be found between the ν(h, k) and the q points. We observe the evolution of the quadratic beta func- tions from the survival curves of Sweden females, as seen in Figure 2. The p and the k parameters linearly increase by period (P): p = 6.8897 × 10⁻⁵ P – 0.1346 and k = 6.389 × 10⁻² P – 116.581. By contrary, the h pa- rameter does not significantly change (average ~ 95.482 years), obviously since 1985, as marked by the gray area in Figure 2. The linear increases of the p and the k pa- rameters indicate that the curvature of the quadratic function becomes more negative and the vertex point moves upward from 1977 to 2007. Our model suggests that the upper x-intercept (q-value) may significantly decrease by period, following the scaling of (k/p)1/2. The obtained q values (squares) well follow the trend line (solid line) which is estimated from the p and the k pa- rameters. The parameter estimation for Sweden females is summarized at Table 1. The correlation coefficients (r2) between data and model are higher than 0.994, sug- gesting the feasibility of the model. As a result, we see in Figure 2 that the q parameters gradually decrease by 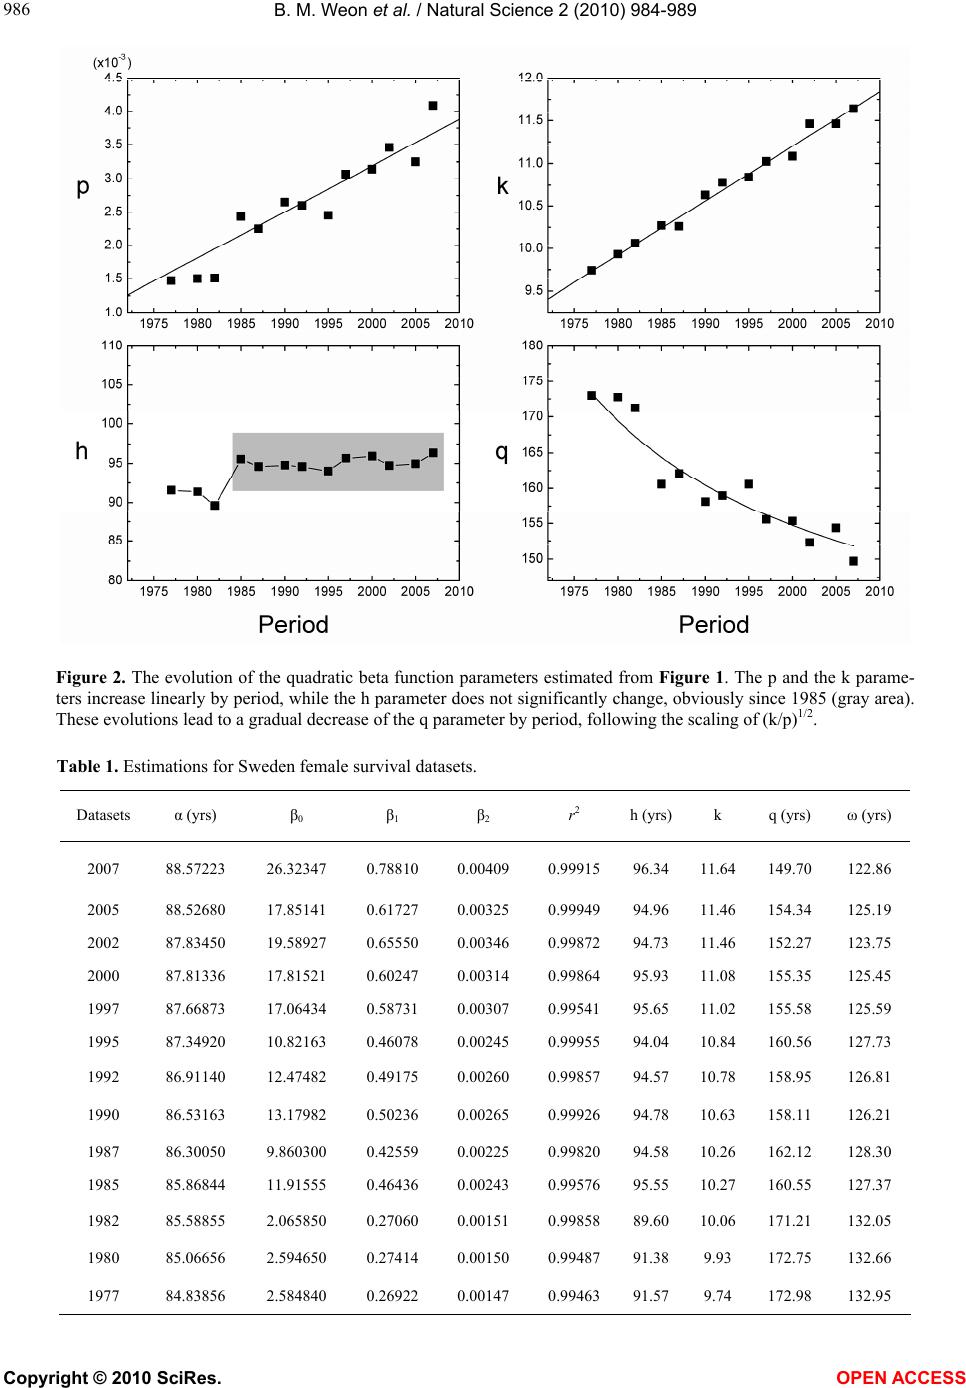 B. M. Weon et al. / Natural Science 2 (2010) 984-989 Copyright © 2010 SciRes. OPEN ACCESS 986 Figure 2. The evolution of the quadratic beta function parameters estimated from Figure 1. The p and the k parame- ters increase linearly by period, while the h parameter does not significantly change, obviously since 1985 (gray area). These evolutions lead to a gradual decrease of the q parameter by period, following the scaling of (k/p)1/2. Table 1. Estimations for Sweden female survival datasets. Datasets α (yrs) β0 β1 β2 r2 h (yrs)k q (yrs) ω (yrs) 2007 88.57223 26.32347 0.78810 0.00409 0.99915 96.3411.64 149.70 122.86 2005 88.52680 17.85141 0.61727 0.00325 0.99949 94.9611.46 154.34 125.19 2002 87.83450 19.58927 0.65550 0.00346 0.99872 94.7311.46 152.27 123.75 2000 87.81336 17.81521 0.60247 0.00314 0.99864 95.9311.08 155.35 125.45 1997 87.66873 17.06434 0.58731 0.00307 0.99541 95.6511.02 155.58 125.59 1995 87.34920 10.82163 0.46078 0.00245 0.99955 94.0410.84 160.56 127.73 1992 86.91140 12.47482 0.49175 0.00260 0.99857 94.5710.78 158.95 126.81 1990 86.53163 13.17982 0.50236 0.00265 0.99926 94.7810.63 158.11 126.21 1987 86.30050 9.860300 0.42559 0.00225 0.99820 94.5810.26 162.12 128.30 1985 85.86844 11.91555 0.46436 0.00243 0.99576 95.5510.27 160.55 127.37 1982 85.58855 2.065850 0.27060 0.00151 0.99858 89.6010.06 171.21 132.05 1980 85.06656 2.594650 0.27414 0.00150 0.99487 91.389.93 172.75 132.66 1977 84.83856 2.584840 0.26922 0.00147 0.99463 91.579.74 172.98 132.95 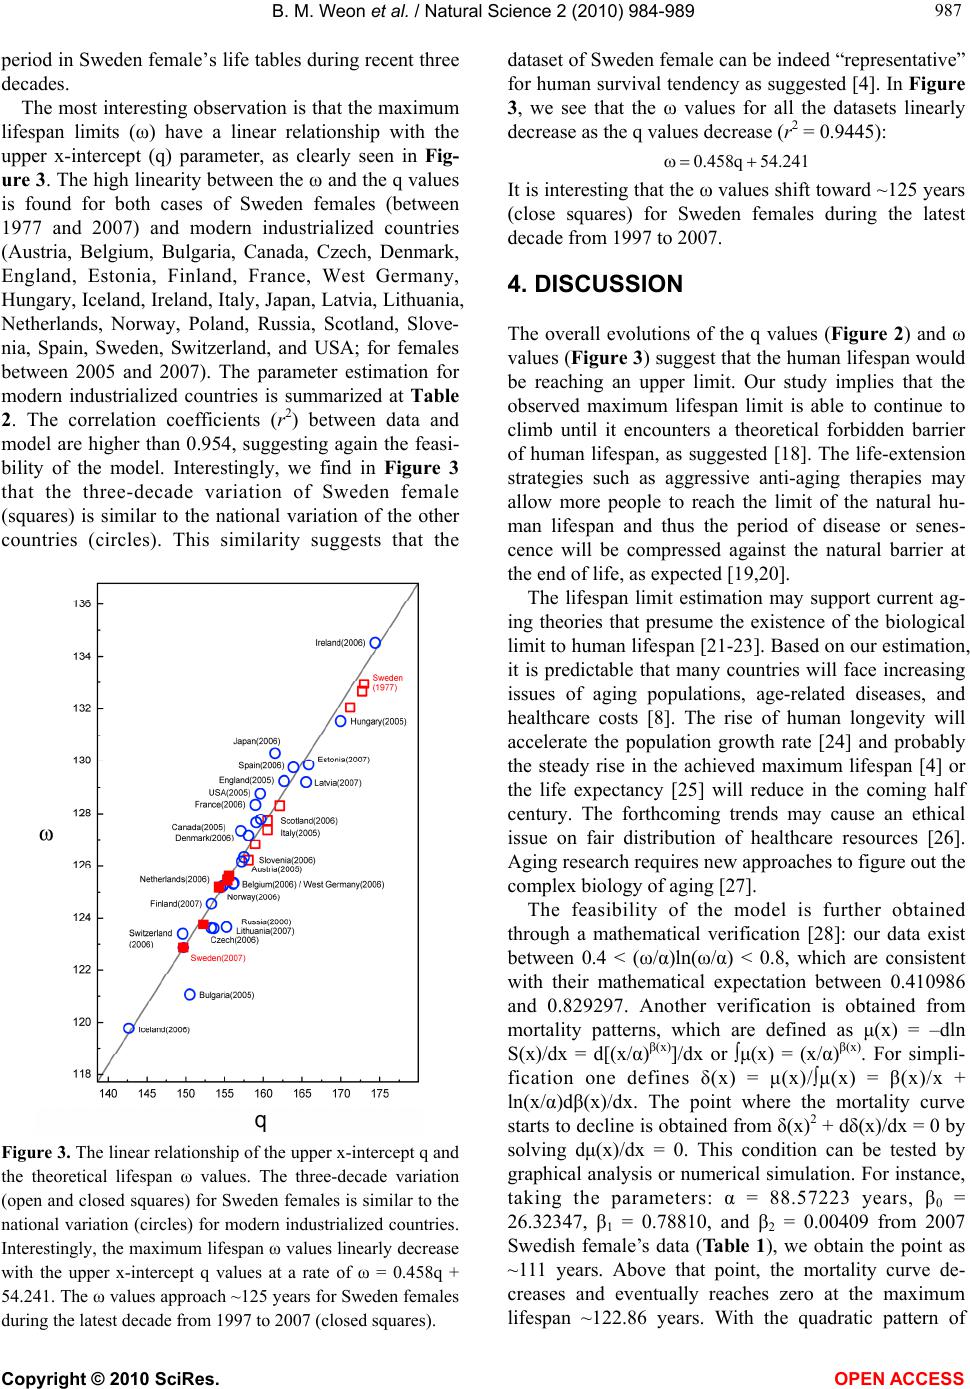 B. M. Weon et al. / Natural Science 2 (2010) 984-989 Copyright © 2010 SciRes. OPEN ACCESS 987 987 period in Sweden female’s life tables during recent three decades. The most interesting observation is that the maximum lifespan limits (ω) have a linear relationship with the upper x-intercept (q) parameter, as clearly seen in Fig- ure 3. The high linearity between the ω and the q values is found for both cases of Sweden females (between 1977 and 2007) and modern industrialized countries (Austria, Belgium, Bulgaria, Canada, Czech, Denmark, England, Estonia, Finland, France, West Germany, Hungary, Iceland, Ireland, Italy, Japan, Latvia, Lithuania, Netherlands, Norway, Poland, Russia, Scotland, Slove- nia, Spain, Sweden, Switzerland, and USA; for females between 2005 and 2007). The parameter estimation for modern industrialized countries is summarized at Table 2. The correlation coefficients (r2) between data and model are higher than 0.954, suggesting again the feasi- bility of the model. Interestingly, we find in Figure 3 that the three-decade variation of Sweden female (squares) is similar to the national variation of the other countries (circles). This similarity suggests that the Figure 3. The linear relationship of the upper x-intercept q and the theoretical lifespan ω values. The three-decade variation (open and closed squares) for Sweden females is similar to the national variation (circles) for modern industrialized countries. Interestingly, the maximum lifespan ω values linearly decrease with the upper x-intercept q values at a rate of ω = 0.458q + 54.241. The ω values approach ~125 years for Sweden females during the latest decade from 1997 to 2007 (closed squares). dataset of Sweden female can be indeed “representative” for human survival tendency as suggested [4]. In Figure 3, we see that the ω values for all the datasets linearly decrease as the q values decrease (r2 = 0.9445): 0.458q 54.241 It is interesting that the ω values shift toward ~125 years (close squares) for Sweden females during the latest decade from 1997 to 2007. 4. DISCUSSION The overall evolutions of the q values (Figure 2) and ω values (Figure 3) suggest that the human lifespan would be reaching an upper limit. Our study implies that the observed maximum lifespan limit is able to continue to climb until it encounters a theoretical forbidden barrier of human lifespan, as suggested [18]. The life-extension strategies such as aggressive anti-aging therapies may allow more people to reach the limit of the natural hu- man lifespan and thus the period of disease or senes- cence will be compressed against the natural barrier at the end of life, as expected [19,20]. The lifespan limit estimation may support current ag- ing theories that presume the existence of the biological limit to human lifespan [21-23]. Based on our estimation, it is predictable that many countries will face increasing issues of aging populations, age-related diseases, and healthcare costs [8]. The rise of human longevity will accelerate the population growth rate [24] and probably the steady rise in the achieved maximum lifespan [4] or the life expectancy [25] will reduce in the coming half century. The forthcoming trends may cause an ethical issue on fair distribution of healthcare resources [26]. Aging research requires new approaches to figure out the complex biology of aging [27]. The feasibility of the model is further obtained through a mathematical verification [28]: our data exist between 0.4 < (ω/α)ln(ω/α) < 0.8, which are consistent with their mathematical expectation between 0.410986 and 0.829297. Another verification is obtained from mortality patterns, which are defined as μ(x) = –dln S(x)/dx = d[(x/α)β(x)]/dx or ∫μ(x) = (x/α)β(x). For simpli- fication one defines δ(x) = μ(x)/∫μ(x) = β(x)/x + ln(x/α)dβ(x)/dx. The point where the mortality curve starts to decline is obtained from δ(x)2 + dδ(x)/dx = 0 by solving dμ(x)/dx = 0. This condition can be tested by graphical analysis or numerical simulation. For instance, taking the parameters: α = 88.57223 years, β0 = 26.32347, β1 = 0.78810, and β2 = 0.00409 from 2007 Swedish female’s data (Table 1), we obtain the point as ~111 years. Above that point, the mortality curve de- creases and eventually reaches zero at the maximum lifespan ~122.86 years. With the quadratic pattern of 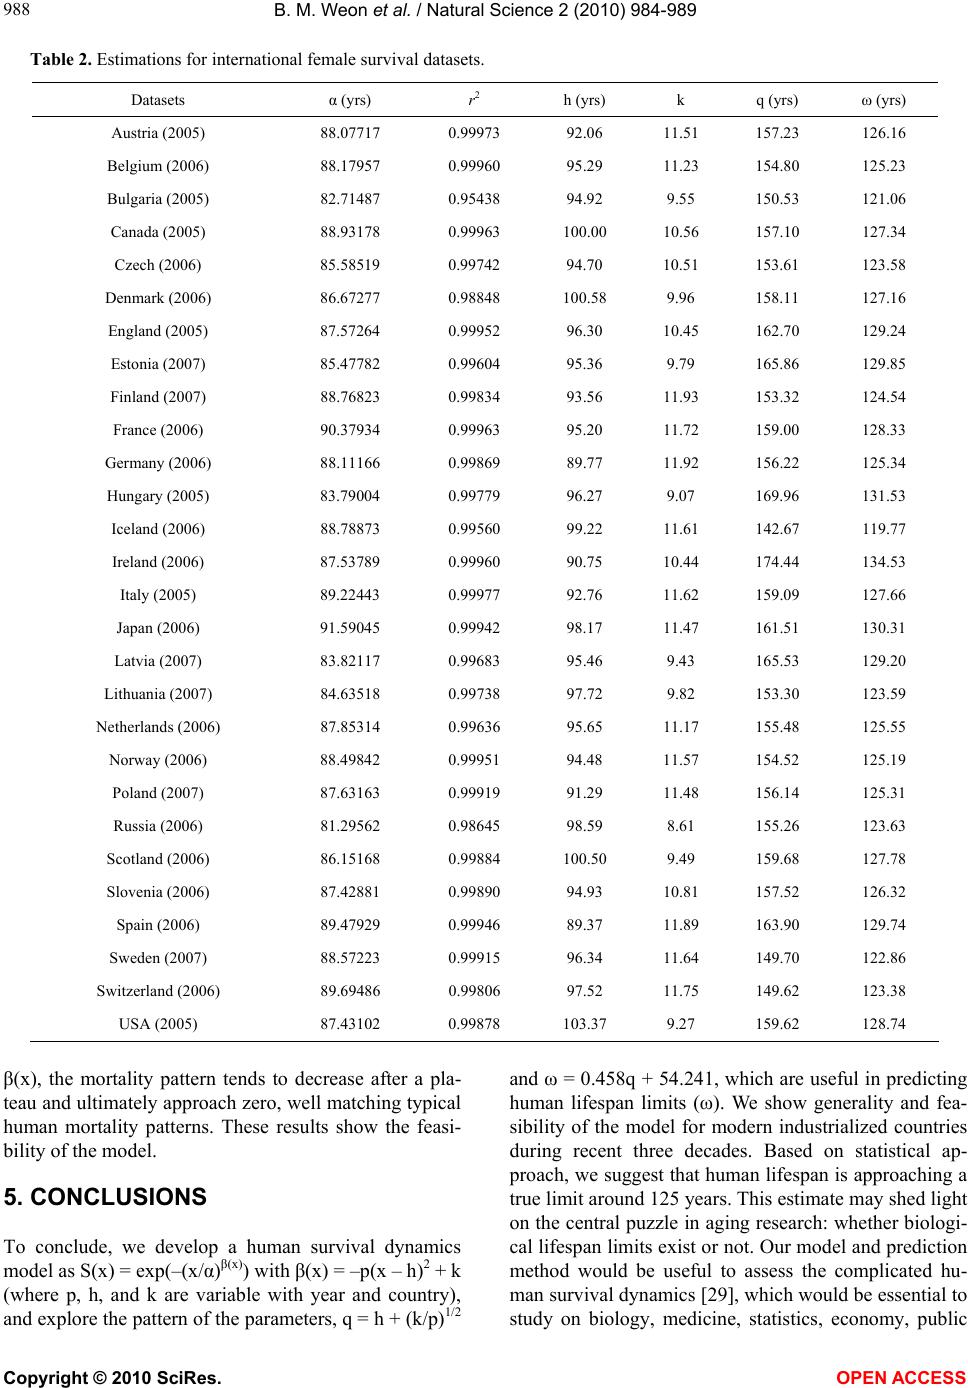 B. M. Weon et al. / Natural Science 2 (2010) 984-989 Copyright © 2010 SciRes. OPEN ACCESS 988 Table 2. Estimations for international female survival datasets. Datasets α (yrs) r2 h (yrs) k q (yrs) ω (yrs) Austria (2005) 88.07717 0.99973 92.06 11.51 157.23 126.16 Belgium (2006) 88.17957 0.99960 95.29 11.23 154.80 125.23 Bulgaria (2005) 82.71487 0.95438 94.92 9.55 150.53 121.06 Canada (2005) 88.93178 0.99963 100.00 10.56 157.10 127.34 Czech (2006) 85.58519 0.99742 94.70 10.51 153.61 123.58 Denmark (2006) 86.67277 0.98848 100.58 9.96 158.11 127.16 England (2005) 87.57264 0.99952 96.30 10.45 162.70 129.24 Estonia (2007) 85.47782 0.99604 95.36 9.79 165.86 129.85 Finland (2007) 88.76823 0.99834 93.56 11.93 153.32 124.54 France (2006) 90.37934 0.99963 95.20 11.72 159.00 128.33 Germany (2006) 88.11166 0.99869 89.77 11.92 156.22 125.34 Hungary (2005) 83.79004 0.99779 96.27 9.07 169.96 131.53 Iceland (2006) 88.78873 0.99560 99.22 11.61 142.67 119.77 Ireland (2006) 87.53789 0.99960 90.75 10.44 174.44 134.53 Italy (2005) 89.22443 0.99977 92.76 11.62 159.09 127.66 Japan (2006) 91.59045 0.99942 98.17 11.47 161.51 130.31 Latvia (2007) 83.82117 0.99683 95.46 9.43 165.53 129.20 Lithuania (2007) 84.63518 0.99738 97.72 9.82 153.30 123.59 Netherlands (2006) 87.85314 0.99636 95.65 11.17 155.48 125.55 Norway (2006) 88.49842 0.99951 94.48 11.57 154.52 125.19 Poland (2007) 87.63163 0.99919 91.29 11.48 156.14 125.31 Russia (2006) 81.29562 0.98645 98.59 8.61 155.26 123.63 Scotland (2006) 86.15168 0.99884 100.50 9.49 159.68 127.78 Slovenia (2006) 87.42881 0.99890 94.93 10.81 157.52 126.32 Spain (2006) 89.47929 0.99946 89.37 11.89 163.90 129.74 Sweden (2007) 88.57223 0.99915 96.34 11.64 149.70 122.86 Switzerland (2006) 89.69486 0.99806 97.52 11.75 149.62 123.38 USA (2005) 87.43102 0.99878 103.37 9.27 159.62 128.74 β(x), the mortality pattern tends to decrease after a pla- teau and ultimately approach zero, well matching typical human mortality patterns. These results show the feasi- bility of the model. 5. CONCLUSIONS To conclude, we develop a human survival dynamics model as S(x) = exp(–(x/α)β(x)) with β(x) = –p(x – h)2 + k (where p, h, and k are variable with year and country), and explore the pattern of the parameters, q = h + (k/p)1/2 and ω = 0.458q + 54.241, which are useful in predicting human lifespan limits (ω). We show generality and fea- sibility of the model for modern industrialized countries during recent three decades. Based on statistical ap- proach, we suggest that human lifespan is approaching a true limit around 125 years. This estimate may shed light on the central puzzle in aging research: whether biologi- cal lifespan limits exist or not. Our model and prediction method would be useful to assess the complicated hu- man survival dynamics [29], which would be essential to study on biology, medicine, statistics, economy, public 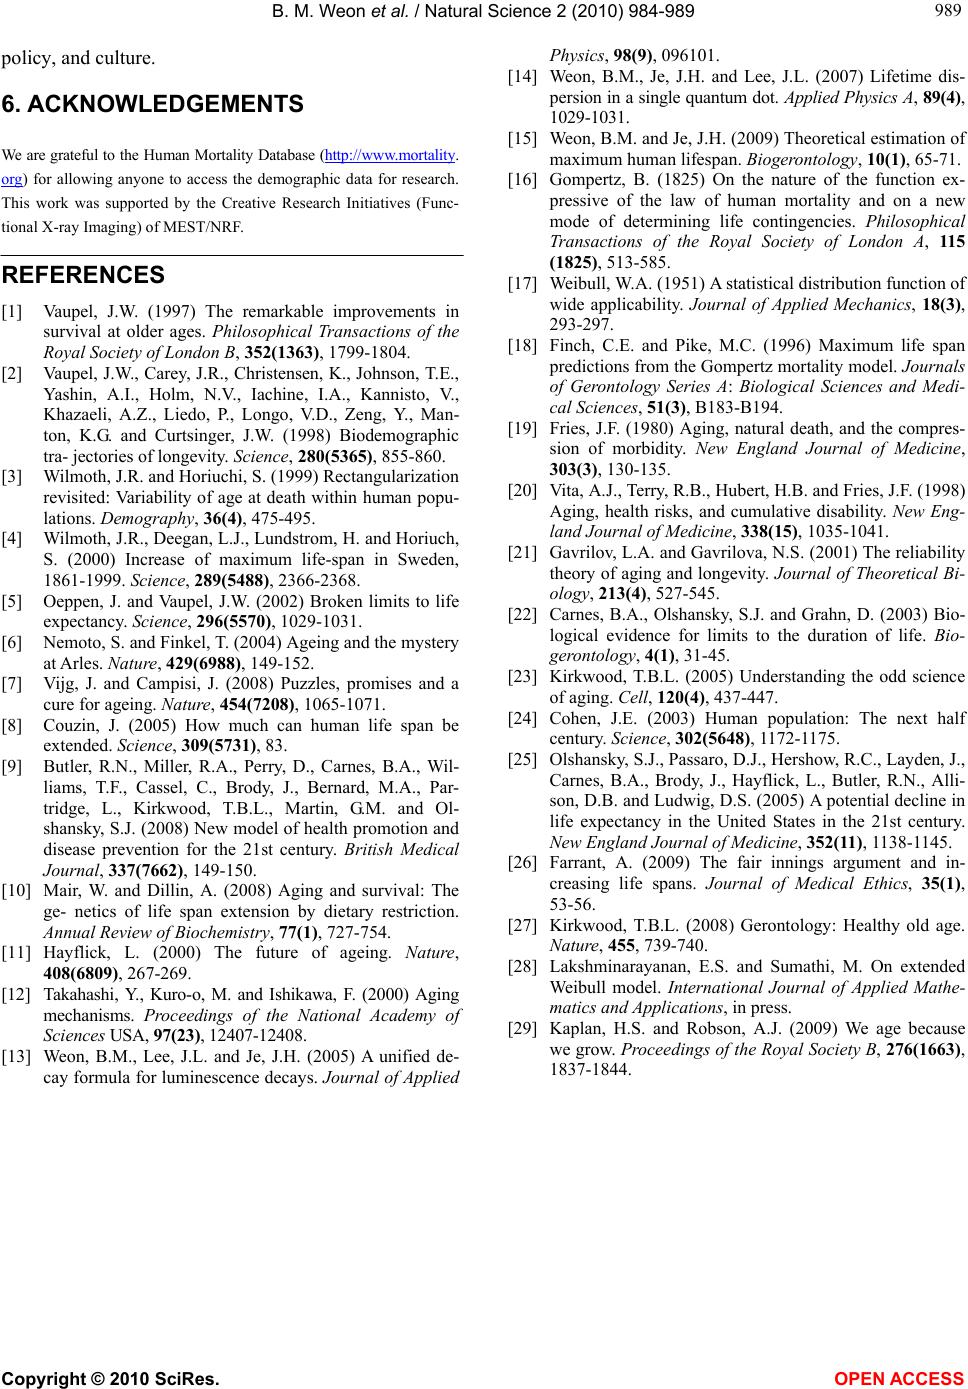 B. M. Weon et al. / Natural Science 2 (2010) 984-989 Copyright © 2010 SciRes. OPEN ACCESS 989 989 policy, and culture. 6. ACKNOWLEDGEMENTS We are grateful to the Human Mortality Database (http://www.mortality. org) for allowing anyone to access the demographic data for research. This work was supported by the Creative Research Initiatives (Func- tional X-ray Imaging) of MEST/NRF. REFERENCES [1] Vaupel, J.W. (1997) The remarkable improvements in survival at older ages. Philosophical Transactions of the Royal Society of London B, 352(1363), 1799-1804. [2] Vaupel, J.W., Carey, J.R., Christensen, K., Johnson, T.E., Yashin, A.I., Holm, N.V., Iachine, I.A., Kannisto, V., Khazaeli, A.Z., Liedo, P., Longo, V.D., Zeng, Y., Man- ton, K.G. and Curtsinger, J.W. (1998) Biodemographic tra- jectories of longevity. Science, 280(5365), 855-860. [3] Wilmoth, J.R. and Horiuchi, S. (1999) Rectangularization revisited: Variability of age at death within human popu- lations. Demography, 36(4), 475-495. [4] Wilmoth, J.R., Deegan, L.J., Lundstrom, H. and Horiuch, S. (2000) Increase of maximum life-span in Sweden, 1861-1999. Science, 289(5488), 2366-2368. [5] Oeppen, J. and Vaupel, J.W. (2002) Broken limits to life expectancy. Science, 296(5570), 1029-1031. [6] Nemoto, S. and Finkel, T. (2004) Ageing and the mystery at Arles. Nature, 429(6988), 149-152. [7] Vijg, J. and Campisi, J. (2008) Puzzles, promises and a cure for ageing. Nature, 454(7208), 1065-1071. [8] Couzin, J. (2005) How much can human life span be extended. Science, 309(5731), 83. [9] Butler, R.N., Miller, R.A., Perry, D., Carnes, B.A., Wil- liams, T.F., Cassel, C., Brody, J., Bernard, M.A., Par- tridge, L., Kirkwood, T.B.L., Martin, G.M. and Ol- shansky, S.J. (2008) New model of health promotion and disease prevention for the 21st century. British Medical Journal, 337(7662), 149-150. [10] Mair, W. and Dillin, A. (2008) Aging and survival: The ge- netics of life span extension by dietary restriction. Annual Review of Biochemistry, 77(1), 727-754. [11] Hayflick, L. (2000) The future of ageing. Nature, 408(6809), 267-269. [12] Takahashi, Y., Kuro-o, M. and Ishikawa, F. (2000) Aging mechanisms. Proceedings of the National Academy of Sciences USA, 97(23), 12407-12408. [13] Weon, B.M., Lee, J.L. and Je, J.H. (2005) A unified de- cay formula for luminescence decays. Journal of Applied Physics, 98(9), 096101. [14] Weon, B.M., Je, J.H. and Lee, J.L. (2007) Lifetime dis- persion in a single quantum dot. Applied Physics A, 89(4), 1029-1031. [15] Weon, B.M. and Je, J.H. (2009) Theoretical estimation of maximum human lifespan. Biogerontology, 10(1), 65-71. [16] Gompertz, B. (1825) On the nature of the function ex- pressive of the law of human mortality and on a new mode of determining life contingencies. Philosophical Transactions of the Royal Society of London A, 115 (1825), 513-585. [17] Weibull, W.A. (1951) A statistical distribution function of wide applicability. Journal of Applied Mechanics, 18(3), 293-297. [18] Finch, C.E. and Pike, M.C. (1996) Maximum life span predictions from the Gompertz mortality model. Journals of Gerontology Series A: Biological Sciences and Medi- cal Sciences, 51(3), B183-B194. [19] Fries, J.F. (1980) Aging, natural death, and the compres- sion of morbidity. New England Journal of Medicine, 303(3), 130-135. [20] Vita, A.J., Terry, R.B., Hubert, H.B. and Fries, J.F. (1998) Aging, health risks, and cumulative disability. New Eng- land Journal of Medicine, 338(15), 1035-1041. [21] Gavrilov, L.A. and Gavrilova, N.S. (2001) The reliability theory of aging and longevity. Journal of Theoretical Bi- ology, 213(4), 527-545. [22] Carnes, B.A., Olshansky, S.J. and Grahn, D. (2003) Bio- logical evidence for limits to the duration of life. Bio- gerontology, 4(1), 31-45. [23] Kirkwood, T.B.L. (2005) Understanding the odd science of aging. Cell, 120(4), 437-447. [24] Cohen, J.E. (2003) Human population: The next half century. Science, 302(5648), 1172-1175. [25] Olshansky, S.J., Passaro, D.J., Hershow, R.C., Layden, J., Carnes, B.A., Brody, J., Hayflick, L., Butler, R.N., Alli- son, D.B. and Ludwig, D.S. (2005) A potential decline in life expectancy in the United States in the 21st century. New England Journal of Medicine, 352(11), 1138-1145. [26] Farrant, A. (2009) The fair innings argument and in- creasing life spans. Journal of Medical Ethics, 35(1), 53-56. [27] Kirkwood, T.B.L. (2008) Gerontology: Healthy old age. Nature, 455, 739-740. [28] Lakshminarayanan, E.S. and Sumathi, M. On extended Weibull model. International Journal of Applied Mathe- matics and Applications, in press. [29] Kaplan, H.S. and Robson, A.J. (2009) We age because we grow. Proceedings of the Royal Society B, 276(1663), 1837-1844. |