

Paper Menu >>
Journal Menu >>
 Open Journal of Accounting, 2013, 2, 1-3 http://dx.doi.org/10.4236/ojacct.2013.21001 Published Online January 2013 (http://www.scirp.org/journal/ojacct) Applying Information Technology to Financial Statement Analysis for Market Capitalization Prediction Hayden Wimmer, Roy Rada Department of Information Systems, University of Maryland Baltimore County, Baltimore, USA Email: hwimmer1@umbc.edu, [email protected] Received November 1, 2012; revised December 5, 2012; accepted December 13, 2012 ABSTRACT Determining which attributes may be employed for predicting the market capitalization of a business firm is a chal- lenging task which may benefit from research intersecting principles of accounting and finance with information tech- nology. In our approach, inf ormation technology in the form of decision trees and genetic alg orithms is applied to fun- damental financial statement data in order to support the decision making process for predicting the direction of the value of a company with value defined as the market capitalization. The decision process differs from year to year; however, the amount of variation is crucial to a successful decision making process. The research question posed is “how much variation occurs between years?” We hypothesize the amount of variation is smaller than half the number of financial statement attributes that may be employed in the decision making process. We develop a system which tests the amount of variation between years measured as the amount of generations required to reach a target level of fitness. The hypothesis is tested using da ta filtered from Compustat’s global database. Th e resu lts s upport th e research hypothe- sis and advance us toward answering the research question. The implications of this research are the possibility to im- prove the decision process when employing financial statement analysis as applied to the market capitalization and fi- nancial valuation of business f irms. Keywords: Fundamental Analysis; Market Capitalization; Accountin g Information Systems 1. Introduction The purpose of this research is to explore the amount of variation between years of which financial statement attributes are most critical for determining if the market capitalization of a business firm increases or decreases. We hypothesize the amount of variation is smaller than half the number of financial statement attributes that may be employed in the decision making process. This is tested by applying an information technology based ap- proach to determining which attributes are most critical in the decision process for valuating future market capi- talization. Market capitalization is defined as the total outstand- ing shares of a company multiplied by the stock’s price. The market capitalization—or market cap—is considered the public’s valuation of a company. Determining which attributes from fundamental financial statement analysis are valuable in predicting the performance of the stocks is a critical step in any investment strategy. It has long been accepted that financial markets are informationally efficient. This is referred to as the Efficient Market Hy- pothesis [1]. In other words, it is not possible to predict market performance or determine which financial state- ment attributes are the most critical in the valuation of a business firm. In contrast to the efficient market hy- pothesis, the adaptive market hypothesis [2,3] states that markets evolve based on competition, natural selection, and adaptation. This theory of evolution may be applied to determining which financial statement attributes are most important from year to year. Decision trees are graph like structures which may be extracted into rules for the decision making process. De- cision trees are common in many business domains such as accounting, finance, and operations management. A decision tree may be extracted into a set of rules by fol- lowing a terminating node of the tree to the root node of the tree. The more levels in a tree the more complex the rule base that may be derived from the decision tree. The decision tree’s rules may be extracted and used as input for an expert system or decision support system. Com- puter scientists have developed techniques which incur- porate machine learning into decision trees. This allows the decision trees to be trained on a dataset without hu- man intervention. One of the most popular is the ID3 and the C4.5 decision tree algorithms [4]. The C4.5 is merely an extension of the widely popular ID3 algorithm. The C opyright © 2013 SciRes. OJAcct 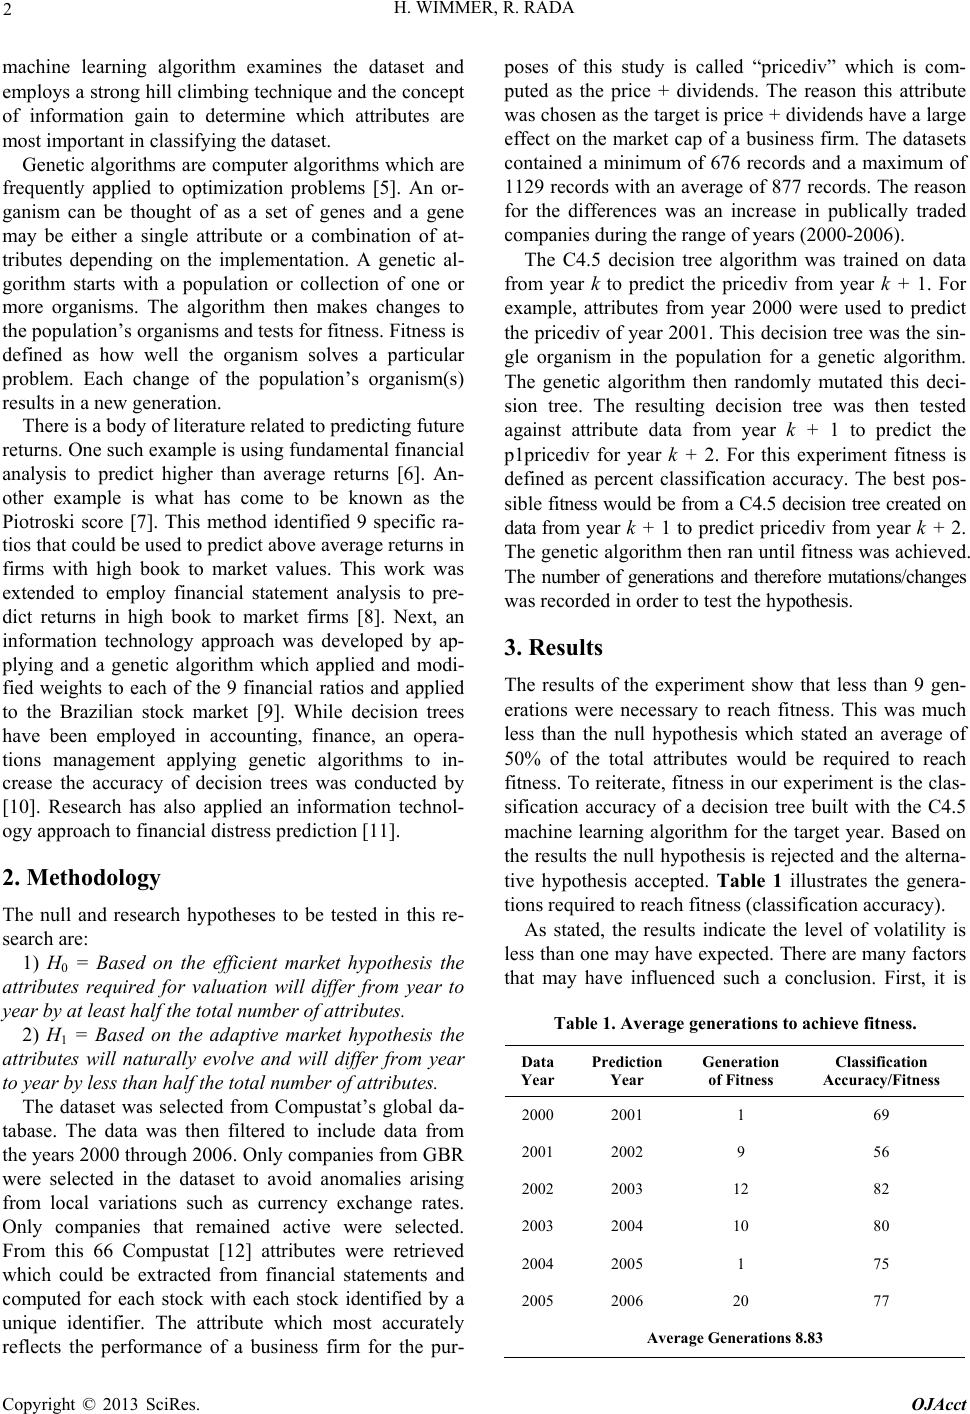 H. WIMMER, R. RADA 2 machine learning algorithm examines the dataset and employs a strong hill climbing technique and the co ncept of information gain to determine which attributes are most important in classifying the dataset. Genetic algorithms are computer algorithms which are frequently applied to optimization problems [5]. An or- ganism can be thought of as a set of genes and a gene may be either a single attribute or a combination of at- tributes depending on the implementation. A genetic al- gorithm starts with a population or collection of one or more organisms. The algorithm then makes changes to the population’s organisms and tests for fitness. Fitness is defined as how well the organism solves a particular problem. Each change of the population’s organism(s) results in a new generation. There is a body of literature related to predicting fu ture returns. One such example is using fundamental financial analysis to predict higher than average returns [6]. An- other example is what has come to be known as the Piotroski score [7]. This method identified 9 specific ra- tios that could be used to pr edict abov e av erage returns in firms with high book to market values. This work was extended to employ financial statement analysis to pre- dict returns in high book to market firms [8]. Next, an information technology approach was developed by ap- plying and a genetic algorithm which applied and modi- fied weights to each of the 9 financial ratios and applied to the Brazilian stock market [9]. While decision trees have been employed in accounting, finance, an opera- tions management applying genetic algorithms to in- crease the accuracy of decision trees was conducted by [10]. Research has also applied an information technol- ogy approach to financial distress prediction [11]. 2. Methodology The null and research hypotheses to be tested in this re- search are: 1) H0 = Based on the efficient market hypothesis the attributes required for valuation will differ from year to year by at least half the total number of attributes. 2) H1 = Based on the adaptive market hypothesis the attributes will naturally evolve and will differ from year to year by less than half the total number of attributes. The dataset was selected from Compustat’s global da- tabase. The data was then filtered to include data from the years 2000 th rough 2006 . Only compan ies from GBR were selected in the dataset to avoid anomalies arising from local variations such as currency exchange rates. Only companies that remained active were selected. From this 66 Compustat [12] attributes were retrieved which could be extracted from financial statements and computed for each stock with each stock identified by a unique identifier. The attribute which most accurately reflects the performance of a business firm for the pur- poses of this study is called “pricediv” which is com- puted as the price + dividends. The reason this attribute was chosen as the target is price + dividends have a large effect on the market cap of a business firm. The datasets contained a minimum of 676 records and a maximum of 1129 rec ords with an ave rage of 877 records. The reason for the differences was an increase in publically traded companies during the range of years (2000-2006). The C4.5 decision tree algorithm was trained on data from year k to predict the pricediv from year k + 1. For example, attributes from year 2000 were used to predict the pricediv of year 2001. This d ecision tree was the sin- gle organism in the population for a genetic algorithm. The genetic algorithm then randomly mutated this deci- sion tree. The resulting decision tree was then tested against attribute data from year k + 1 to predict the p1pricediv for year k + 2. For this experiment fitness is defined as percent classification accuracy. The best pos- si bl e fitness would be from a C4.5 decision tree created on data from year k + 1 to predict pricediv from year k + 2. The genetic algorithm then ran until fitness was achieved. The number of generations and therefore mutations/changes was recorded in order to test the hypothesis. 3. Results The results of the experiment show that less than 9 gen- erations were necessary to reach fitness. This was much less than the null hypothesis which stated an average of 50% of the total attributes would be required to reach fitness. To reiterate, fitness in our experiment is th e clas- sification accuracy of a decision tree built with the C4.5 machine learning algorithm for the target year. Based on the results the null hypothesis is rejected and the alterna- tive hypothesis accepted. Table 1 illustrates the genera- tions required to reach fitness (classification accuracy). As stated, the results indicate the level of volatility is less than one may have expected. There are many factors that may have influenced such a conclusion. First, it is Table 1. Average generations to achieve fitness. Data Year Prediction Year Generation of Fitness Classification Accuracy/Fitness 2000 2001 1 69 2001 2002 9 56 2002 2003 12 82 2003 2004 10 80 2004 2005 1 75 2005 2006 20 77 Average Generations 8.83 Copyright © 2013 SciRes. OJAcct 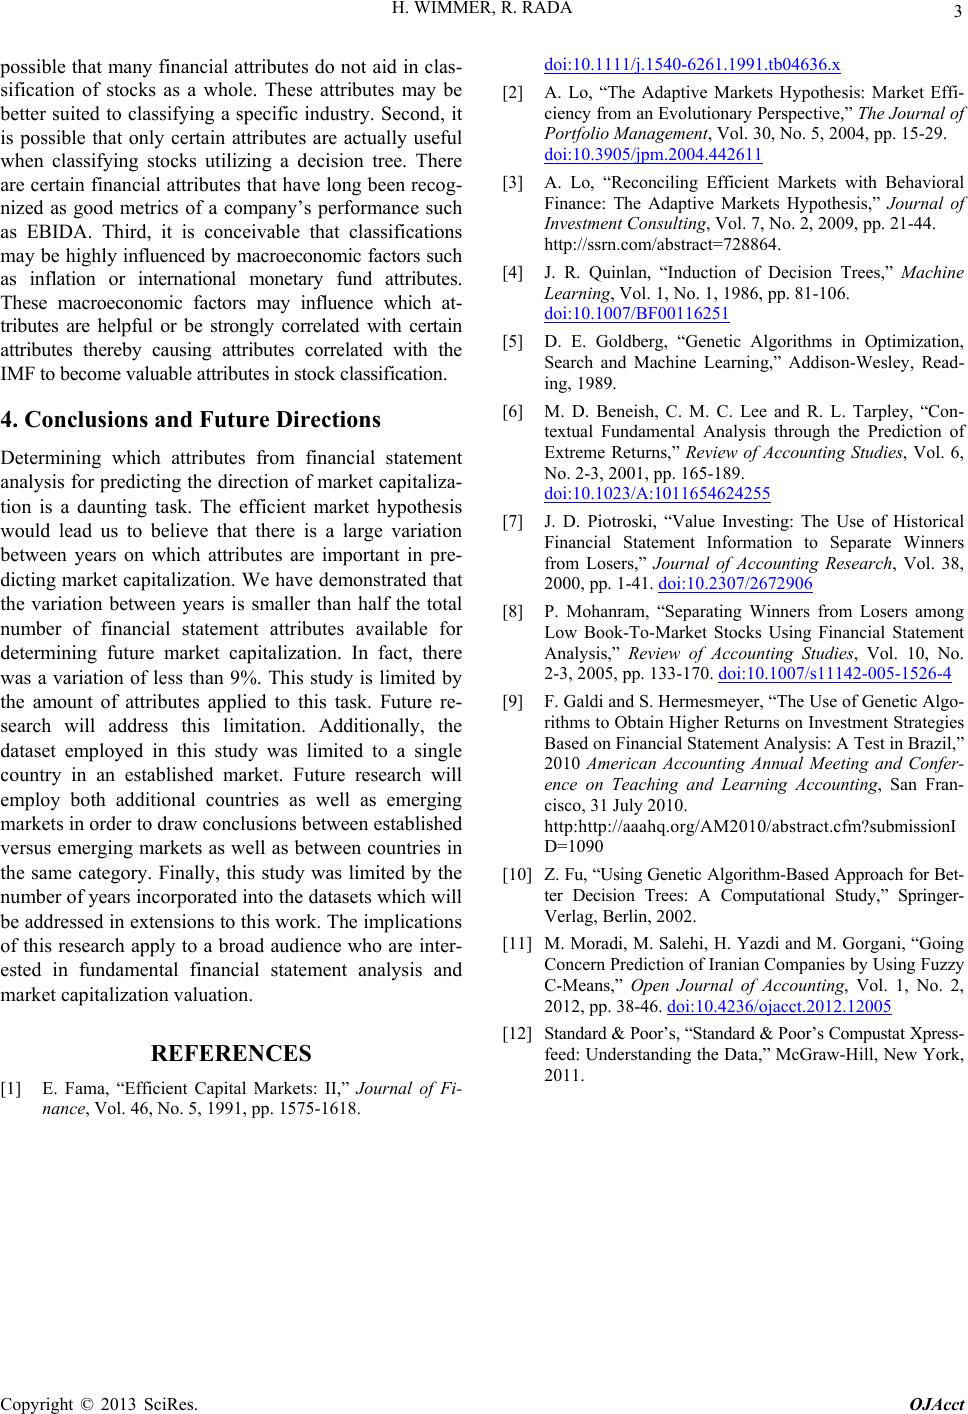 H. WIMMER, R. RADA Copyright © 2013 SciRes. OJAcct 3 possible that many financial attributes do not aid in clas- sification of stocks as a whole. These attributes may be better suited to classifying a specific industry. Second, it is possible that only certain attributes are actually useful when classifying stocks utilizing a decision tree. There are certain financ ial attributes that have long been recog- nized as good metrics of a company’s performance such as EBIDA. Third, it is conceivable that classifications may be high ly influenced by macroecono mic factors such as inflation or international monetary fund attributes. These macroeconomic factors may influence which at- tributes are helpful or be strongly correlated with certain attributes thereby causing attributes correlated with the IMF to become valuable attributes in stock classification. 4. Conclusions and Future Directions Determining which attributes from financial statement analysis for predicting the direction of market capitaliza- tion is a daunting task. The efficient market hypothesis would lead us to believe that there is a large variation between years on which attributes are important in pre- dicting market capitalization. We have demonstrated that the variation between years is smaller than half the total number of financial statement attributes available for determining future market capitalization. In fact, there was a variation of less than 9%. This study is limited by the amount of attributes applied to this task. Future re- search will address this limitation. Additionally, the dataset employed in this study was limited to a single country in an established market. Future research will employ both additional countries as well as emerging markets in order to draw conclusions between established versus emerging markets as well as between countries in the same category. Finally, this study was limited by the number of years incorporated into th e datasets which will be addressed in extensions to this work. The implica tions of this research apply to a broad audience who are inter- ested in fundamental financial statement analysis and market capitalization valuation. REFERENCES [1] E. Fama, “Efficient Capital Markets: II,” Journal of Fi- nance, Vol. 46, No. 5, 1991, pp. 1575-1618. doi:10.1111/j.1540-6261.1991.tb04636.x [2] A. Lo, “The Adaptive Markets Hypothesis: Market Effi- ciency from an Evolutionary Perspective,” The Journal of Portfolio Management, Vol. 30, No. 5, 2004, pp. 15-29. doi:10.3905/jpm.2004.442611 [3] A. Lo, “Reconciling Efficient Markets with Behavioral Finance: The Adaptive Markets Hypothesis,” Journal of Investment Consulting, Vol. 7, No. 2, 2009, pp. 21-44. http://ssrn.com/abstract=728864. [4] J. R. Quinlan, “Induction of Decision Trees,” Machine Learning, Vol. 1, No. 1, 1986, pp. 81-106. doi:10.1007/BF00116251 [5] D. E. Goldberg, “Genetic Algorithms in Optimization, Search and Machine Learning,” Addison-Wesley, Read- ing, 1989. [6] M. D. Beneish, C. M. C. Lee and R. L. Tarpley, “Con- textual Fundamental Analysis through the Prediction of Extreme Returns,” Review of Accounting Studies, Vol. 6, No. 2-3, 2001, pp. 165-189. doi:10.1023/A:1011654624255 [7] J. D. Piotroski, “Value Investing: The Use of Historical Financial Statement Information to Separate Winners from Losers,” Journal of Accounting Research, Vol. 38, 2000, pp. 1-41. doi:10.2307/2672906 [8] P. Mohanram, “Separating Winners from Losers among Low Book-To-Market Stocks Using Financial Statement Analysis,” Review of Accounting Studies, Vol. 10, No. 2-3, 2005, pp. 133-170. doi:10.1007/s11142-005-1526-4 [9] F. Galdi and S. Hermesmeye r, “The Use of Genetic Algo- rithms to Obtain Higher Returns on Investment Strategies Based on Financial Statement Analysis: A Test in Brazil,” 2010 American Accounting Annual Meeting and Confer- ence on Teaching and Learning Accounting, San Fran- cisco, 31 July 2010. http:http://aaahq.org/AM2010/abstract.cfm?submissionI D=1090 [10] Z. Fu, “Using Genetic Algorithm-Based Approach for Bet- ter Decision Trees: A Computational Study,” Springer- Verlag, Berlin, 2002. [11] M. Moradi, M. Salehi, H. Yazdi and M. Gorgani, “Going Concern Prediction of Iranian Companies by Using Fuzzy C-Means,” Open Journal of Accounting, Vol. 1, No. 2, 2012, pp. 38-46. doi:10.4236/ojacct.2012.12005 [12] Standard & Poor’s, “Standard & Poor’s Compustat Xpress- feed: Understanding the Data,” McGraw-Hill, New York, 2011. |