

Paper Menu >>
Journal Menu >>
 Journal of Water Resource and Protection, 2013, 5, 64-71 http://dx.doi.org/10.4236/jwarp.2013.51008 Published Online January 2013 (http://www.scirp.org/journal/jwarp) Spatial and Temporal Quality of Water in the Itupararanga Reservoir, Alto Sorocaba Basin (SP), Brazil Felipe José de Moraes Pedrazzi1, Fabiano Tomazini da Conceição1*, Diego de Souza Sardinha2, Viviane Moschini-Carlos3, Marcelo Pompêo4 1UNESP, Universidade Estadual Paulista, Rio Claro, Brazil 2ICT, UNIFAL, Poços de Caldas, Brazil 3UNESP, Universidade Estadual Paulista, Sorocaba, Brazil 4IB, USP, São Paulo, Brazil Email: *[email protected] Received October 30, 2012; revised November 30, 2012; accepted December 8, 2012 ABSTRACT Considering the great importance of the Itupararanga Reservoir, Upper Alto Sorocaba basin/SP, this study aimed to report the variations of some parameters of water quality in the spatial and temporal gradients in this multipurpose res- ervoir. The eutrophication of this reservoir was checked using the Carlson Index Modified and the results indicate that the surface water were classified as eutrophic and mesotrophic in wet and dry periods, being characterized the better quality of water in wet period. In the vertical gradient the results showed a stratiphication in all parameters analyzed, except for the electrical conductivity, with good correlation between total phosphorous and chlorophyll-a, indicating that eutrophication of the reservoir changes the conditions of algal growth, mainly in its initial area. Immediate inter- ventions are needed, which must be directed to planning of land use, domestic effluents treatment, taking to an inte- grated management of this important watershed located in the São Paulo State. Keywords: Itupararanga Reservoir; Limnology; Eutrophication; Environmental Management 1. Introduction Water is available in various forms, one of the most common and important substances found in nature, covering about 70% of the Earth surface. Fresh water represents only 2.5% of total water in nature, and the remaining 97.5% are found in oceans and seas salty. However, only 0.3% is fresh water exploitable for human activities, can be drawn from lakes, rivers and aquifers. The remainder is contained in aquifers, deep aquifers, polar ice caps, glaciers, permanent snow and other reservoirs. Recent data show that 1.7 billion people presently live without water with adequate quality; a number that may increase to 3.3 billion in 2020 and that may cause con- flicts if effective water management is not performed. The classification of water bodies is usually established according to legal standards and it should be expected to be improved over time. In Brazil, this classification was made by Resolution CONAMA (National Council for Environment) No 357, that defines freshwaters (special, 1, 2, 3 and 4 classes), brackish waters (special, 1, 2 and 3 classes) and saline waters (special, 1, 2 and 3 classes) [1]. São Paulo Electric Company, known as “Light” built Itupararanga reservoir (Figure 1) in 1912, the aim was generate electricity to the cities around Votorantim. Later, in 1976, Companhia Brasileira de Aluminio (CBA) bought the rights to operate the hydroelectric power generation for the aluminum industry. This reservoir is located at the Upper Sorocaba basin, which has its economy based mainly on agricultural production, where many affluents compose this basin tributaries that give rise to the Sorocaba River, which flows into the Itupararanga Reservoir. This reservoir has fundamental importance in regulating the hydraulic regime of the Sorocaba River and in the public supply of the region, serving approximately one million people in the municipalities of Ibiúna Sorocaba, Votorantim and Mairinque. However, this reservoir has lack of infor- mation about its quality, making it essential to carry out more detailed limnological studies. Thus, the purpose of this study was to evaluate the water quality in spatial and temporal scales in Itupararanga Reservoir, São Paulo State. The results allowed generating an environmental assessment by providing grants for planning and manage- ment of pollution control in this important watershed located in the interior of São Paulo State. 2. Overview of the Alto Sorocaba Basin Alto Sorocaba basin covers an area of 929 km2 (Figure 1) *Corresponding author. C opyright © 2013 SciRes. JWARP 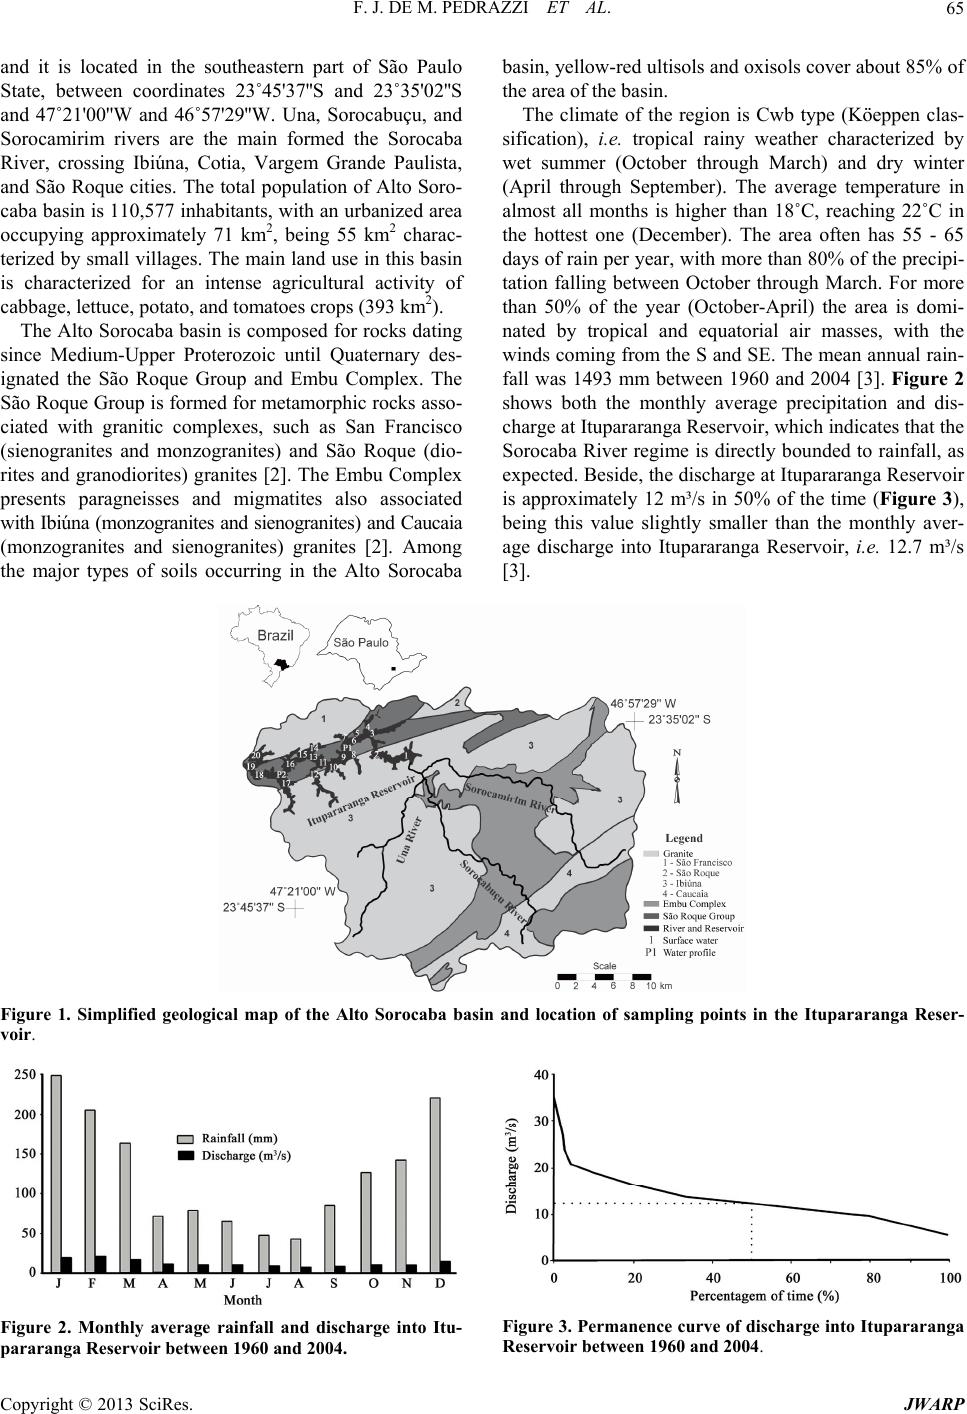 F. J. DE M. PEDRAZZI ET AL. 65 and it is located in the southeastern part of São Paulo State, between coordinates 23˚45'37''S and 23˚35'02''S and 47˚21'00''W and 46˚57'29''W. Una, Sorocabuçu, and Sorocamirim rivers are the main formed the Sorocaba River, crossing Ibiúna, Cotia, Vargem Grande Paulista, and São Roque cities. The total population of Alto Soro- caba basin is 110,577 inhabitants, with an urbanized area occupying approximately 71 km2, being 55 km2 charac- terized by small villages. The main land use in this basin is characterized for an intense agricultural activity of cabbage, lettuce, potato, and tomatoes crops (393 km2). The Alto Sorocaba basin is composed for rocks dating since Medium-Upper Proterozoic until Quaternary des- ignated the São Roque Group and Embu Complex. The São Roque Group is formed for metamorphic rocks asso- ciated with granitic complexes, such as San Francisco (sienogranites and monzogranites) and São Roque (dio- rites and granodiorites) granites [2]. The Embu Complex presents paragneisses and migmatites also associated with Ibiúna (monzogranites and sienogranites) and Caucaia (monzogranites and sienogranites) granites [2]. Among the major types of soils occurring in the Alto Sorocaba basin, yellow-red ultisols and oxisols cover about 85% of the area of the basin. The climate of the region is Cwb type (Köeppen clas- sification), i.e. tropical rainy weather characterized by wet summer (October through March) and dry winter (April through September). The average temperature in almost all months is higher than 18˚C, reaching 22˚C in the hottest one (December). The area often has 55 - 65 days of rain per year, with more than 80% of the precipi- tation falling between October through March. For more than 50% of the year (October-April) the area is domi- nated by tropical and equatorial air masses, with the winds coming from the S and SE. The mean annual rain- fall was 1493 mm between 1960 and 2004 [3]. Figure 2 shows both the monthly average precipitation and dis- charge at Itupararanga Reservoir, which indicates that the Sorocaba River regime is directly bounded to rainfall, as expected. Beside, the discharge at Itupararanga Reservoir is approximately 12 m³/s in 50% of the time (Figure 3), being this value slightly smaller than the monthly aver- age discharge into Itupararanga Reservoir, i.e. 12.7 m³/s [3]. Figure 1. Simplified geological map of the Alto Sorocaba basin and location of sampling points in the Itupararanga Reser- voir. Figure 2. Monthly average rainfall and discharge into Itu- pararanga Reservoir between 1960 and 2004. Figure 3. Permanence curve of discharge into Itupararanga Reservoir between 1960 and 2004. Copyright © 2013 SciRes. JWARP 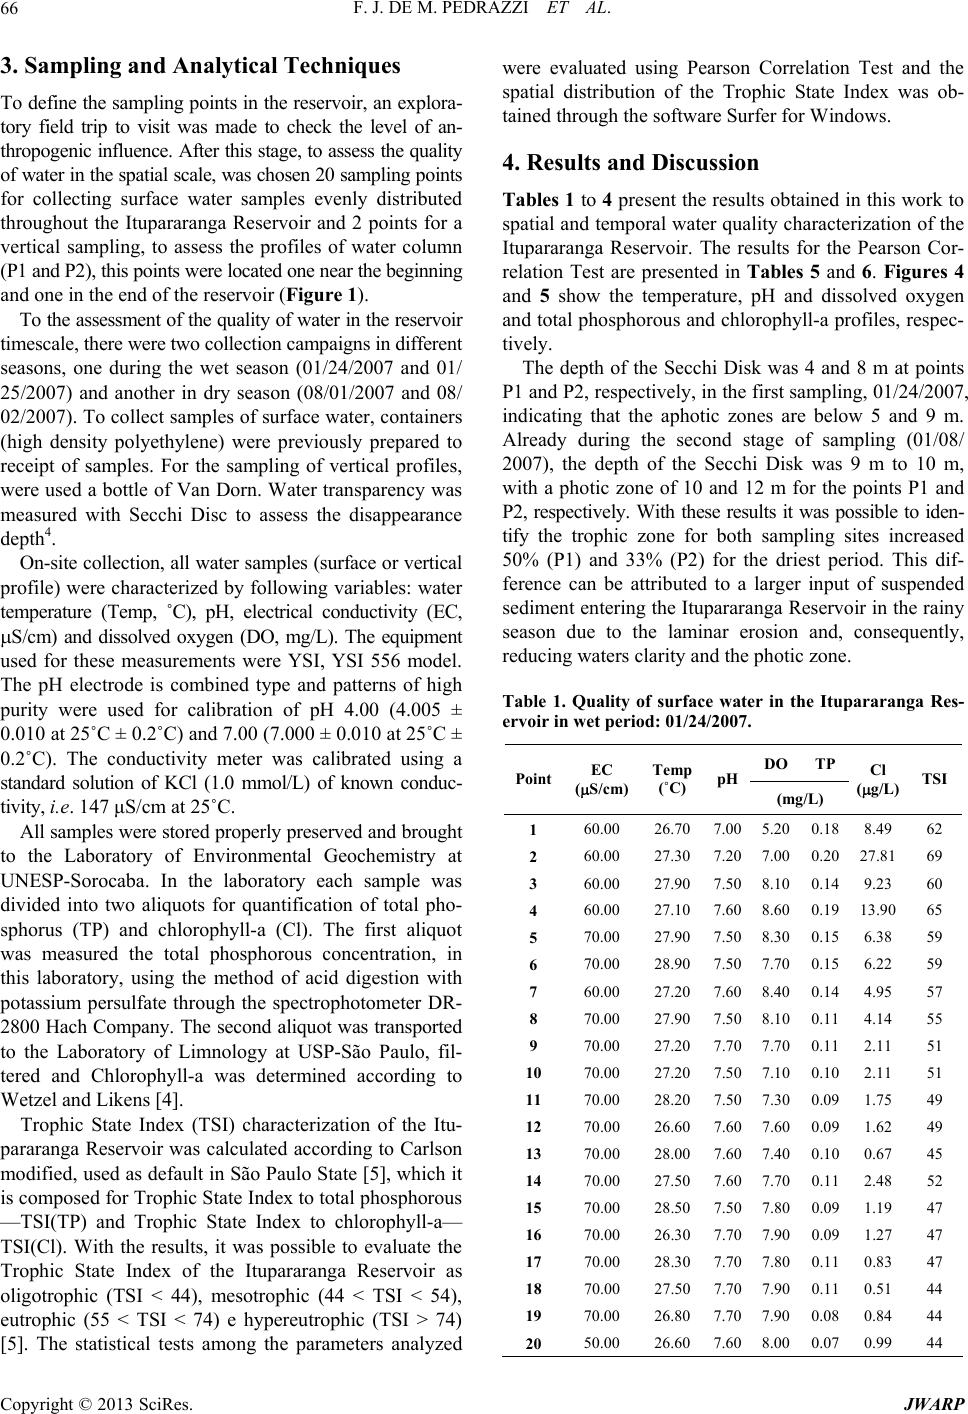 F. J. DE M. PEDRAZZI ET AL. 66 3. Sampling and Analytical Techniques To define the sampling points in the reservoir, an explora- tory field trip to visit was made to check the level of an- thropogenic influence. After this stage, to assess the quality of water in the spatial scale, was chosen 20 sampling points for collecting surface water samples evenly distributed throughout the Itupararanga Reservoir and 2 points for a vertical sampling, to assess the profiles of water column (P1 and P2), this points were located one near the beginning and one in the end of the reservoir (Figure 1). To the assessment of the quality of water in the reservoir timescale, there were two collection campaigns in different seasons, one during the wet season (01/24/2007 and 01/ 25/2007) and another in dry season (08/01/2007 and 08/ 02/2007). To collect samples of surface water, containers (high density polyethylene) were previously prepared to receipt of samples. For the sampling of vertical profiles, were used a bottle of Van Dorn. Water transparency was measured with Secchi Disc to assess the disappearance depth4. On-site collection, all water samples (surface or vertical profile) were characterized by following variables: water temperature (Temp, ˚C), pH, electrical conductivity (EC, S/cm) and dissolved oxygen (DO, mg/L). The equipment used for these measurements were YSI, YSI 556 model. The pH electrode is combined type and patterns of high purity were used for calibration of pH 4.00 (4.005 ± 0.010 at 25˚C ± 0.2˚C) and 7.00 (7.000 ± 0.010 at 25˚C ± 0.2˚C). The conductivity meter was calibrated using a standard solution of KCl (1.0 mmol/L) of known conduc- tivity, i.e. 147 μS/cm at 25˚C. All samples were stored properly preserved and brought to the Laboratory of Environmental Geochemistry at UNESP-Sorocaba. In the laboratory each sample was divided into two aliquots for quantification of total pho- sphorus (TP) and chlorophyll-a (Cl). The first aliquot was measured the total phosphorous concentration, in this laboratory, using the method of acid digestion with potassium persulfate through the spectrophotometer DR- 2800 Hach Company. The second aliquot was transported to the Laboratory of Limnology at USP-São Paulo, fil- tered and Chlorophyll-a was determined according to Wetzel and Likens [4]. Trophic State Index (TSI) characterization of the Itu- pararanga Reservoir was calculated according to Carlson modified, used as default in São Paulo State [5], which it is composed for Trophic State Index to total phosphorous —TSI(TP) and Trophic State Index to chlorophyll-a— TSI(Cl). With the results, it was possible to evaluate the Trophic State Index of the Itupararanga Reservoir as oligotrophic (TSI < 44), mesotrophic (44 < TSI < 54), eutrophic (55 < TSI < 74) e hypereutrophic (TSI > 74) [5]. The statistical tests among the parameters analyzed were evaluated using Pearson Correlation Test and the spatial distribution of the Trophic State Index was ob- tained through the software Surfer for Windows. 4. Results and Discussion Tables 1 to 4 present the results obtained in this work to spatial and temporal water quality characterization of the Itupararanga Reservoir. The results for the Pearson Cor- relation Test are presented in Tables 5 and 6. Figures 4 and 5 show the temperature, pH and dissolved oxygen and total phosphorous and chlorophyll-a profiles, respec- tively. The depth of the Secchi Disk was 4 and 8 m at points P1 and P2, respectively, in the first sampling, 01/24/2007, indicating that the aphotic zones are below 5 and 9 m. Already during the second stage of sampling (01/08/ 2007), the depth of the Secchi Disk was 9 m to 10 m, with a photic zone of 10 and 12 m for the points P1 and P2, respectively. With these results it was possible to iden- tify the trophic zone for both sampling sites increased 50% (P1) and 33% (P2) for the driest period. This dif- ference can be attributed to a larger input of suspended sediment entering the Itupararanga Reservoir in the rainy season due to the laminar erosion and, consequently, reducing waters clarity and the photic zone. Table 1. Quality of surface water in the Itupararanga Res- ervoir in wet period: 01/24/2007. DO TP Point EC (S/cm) Temp (˚C) pH (mg/L) Cl (g/L) TSI 1 60.00 26.707.00 5.20 0.18 8.49 62 2 60.00 27.307.20 7.00 0.20 27.8169 3 60.00 27.907.50 8.10 0.14 9.23 60 4 60.00 27.107.60 8.60 0.19 13.9065 5 70.00 27.907.50 8.30 0.15 6.38 59 6 70.00 28.907.50 7.70 0.15 6.22 59 7 60.00 27.207.60 8.40 0.14 4.95 57 8 70.00 27.907.50 8.10 0.11 4.14 55 9 70.00 27.207.70 7.70 0.11 2.11 51 10 70.00 27.207.50 7.10 0.10 2.11 51 11 70.00 28.207.50 7.30 0.09 1.75 49 12 70.00 26.607.60 7.60 0.09 1.62 49 13 70.00 28.007.60 7.40 0.10 0.67 45 14 70.00 27.507.60 7.70 0.11 2.48 52 15 70.00 28.507.50 7.80 0.09 1.19 47 16 70.00 26.307.70 7.90 0.09 1.27 47 17 70.00 28.307.70 7.80 0.11 0.83 47 18 70.00 27.507.70 7.90 0.11 0.51 44 19 70.00 26.807.70 7.90 0.08 0.84 44 20 50.00 26.607.60 8.00 0.07 0.99 44 Copyright © 2013 SciRes. JWARP 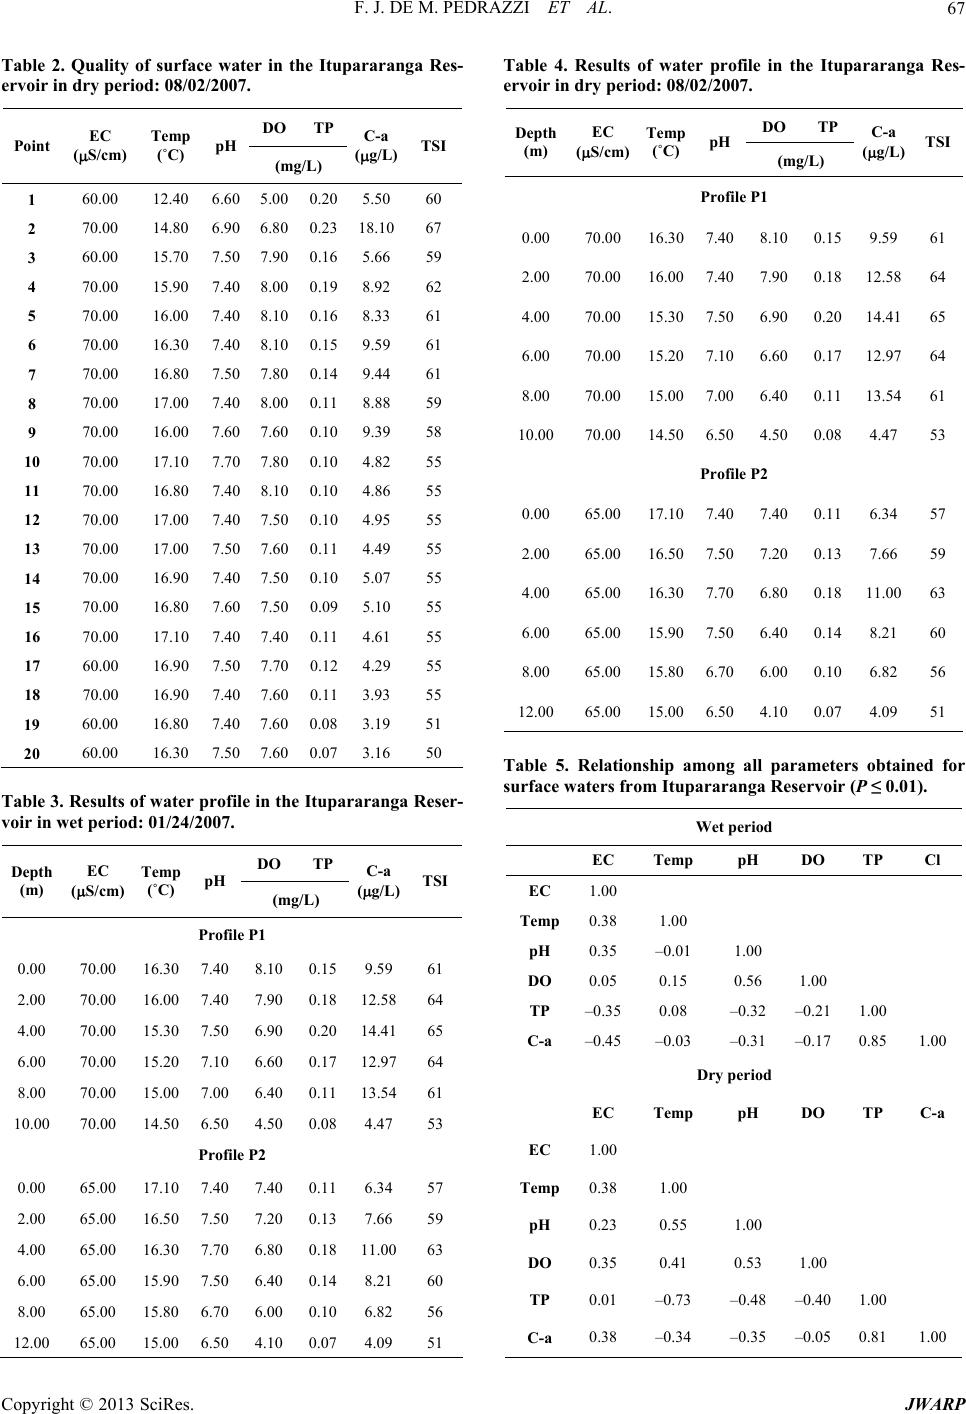 F. J. DE M. PEDRAZZI ET AL. 67 Table 2. Quality of surface water in the Itupararanga Res- ervoir in dry period: 08/02/2007. DO TP Point EC (S/cm) Temp (˚C) pH (mg/L) C-a (g/L) TSI 1 60.00 12.40 6.605.00 0.20 5.50 60 2 70.00 14.80 6.906.80 0.23 18.1067 3 60.00 15.70 7.507.90 0.16 5.66 59 4 70.00 15.90 7.408.00 0.19 8.92 62 5 70.00 16.00 7.408.10 0.16 8.33 61 6 70.00 16.30 7.408.10 0.15 9.59 61 7 70.00 16.80 7.507.80 0.14 9.44 61 8 70.00 17.00 7.408.00 0.11 8.88 59 9 70.00 16.00 7.607.60 0.10 9.39 58 10 70.00 17.10 7.707.80 0.10 4.82 55 11 70.00 16.80 7.408.10 0.10 4.86 55 12 70.00 17.00 7.407.50 0.10 4.95 55 13 70.00 17.00 7.507.60 0.11 4.49 55 14 70.00 16.90 7.407.50 0.10 5.07 55 15 70.00 16.80 7.607.50 0.09 5.10 55 16 70.00 17.10 7.407.40 0.11 4.61 55 17 60.00 16.90 7.507.70 0.12 4.29 55 18 70.00 16.90 7.407.60 0.11 3.93 55 19 60.00 16.80 7.407.60 0.08 3.19 51 20 60.00 16.30 7.507.60 0.07 3.16 50 Table 3. Results of water profile in the Itupararanga Reser- voir in wet period: 01/24/2007. DO TP Depth (m) EC (S/cm) Temp (˚C) pH (mg/L) C-a (g/L) TSI Profile P1 0.00 70.00 16.30 7.40 8.10 0.15 9.5961 2.00 70.00 16.00 7.40 7.90 0.18 12.5864 4.00 70.00 15.30 7.50 6.90 0.20 14.4165 6.00 70.00 15.20 7.10 6.60 0.17 12.9764 8.00 70.00 15.00 7.00 6.40 0.11 13.5461 10.00 70.00 14.50 6.50 4.50 0.08 4.4753 Profile P2 0.00 65.00 17.10 7.40 7.40 0.11 6.3457 2.00 65.00 16.50 7.50 7.20 0.13 7.6659 4.00 65.00 16.30 7.70 6.80 0.18 11.0063 6.00 65.00 15.90 7.50 6.40 0.14 8.2160 8.00 65.00 15.80 6.70 6.00 0.10 6.8256 12.00 65.00 15.00 6.50 4.10 0.07 4.0951 Table 4. Results of water profile in the Itupararanga Res- ervoir in dry period: 08/02/2007. DO TP Depth (m) EC (S/cm) Temp (˚C) pH (mg/L) C-a (g/L) TSI Profile P1 0.00 70.00 16.307.40 8.10 0.15 9.5961 2.00 70.00 16.007.40 7.90 0.18 12.5864 4.00 70.00 15.307.50 6.90 0.20 14.4165 6.00 70.00 15.207.10 6.60 0.17 12.9764 8.00 70.00 15.007.00 6.40 0.11 13.5461 10.0070.00 14.506.50 4.50 0.08 4.4753 Profile P2 0.00 65.00 17.107.40 7.40 0.11 6.3457 2.00 65.00 16.507.50 7.20 0.13 7.6659 4.00 65.00 16.307.70 6.80 0.18 11.0063 6.00 65.00 15.907.50 6.40 0.14 8.2160 8.00 65.00 15.806.70 6.00 0.10 6.8256 12.0065.00 15.006.50 4.10 0.07 4.0951 Table 5. Relationship among all parameters obtained for surface waters from Itupararanga Reservoir (P ≤ 0.01). Wet period EC Temp pH DO TP Cl EC 1.00 Temp 0.38 1.00 pH 0.35 –0.01 1.00 DO 0.05 0.15 0.56 1.00 TP –0.350.08 –0.32 –0.21 1.00 C-a –0.45–0.03 –0.31 –0.17 0.85 1.00 Dry period EC Temp pH DO TP C-a EC 1.00 Temp 0.38 1.00 pH 0.23 0.55 1.00 DO 0.35 0.41 0.53 1.00 TP 0.01 –0.73 –0.48 –0.40 1.00 C-a 0.38 –0.34 –0.35 –0.05 0.81 1.00 Copyright © 2013 SciRes. JWARP 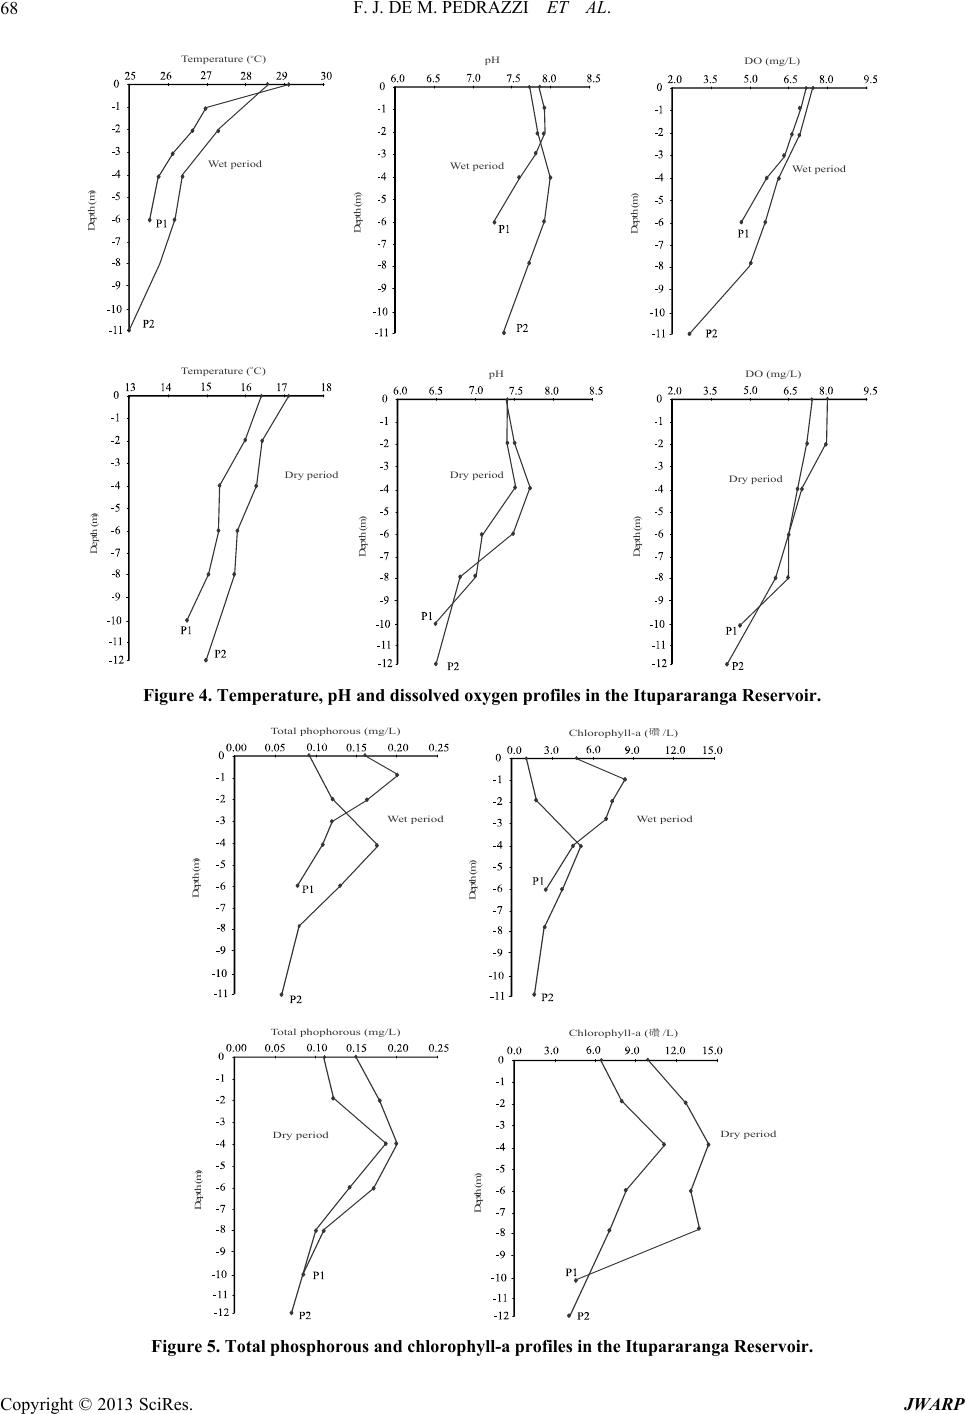 F. J. DE M. PEDRAZZI ET AL. Copyright © 2013 SciRes. JWARP 68 Temperature ( C) o Depth (m) Wet period Temperature ( C) o Depth (m) Dry period DO (mg/L) Depth (m) Dry period DO (mg/L) Depth (m) Wet period Depth (m) pH Dry period Depth (m) p H Wet period Figure 4. Temperature, pH and dissolved oxygen profiles in the Itupararanga Reservoir. Total phophorous (mg/L) Depth (m) Wet period Depth ( m) 礸 Chlorophyll-a ( / L) Wet period Depth (m) Dry period Total phophorous (mg/L) Depth (m) Dry period 礸 Chlorophyll-a (/L) Figure 5. Total phosphorous and chlorophyll-a profiles in the Itupararanga Reservoir.  F. J. DE M. PEDRAZZI ET AL. 69 The electrical conductivity depending on temperature and amount of dissolved ions present. The electrical conductivity parameter does not determine specifically which ions are present in a given sample of water, but can contribute to possible recognition of environmental impacts that occur in the drainage basin. The conductivity values are presented fairly constant throughout the reservoir and in the vertical profiles in both seasons, ranging between 60 and 70 μS/cm. This same behavior was also found by Mariani [6] for Riacho Grande Reservoir, which is the compound that supplies the Billings, located in the metropolitan area of São Paulo. Studies such as Calijuri et al. [7], Bicudo et al. [8] and Mariani [6] conducted in eutrophic reservoirs especially for industrial and domestic sewage, showed values above 150 μS/cm for electrical conductivity in these reservoirs. Thus, the results of electrical conductiv- ity can be considered low for surface water, indicating that the Itupararanga Reservoir still has good quality of water. Temperature is a determining factor in driving the reactions that affect the chemical, physical and biological processes and thus have an enormous influence on bio- logical activity and growth of aquatic organisms. With the temperature change, algae and photosynthetic micro- organisms may distance themselves from the water sur- face by migration or even death. It is observed that in the rainy season, water temperature at the surface is consi- derably greater than in the dry season, i.e. variation be- tween 26.30˚C to 28.90˚C and 12.40˚C to 17.10˚C, respectively. In the dry period is noted an increase of about 4˚C between point 1 and 20, due to collection start the morning with cooler temperatures, and end in the afternoon, with heating this shell throughout the day due to higher solar radiation. According to Tundisi [9], the stratification of the water column must be greater in summer, which can be found in both vertical profiles studied, i.e., stratification of about 3.5˚C and 2.0˚C during wet and dry periods, respectively. Moreover, for both profiles, the higher temperature were characterized in samples collected near the surface, as also found for the Rio das Pedras Reservoir [10]. In other studies performed in Brazilian reservoirs, usually the lowest temperature are characterized on the water surface, due to air temperature and intensity of local wind, as was the case of the Rio Paranapanema Lake/SP [11], Jurumirim Reservoir/SP [12], Lobo Reservoir/SP [13] and Riacho Grande Reservoir/SP [6]. The pH is a measure of balance between of hydroxyl (OH–) and hydrogen ions (H+), being used to identify whether a solution is acidic, neutral or basic. With respect to pH, there is close relationship between plant and animal communities and aquatic. On communities, the pH is directly involved in the processes of cell membrane permeability, thereby interfering in the ionic transport within the cell, and between organisms and the environ- ment. The criteria to protect aquatic life that set the range of pH should be ranging from 6 to 9, as established in Brazil for surface water Class II [1]. All pH values ob- tained for the Itupararanga Reservoir in horizontal and vertical scaling are proposed within this range. The higher pH values, both at horizontal or vertical scales, occurred during the rainy season. In horizontal scale, it is observed that the lower pH values in both samples were always obtained between points 1 and 2, being these values close to the Sorocaba River before it enters the Itupararanga Reservoir, where has a charge of domestic effluents. In the other sampling points there was small variation in pH values remained between 7.50 and 7.70 and 7.40 and 7.60 for wet and dry seasons, respectively. The in- crease in pH may be due to photosynthetic activity oc- curring in the Itupararanga Reservoir, which removes CO2 and 3 HCO , and tamper with the carbonate buffer system. Vertical scale for both sites and sampling periods, it is possible to observe a slight stratification in pH, which remained practically constant in the first meters of water column, with a gradual decrease until the deeper sites, located in the aphotic zone. The lower pH values in the regions close to the bottom of the reservoir are expected due to chemical oxidation of organic matter by anaerobic bacteria, as already observed in Riacho Grande Reservoir [6]. Among the dissolved gases in water, oxygen is one of the most important parameter to dynamic characteriza- tion of aquatic ecosystems. The main sources of oxygen to water are the atmosphere and photosynthesis. On the other hand, the losses are due to consumption by the decomposition of organic matter (oxidation), exchanges in the atmosphere, respiration of aquatic organisms and oxidation of metal ions, such as iron and manganese. Samples collected in both sampling periods indicates the dissolved oxygen concentration in horizontal and vertical scale values were above 5.0 mg/L, minimum value established by CONAMA 357 to Class II waters [1]. The exception was for the sampling points in vertical scale located in the aphotic zone, where the dissolved oxygen values were always below 5.0 mg/L. The lowest levels of dissolved oxygen in both horizontal and vertical scale occurred in the dry season, in the points 1 and 2 due to decomposition of organic matter from the domestic wastewater of Ibiúna. After this region, the dissolved oxygen values increase along the reservoir, being this fact attributed to photosynthetic activity. The values of dissolved oxygen concentration in vertical scale decrease with depth. According to Tundisi [9] and Lampert and Sommer [14], in many cases, a decreasing gradient of temperature causes a decreasing gradient of Copyright © 2013 SciRes. JWARP 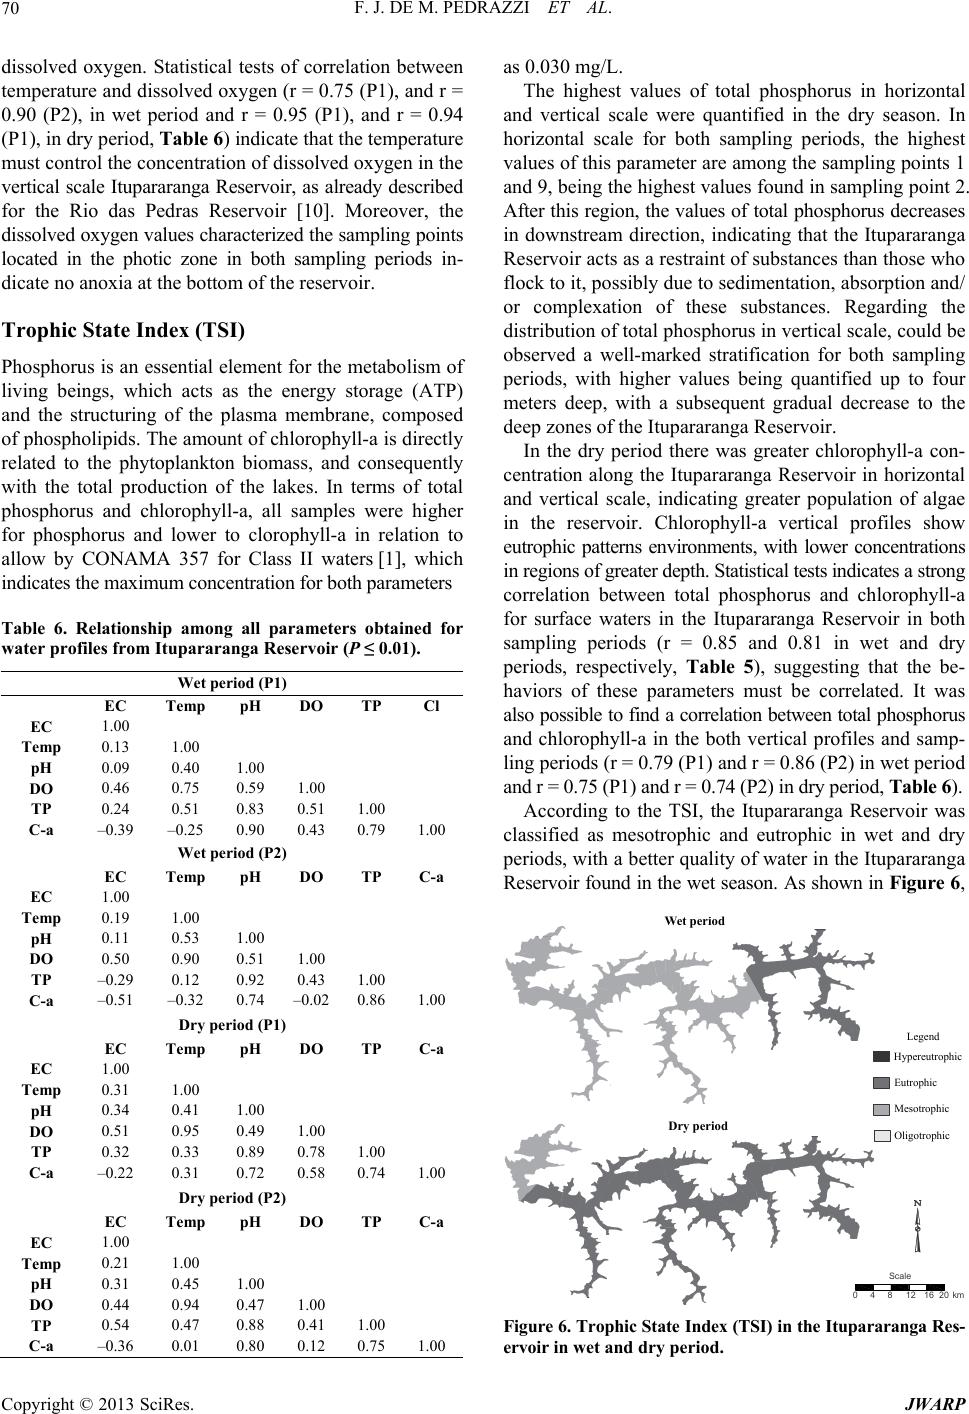 F. J. DE M. PEDRAZZI ET AL. 70 dissolved oxygen. Statistical tests of correlation between temperature and dissolved oxygen (r = 0.75 (P1), and r = 0.90 (P2), in wet period and r = 0.95 (P1), and r = 0.94 (P1), in dry period, Table 6) indicate that the temperature must control the concentration of dissolved oxygen in the vertical scale Itupararanga Reservoir, as already described for the Rio das Pedras Reservoir [10]. Moreover, the dissolved oxygen values characterized the sampling points located in the photic zone in both sampling periods in- dicate no anoxia at the bottom of the reservoir. Trophic State Index (TSI) Phosphorus is an essential element for the metabolism of living beings, which acts as the energy storage (ATP) and the structuring of the plasma membrane, composed of phospholipids. The amount of chlorophyll-a is directly related to the phytoplankton biomass, and consequently with the total production of the lakes. In terms of total phosphorus and chlorophyll-a, all samples were higher for phosphorus and lower to clorophyll-a in relation to allow by CONAMA 357 for Class II waters [1], which indicates the maximum concentration for both parameters Table 6. Relationship among all parameters obtained for water profiles from Itupararanga Reservoir (P ≤ 0.01). Wet period (P1) EC Temp pH DO TP Cl EC 1.00 Temp 0.13 1.00 pH 0.09 0.40 1.00 DO 0.46 0.75 0.59 1.00 TP 0.24 0.51 0.83 0.51 1.00 C-a –0.39 –0.25 0.90 0.43 0.791.00 Wet period (P2) EC Temp pH DO TP C-a EC 1.00 Temp 0.19 1.00 pH 0.11 0.53 1.00 DO 0.50 0.90 0.51 1.00 TP –0.29 0.12 0.92 0.43 1.00 C-a –0.51 –0.32 0.74 –0.02 0.861.00 Dry period (P1) EC Temp pH DO TP C-a EC 1.00 Temp 0.31 1.00 pH 0.34 0.41 1.00 DO 0.51 0.95 0.49 1.00 TP 0.32 0.33 0.89 0.78 1.00 C-a –0.22 0.31 0.72 0.58 0.741.00 Dry period (P2) EC Temp pH DO TP C-a EC 1.00 Temp 0.21 1.00 pH 0.31 0.45 1.00 DO 0.44 0.94 0.47 1.00 TP 0.54 0.47 0.88 0.41 1.00 C-a –0.36 0.01 0.80 0.12 0.751.00 as 0.030 mg/L. The highest values of total phosphorus in horizontal and vertical scale were quantified in the dry season. In horizontal scale for both sampling periods, the highest values of this parameter are among the sampling points 1 and 9, being the highest values found in sampling point 2. After this region, the values of total phosphorus decreases in downstream direction, indicating that the Itupararanga Reservoir acts as a restraint of substances than those who flock to it, possibly due to sedimentation, absorption and/ or complexation of these substances. Regarding the distribution of total phosphorus in vertical scale, could be observed a well-marked stratification for both sampling periods, with higher values being quantified up to four meters deep, with a subsequent gradual decrease to the deep zones of the Itupararanga Reservoir. In the dry period there was greater chlorophyll-a con- centration along the Itupararanga Reservoir in horizontal and vertical scale, indicating greater population of algae in the reservoir. Chlorophyll-a vertical profiles show eutrophic patterns environments, with lower concentrations in regions of greater depth. Statistical tests indicates a strong correlation between total phosphorus and chlorophyll-a for surface waters in the Itupararanga Reservoir in both sampling periods (r = 0.85 and 0.81 in wet and dry periods, respectively, Table 5), suggesting that the be- haviors of these parameters must be correlated. It was also possible to find a correlation between total phosphorus and chlorophyll-a in the both vertical profiles and samp- ling periods (r = 0.79 (P1) and r = 0.86 (P2) in wet period and r = 0.75 (P1) and r = 0.74 (P2) in dry period, Table 6). According to the TSI, the Itupararanga Reservoir was classified as mesotrophic and eutrophic in wet and dry periods, with a better quality of water in the Itupararanga Reservoir found in the wet season. As shown in Figure 6, Wet per i od Dry period Oligotrophic Mesotrophic Hypereutrophic Eutrophic Legend Scale 04812 16 20 k m Figure 6. Trophic State Index (TSI) in the Itupararanga Res- ervoir in wet and dry period. Copyright © 2013 SciRes. JWARP  F. J. DE M. PEDRAZZI ET AL. Copyright © 2013 SciRes. JWARP 71 the points with higher values of TSI in the Itupararanga Reservoir, in both sampling periods, where observed mainly among the sampling points 1 up to 4, causing excessive growth of aquatic autotrophs, making harder the navigation in this section due to green algae blooms. This fact is directly linked to the Sorocaba River, which before discharging in the Itupararanga Reservoir, suffers severe environmental impacts, affecting their qua- lity. The Ibiúna city does not possess effluents treatment planning, and, disposes almost 100% of domestic and industrial effluents into the Una River. The Sorocabuçu and Sorocamirim rivers do not pass through any urban center. However, these rivers receive diffuse pollutants due to the vegetables crops (cabbage, lettuce, potatoes, and tomatoes, among others) and presence of small vil- lages along its length and livestock [15]. Finally, there is an improvement in quality of water after the sampling point 4, mainly in wet period. There are two explanations for the increase in the TSI value in dry period, as already evidenced in Ponte Nova- Alto Tietê [16] and Rio Grande-Billings Complex [6]. The first explanation is due to rapid eutrophication of the Itupararanga Reservoir caused by the land use of the Upper Alto Sorocaba basin. The second explanation is the algae persistence in this reservoir, which were proli- ferated and spread throughout the summer. However, the chlorophyll-a concentration must decrease until the next summer together with the water temperature of the Itu- pararanga Reservoir. Only a more detailed study with a monthly sampling during one or two complete hydrologi- cal cycles can confirm which of the hypotheses should be accepted. 5. Acknowledgements The authors thank CAPES for the scholarship to F. J. M. Pedrazzi, and the Ibiúna municipally police and SOS Itu- pararanga for the operational support during this study. REFERENCES [1] CONAMA (Conselho Nacional do Meio Ambiente), “Re- solução No 357, de 17 de Março de 2005,” CONAMA, MMA, Brasília, 2005. [2] A. M. Godoy, “Estudos Geológicos das Rochas granitói- des e Metamórficas e Suas Aplicações Como Rochas Or- namentais e de Revestimento: Sistematização Crítica da Produção Técnico-Científica,” Tese de Livre Docência, IGCE, UNESP, Rio Claro, 2003. [3] CBA (Companhia Brasileira de Alumínio), “Dados de Vazão e Precipitação. Estação Meteorológica na Represa de Itupararanga,” Votorantim (SP), Relatório Interno, 2006. [4] R. G. Wetzel and G. E. Likens, “Limnological Analises,” 2nd Edition, Springer Verlag, New York, 1991. [5] CETESB (Companhia de Tecnologia de Saneamento Ambiental), “Relatório de Qualidade das Águas Interiores do Estado de São Paulo, 2007,” SMA, São Paulo, 2008. [6] C. F. Mariani, “Reservatório Rio Grande: Caracterização Limnológica da Água e Biodisponibilidade de Metais- Traço No Sedimento,” Tese de Doutorado, USP, São Paulo, 2006. [7] M. C. A. Calijuri, G. L. B. Deberdt and R. T. Minoti, “A Produtividade Primária Pelo Fitoplâncton Na Represa de Salto Grande,” In: R. Henry, Ed., Ecologia de Reser- vatórios: Estrutura, Função e Aspectos Sociais, FUNDI- BIO/FAPESP, Botucatu, 1990, pp. 109-148. [8] D. C. Bicudo, M. C. Forti, F. C. D. Carmo, C. Bourotte, C. E. M. Bicudo, J. A. Melfi and Y. Lucas, “A Atmosfera, as Águas e Os Reservatórios Do PEFI: Caracterização Quí- mica,” In: D. C. Bicudo, M. C. Forti and C. E. M. Bicudo, Eds., Parque Estadual das Fontes de Ipiranga (PEFI): Unidade de Conservação Que Resiste à Urbanização de São Paulo, SMA, São Paulo, 2000, pp. 161-200. [9] J. G. Tundisi, “Impactos Ecológicos da Construção de Represas: Aspectos Específicos e Problemas de Manejo,” In: J. G. Tundisi, T. Matsumura-Tundisi, R. Henry, O. Rocha and K. Hino, Eds., Limnologia e Manejo de Re- presas, EESC-USP/ CRHEA/ACIESP, São Carlos, 1988. [10] P. R. Padial, M. L. M. Pompêo and V. Moschini-Carlos, Heterogeneidade Espacial e Temporal da Qualidade da Água No Reservatório Rio das Pedras (Complexo Billigs, São Paulo),” Revista Ambienta e Água, Vol. 4, No. 3, 2009, pp 35-53. doi:10.4136/ambi-agua.101 [11] V. Moschini-Carlos, M. L. M. Pompêo and R. Henry, “Caracterização Limnológica de Uma Baia Marginal ao Rio Paranapanema (Zona de Desembocadura Na Represa de Jurumirim, SP),” Acta Limnologica Brasiliensia, Vol. 10, No. 2, 1998, pp. 1-19. [12] R. Henry, E. D. Carvalho, M. G. Nogueira, M. L. Pompêo, V. Moschini-Carlos, C. M. Santos, S. C. Luciano and C. Y. Fujihara, “The Jurumirim Reservoir,” Proceedings of XXVI International Congress of Limnology, São Paulo, 1995, pp. 13-33. [13] A. J. Deberdt, “Variação Nictimeral de Variáveis Lim- nológicas No Reservatório de Salto Grande (Americana- SP),” Dissertação de Mestrado, EESC, USP, São Carlos, 1999. [14] W. Lampert and U. Sommer, “Limnoloecology: The Eco- logy of Lakes and Streams,” Oxford University Press, Oxford, 1997. [15] D. S. Sardinha, F. T. Conceição, D. M. Bonotto, M. H. D. Salles and V. A. Angelucci, “Avaliação do Balanço An- ual de Cátions e Ânions Na Bacia Do Alto Sorocaba (SP),” Revista Brasileira de Geociências, Vol. 38, No. 4, 2008, pp. 730-740. [16] A. J. M. Junior, “Caracterização Limnológica e Comparti- mentação do Reservatório de Ponte Nova,” Alto Tietê/SP, Tese de doutorado, USP, São Paulo, 2006. |