

Paper Menu >>
Journal Menu >>
 Journal of Water Resource and Protection, 2013, 5, 54-63 http://dx.doi.org/10.4236/jwarp.2013.51007 Published Online January 2013 (http://www.scirp.org/journal/jwarp) Water Quality in the Gaza Strip: The Present Scenario Medhat Abbas1, Maurizio Barbieri2*, Maria Battistel2*, Giuditta Brattini3, Angelica Garone2*, Barbara Parisse2 1El Shifa Hospital, Ministery of Health, Gaza, Palestine 2Department of Earth Science, University of Rome “Sapienza”, Rome, Italy 3“Gazzella” Onlus Association, Italy Email: *[email protected], *[email protected], *[email protected] Received October 8, 2012; revised November 10, 2012; accepted November 18, 2012 ABSTRACT The Gaza Strip is one of the most densely populated areas in the world, 4505 people per km2 and the only source of water is represent by groundwater. The water quality in Gaza is very poor and the groundwater is affected by many dif- ferent contaminants sources including soil/water interaction in the unsaturated zone due to recharge and return flows, mobilization of deep brines, sea water intrusion or upcoming and disposal of domestic and industrial wastes into the aquifer. Previous reports on the water quality in Gaza discussed the high levels of major ions (especially of chloride, nitrate and fluoride) in the drinking water. Moreover, little or no information is available for trace elements in the groundwater of the Gaza Strip. The sources of trace elements in groundwater could be natural and anthropogenic. 58 wells were sampled during July 2010, and were analyzed major ions and trace elements to check if the water quality is improving from the previous report. This study has revealed that no groundwater in Gaza Strip meets all WHO drinking water standards. The contaminants which affected the Gaza Strip are of different types and they originate from different sources. The environmental conditions are no safe for the population and some actions to improve the groundwater conditions are necessary to safeguard the population. Keywords: Gaza; Drinking Water; Trace Elements; Population Safety; Food Security 1. Introduction A constant monitoring of groundwater in Gaza Strip is crucial: the groundwater is the only source of water in this area. Municipal groundwater wells are currently be- ing used for drinking and domestic purposes while pri- vate wells are being used for irrigation and its should be sampled 2 - 4 times a year for the analysis of anions, cations, trace elements and pesticides [1]. The water qual- ity in Gaza is affected by many different water sources including soil/water interaction in the unsaturated zone due to recharge and return flows, mobilization of deep brines, sea water intrusion or upcoming and disposal of domestic and industrial wastes into the aquifer [2]. Pre- vious reports on the water quality in Gaza [1,4] discussed the high levels of major ions (especially of chloride, ni- trate and fluoride) in the drinking water. Moreover, little or no information is available for trace elements in the groundwater of the Gaza Strip. The sources of trace ele- ments in groundwater could be natural and anthropogenic. The distribution of trace elements in groundwater is con- tinuously reset by complex geochemical processes (e.g., equilibrium and non-equilibrium water/solid interactions, advection, dispersion, absorption, precipitation, co-pre- cipitation, chelation, colloidal interaction) and biological processes [3]). This paper study the composition of the groundwater few years after the war events (2006-2008/2009) that af- fected years after the war events (2006-2008/2009) that affected the Gaza Strip. The results were compared to the last published studies regarding the drinkable of ground- water [1,4]. In 2002 Shomar [1] analyzed the waters of 71 municipal and 21 private wells used for drinking and domestic purposes. The results show that the 89% of water wells are not considered usable for drinking pur- poses, especially for the worrisome concentrations of chlorine, fluoride and nitrates that exceed the guidelines of the World Health Organization (WHO) [5]. As for trace elements results show high concentrations of zinc, lead, arsenic and cadmium. Shomar [1] proposed interventions ranged from fre- quent monitoring wells and implementation of studies, on the correlation between the incidence of some dis- eases and pollutants, the development of a strategy for disposal of waste that would prevent contamination of groundwater. *Corresponding authors. The aim of this paper is to check the quality of stream C opyright © 2013 SciRes. JWARP 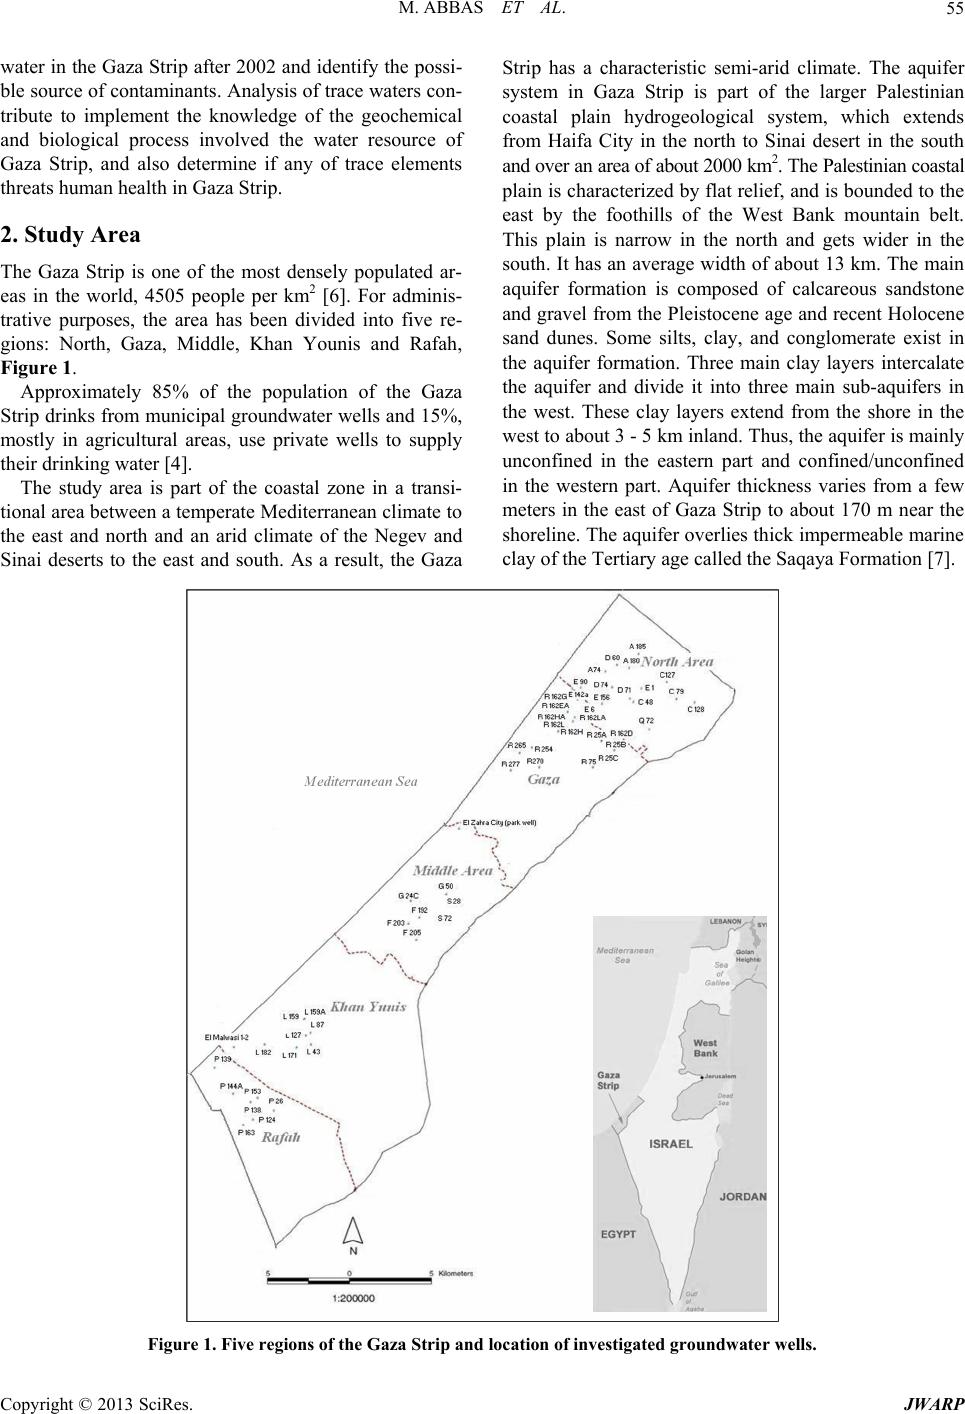 M. ABBAS ET AL. 55 water in the Gaza Strip after 2002 and identify the possi- ble source of contaminants. Analysis of trace waters con- tribute to implement the knowledge of the geochemical and biological process involved the water resource of Gaza Strip, and also determine if any of trace elements threats human health in Gaza Strip. 2. Study Area The Gaza Strip is one of the most densely populated ar- eas in the world, 4505 people per km2 [6]. For adminis- trative purposes, the area has been divided into five re- gions: North, Gaza, Middle, Khan Younis and Rafah, Figure 1. Approximately 85% of the population of the Gaza Strip drinks from municipal groundwater wells and 15%, mostly in agricultural areas, use private wells to supply their drinking water [4]. The study area is part of the coastal zone in a transi- tional area between a temperate Mediterranean climate to the east and north and an arid climate of the Negev and Sinai deserts to the east and south. As a result, the Gaza Strip has a characteristic semi-arid climate. The aquifer system in Gaza Strip is part of the larger Palestinian coastal plain hydrogeological system, which extends from Haifa City in the north to Sinai desert in the south and over an area of about 2000 km2. The Palestinian coastal plain is characterized by flat relief, and is bounded to the east by the foothills of the West Bank mountain belt. This plain is narrow in the north and gets wider in the south. It has an average width of about 13 km. The main aquifer formation is composed of calcareous sandstone and gravel from the Pleistocene age and recent Holocene sand dunes. Some silts, clay, and conglomerate exist in the aquifer formation. Three main clay layers intercalate the aquifer and divide it into three main sub-aquifers in the west. These clay layers extend from the shore in the west to about 3 - 5 km inland. Thus, the aquifer is mainly unconfined in the eastern part and confined/unconfined in the western part. Aquifer thickness varies from a few meters in the east of Gaza Strip to about 170 m near the shoreline. The aquifer overlies thick impermeable marine clay of the Tertiary age called the Saqaya Formation [7]. Figure 1. Five regions of the Gaza Strip and location of investigated groundw ate r wells. Copyright © 2013 SciRes. JWARP 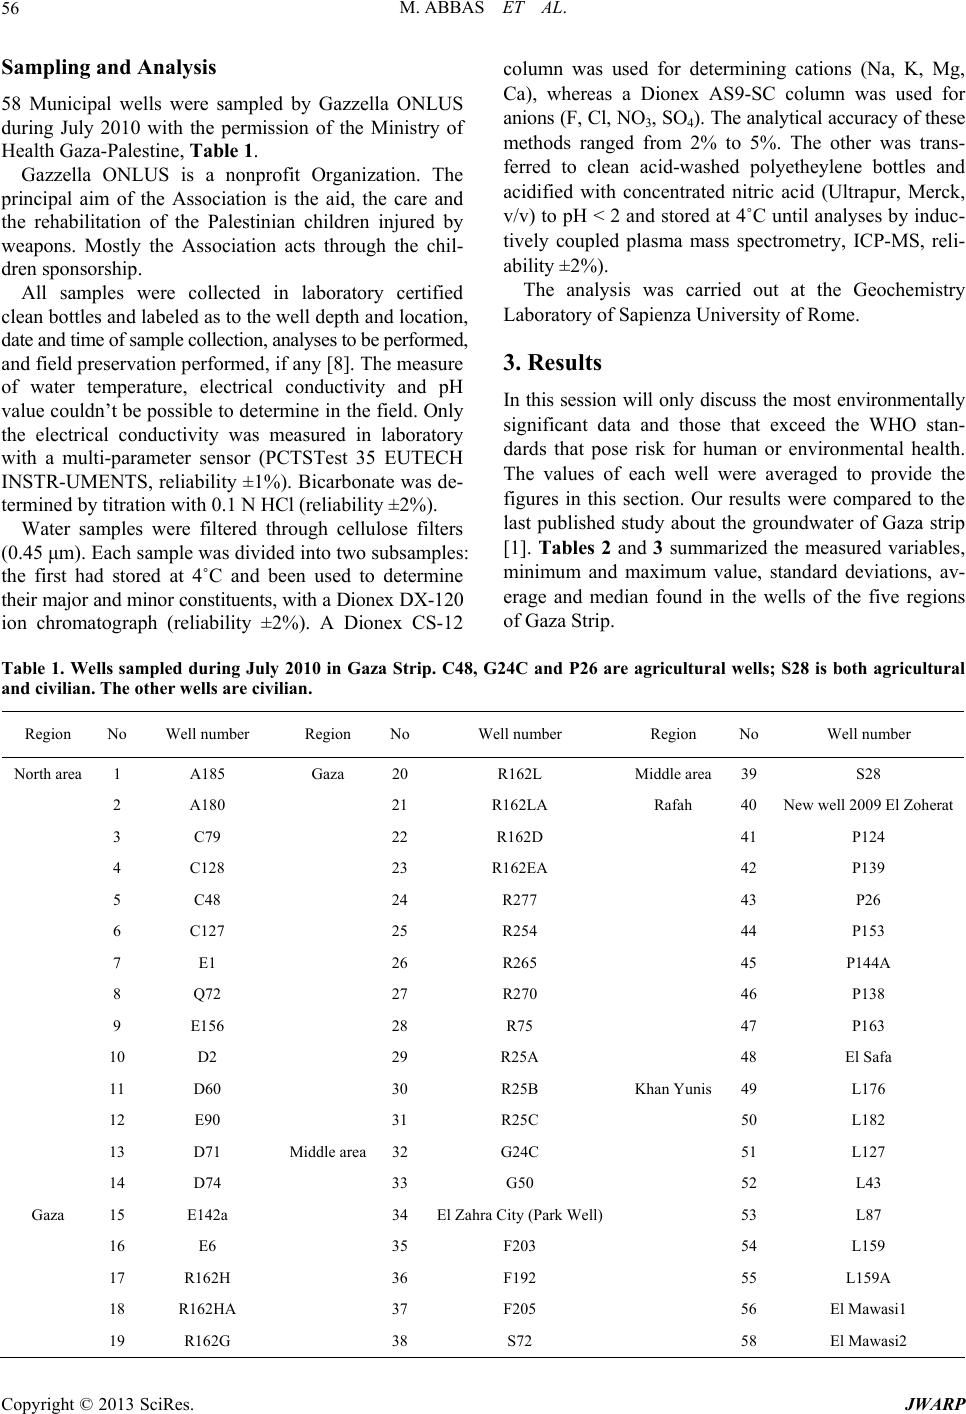 M. ABBAS ET AL. 56 Sampling and Analysis 58 Municipal wells were sampled by Gazzella ONLUS during July 2010 with the permission of the Ministry of Health Gaza-Palestine, Table 1. Gazzella ONLUS is a nonprofit Organization. The principal aim of the Association is the aid, the care and the rehabilitation of the Palestinian children injured by weapons. Mostly the Association acts through the chil- dren sponsorship. All samples were collected in laboratory certified clean bottles and labeled as to the well depth and location, date and time of sample collection, analyses to be performed, and field preservation performed, if any [8]. The measure of water temperature, electrical conductivity and pH value couldn’t be possible to determine in the field. Only the electrical conductivity was measured in laboratory with a multi-parameter sensor (PCTSTest 35 EUTECH INSTR-UMENTS, reliability ±1%). Bicarbonate was de- termined by titration with 0.1 N HCl (reliability ±2%). Water samples were filtered through cellulose filters (0.45 μm). Each sample was divided into two subsamples: the first had stored at 4˚C and been used to determine their major and minor constituents, with a Dionex DX-120 ion chromatograph (reliability ±2%). A Dionex CS-12 column was used for determining cations (Na, K, Mg, Ca), whereas a Dionex AS9-SC column was used for anions (F, Cl, NO3, SO4). The analytical accuracy of these methods ranged from 2% to 5%. The other was trans- ferred to clean acid-washed polyetheylene bottles and acidified with concentrated nitric acid (Ultrapur, Merck, v/v) to pH < 2 and stored at 4˚C until analyses by induc- tively coupled plasma mass spectrometry, ICP-MS, reli- ability ±2%). The analysis was carried out at the Geochemistry Laboratory of Sapienza University of Rome. 3. Results In this session will only discuss the most environmentally significant data and those that exceed the WHO stan- dards that pose risk for human or environmental health. The values of each well were averaged to provide the figures in this section. Our results were compared to the last published study about the groundwater of Gaza strip [1]. Tables 2 and 3 summarized the measured variables, minimum and maximum value, standard deviations, av- erage and median found in the wells of the five regions of Gaza Strip. Table 1. Wells sampled during July 2010 in Gaza Strip. C48, G24C and P26 are agricultural wells; S28 is both agricultural and civilian. The other wells are civilian. Region No Well number Region NoWell number Region No Well number North area 1 A185 Gaza 20R162L Middle area39 S28 2 A180 21R162LA Rafah 40 New well 2009 El Zoherat 3 C79 22R162D 41 P124 4 C128 23R162EA 42 P139 5 C48 24R277 43 P26 6 C127 25R254 44 P153 7 E1 26R265 45 P144A 8 Q72 27R270 46 P138 9 E156 28R75 47 P163 10 D2 29R25A 48 El Safa 11 D60 30R25B Khan Yunis49 L176 12 E90 31R25C 50 L182 13 D71 Middle area 32G24C 51 L127 14 D74 33G50 52 L43 Gaza 15 E142a 34El Zahra City (Park Well) 53 L87 16 E6 35F203 54 L159 17 R162H 36F192 55 L159A 18 R162HA 37F205 56 El Mawasi1 19 R162G 38S72 58 El Mawasi2 Copyright © 2013 SciRes. JWARP 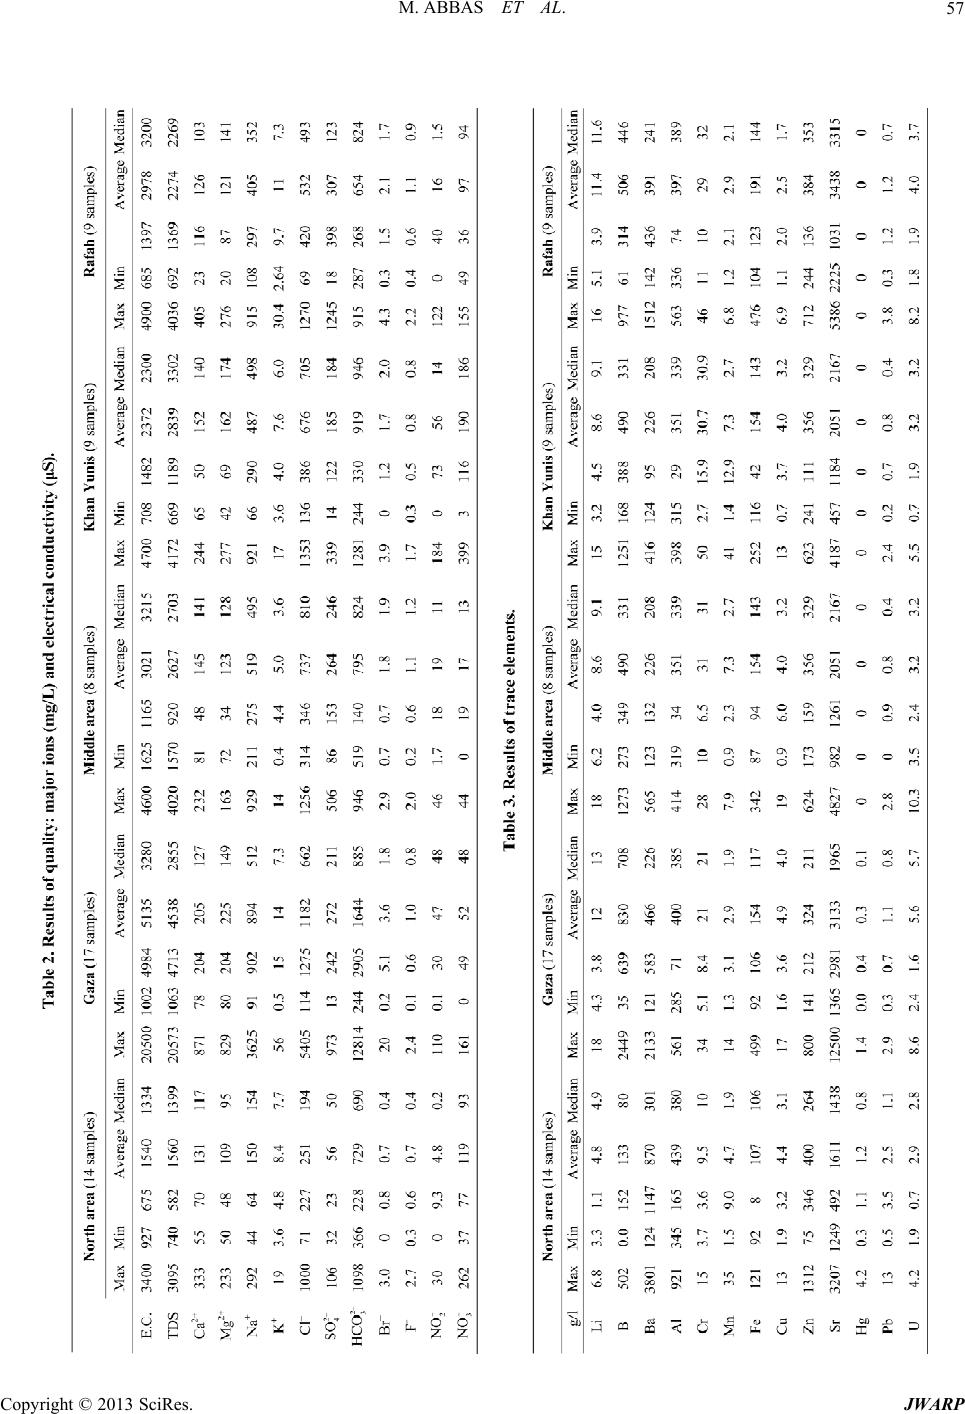 M. ABBAS ET AL. 57 Copyright © 2013 SciRes. JWARP  M. ABBAS ET AL. JWARP 58 3.1. General Physical-Chemical Parameters 3.2. Major Anions and Cations Figure 2 shows the values of TDS in five region of the Gaza strip for each wells monitored during 2010. The lowest average values of TDS were measured in the North area (1560 mg/L ), while the highest average value of TDS were estimated in Gaza area, 4538 mg/L, Table 1. This is in agreement with the findings of Shomar [1] about the general trend of TDS, but the values we meas- ured in 2010 appear to be higher than those measured by Shomar [1]. Except for a few wells distributed in Gaza strip, the majority of wells exceed the WHO standards for TDS (1000 mg/L). R162D, situated in Gaza city, is the well is one in which has the highest level, more than 20,000 mg/L. Except for a few wells in North Area region, all wells sampled showed high to very high concentration of the major ions, Table 2. The Piper diagram, Figure 3, shows that the wells’ groundwater fall into two different idro- geochemical facies: North area has Ca-HCO3 waters typi- cal of shallow fresh groundwater and the other region have sodium-chlorine waters indicating that the Gaza Strip aquifer suffer a mixing between fresh water and seawater. The 60% of the wells sampled showed nitrate levels above the WHO standard of 50 mg/L, Table 4 and Fig- ure 4. The average concentrations of NO3 are 189, 118, 97, 52 and 17 in the Khan Yunis, North area, Rafah, Figure 2. Variation of TDS concentrations in the groundwater wells of the Gaza Strip. Table 4. Percentage of wells which has major ions above WHO standards. Comparison between 2010 and 2002. Above WHO (%) Parameter WHO (mg/l) 2010 2002a TDS 1000 88 63 Na 200 67 53 Cl 250 71 54 SO4 250 28 14 F 1.05 17 20 NO2 3 59 n.a. NO3 50 60 90 Figure 3. Piper plot showing the average composition of Gaza Strip groundwater. aShomar 2006 [1]. Copyright © 2013 SciRes.  M. ABBAS ET AL. 59 Figure 4. Variation of NO3 and NO2 concentrations in the groundwater wells of the Gaza Strip. Gaza and the Middle area, respectively. Some of wells situated in Khan Yunis, Rafah and North area the con- centrations of nitrate can exceed for 3 - 9 times the WHO standard. However the percentage of wells which exceed the WHO standards for nitrate decreased compared to 2002, Ta bl e 4. Nitrite average concentrations in the Gaza aquifer ranged from 4.8 until 56 mg/L. The results stress a concentration above the WHO standards in some wells of Gaza, Rafah and Khan Yunis. The lowest average values of chlorine were measured in North area (251 mg/L), while the highest average values were estimated in Gaza (1182 mg/L). The trend of this data is in agree- ment with the previous data. The maximum value of chlorine was measured in Gaza and it was 5405 mg/L; so, the minimum value of this one was estimated in Rafah and it was 69 mg/L. The 71% of the wells sampled showed chlorine levels above the WHO standard of 250 mg/L, Table 4 and Figure 5. However the percentage of wells which exceed the WHO standards for chlorine in- creased compared to 2002, Table 4. The average concentration of fluoride in the ground- water in the Gaza Strip is no higher than the WHO stan- dard (1.5 mg/L). Only the 17% of the wells monitored showed fluoride concentration above the WHO standard of 1.5 mg/L. The percentage of wells which exceed the WHO standards for fluoride decreased compared to 2002, Table 4 and Figure 6 The most affected zones are Mid- dle area (1.1 mg/L) and Rafah (1.1 mg/L). So, the maxi- mum value of fluoride was measured in North area and it was 2.7 mg/L; the minimum value of this one was esti- mated in Gaza and it was 0.1 mg/L. The highest average values of SO4 were in Rafah (307 mg/L), while the low- est average values were in North area (56 mg/L). So, the most of the wells in north area had SO4 levels less than the WHO standard (250 mg/L). The 28% of the wells monitored showed sulfates concentration above the WHO standard. The percentage of wells which exceed the WHO standards for sulfates doubled compared to 2002, Table 4. The lowest average values of Na were found in the north (150 mg/L) and the highest average values of this one were in the region of Gaza (894 mg/L). The 67% of the wells monitored showed sodium levels above the WHO standard of 200 mg/L, Table 4 and Figure 5. So, the maximum value of sodium was measured in Gaza and it was 3625 mg/L; the minimum value of this one was estimated in North area and it was 44 mg/L. Most of wells analyzed for K showed the average value more than 5 mg/l. The highest average value of K was measured in Gaza (14 mg/L), followed by the aver- age value of K in Rafah. The minimum value of K was estimated in Middle area and it was 0.4 mg/L. The Rafah wells showed the lowest average values of calcium (126 mg/L), while the region of Gaza well had the highest average value of Ca (205 mg/L). The North area wells showed the lowest average values of Mg (109 mg/L), while the region of Gaza well had the highest average value of Mg (225 mg/L). 3.3. Trace Elements Table 3 shows the results of trace elements and summa- rized the measured variables, minimum and maximum value, standard deviations, average and median found in the wells of the five regions of Gaza Strip. Table 5, in- stead, shows the percentage of wells which have trace elements above WHO standards, during 2010. Copyright © 2013 SciRes. JWARP  M. ABBAS ET AL. 60 Figure 5. Variation of Cl– and Na– concentrations in the groundwater wells of the Gaza Strip. Figure 6. Variation of F-concentrations in the groundwater wells of the Gaza Strip. Table 5. Percentage of wells which have trace elements above WHO standards, during 2010. Parameter (μg/l) WHO Above WHO (%)b Al 200 100 B 500 41.4 Cr 50 1.7 Fe 300 8.6 Hg 1 12.1 Pb 10 1.7 bWHO 2010 [6]. The most striking case concerns the concentration of aluminum in 2010 compared with that measured by Shomar in 2002. Our results show that 100% of the wells sampled have a higher concentration of aluminum to the WHO standard of 200 µg/L, Table 5. The lowest average values of Al were measured in Middle area and in Khan Yunis (both with 351 µg/L), while the highest average values were estimated in North area (439 µg/L) this one was estimated in the same area and it was 2.7 µg/L, Ta- ble 3. The maximum value of Al was measured in North area and it was 921 µg /L; the minimum value of this one was estimated in Gaza and it was 285 µg/L. It is clear that from 2002 to 2010 aluminum in groundwater of the Copyright © 2013 SciRes. JWARP  M. ABBAS ET AL. 61 Strip has increased compared to 2002. Also the concen- tration of Hg measured by Shomar in 2002 shows very low values. In 2010, the 12.1% of the wells monitored showed mercury levels above the WHO standard of 1 µg/L, Table 5. Hg concentrations averaged 0.3 to 1.2 µg/L. The maximum value of Hg was measured in North area and it was 4.2 µg/L; the minimum value of this one was estimated in Gaza and it was 1.4 µg/L. In Middle area, Khan Yunis and Rafah, Hg was not found in any of the sampled wells. Generally, the Fe concentration were lower than the WHO standard (300 µg/L) and only the 8.6% of the wells monitored showed Fe levels above the WHO stan- dard, Table 5. Fe concentrations averaged 107 to 191 µg/L. The maximum value of Fe was measured in Gaza and it was 499 µg/L; the minimum value of this one was estimated in Middle area and it was 87 µg/L, Table 3 . So, the 1.7% of the wells monitored showed both Cr and Pb levels above the WHO standard of 50 and 10 µg/L, re- spectively, Table 5. The average concentration of Cr in the southern area of Gaza Strip (Khan Yunis and Rafah) was higher than those of the northern area and these data are in agreement with the previous data presented. However, the average concentration of chromium in 2010 de- creased slightly compared to 2002. The maximum value of Cr was measured in Khan Yunis (50 µg/L); the mini- mum value of Pb concentrations averaged 0.8 to 2.5 µg/L then most of the wells had Pb less than WHO standard (10 µg/L). The maximum value of Pb was measured in North area and it was 13 µg/L; the minimum value of this one was estimated in Khan Yunis (0.2 µg/L), Table 3. All wells had Ba less the WHO standard (700 µg/L) except in the North area where its average concentration corresponds to 870 µg/L. The results about the other trace elements are not dis- cussed in this session because they do not exceed the WHO standard and are not dangerous to human health. 4. Discussion The Gaza Strip is one of the most densely populated in the world: 4505 inhabitants per km2, with a growth rate of around 3% [9]. Over 90% of the population benefits of drinking water supplied from municipal water mains while the remaining 10% of the population lives in rural area and uses private wells. The exploitation of ground- water is expected to grow and it is therefore necessary to develop an appropriate management plan, primarily to prevent further deterioration of an already impaired water resource, but also in an attempt to improve the current state. More than 50% of wells sampled showed Na levels higher than WHO standard (200 mg/L). Groundwater of most areas is hard and this could indicate the origin and geochemical characteristics of the groundwater system in Gaza. The aquifer is composed mainly of sand, sandstone and conglomerate strata of Pleistocene age [1]. Also the proximity of wells to the coastline makes the Gaza aqui- fer is impacted by contaminants from seawater intrusion. Sodium has the same trend of chlorine. The wells near the coastline in Gaza region (R162LA, R162D, R162EA) are affected by seawater, than they have high values of E.C. (respectively 9910, 20500, 13450 μS), TDS, Figure 2, Na and Cl, Figure 3, and Bromine (respectively 8.6, 20, 11 mg/L). One of the problems affecting the popula- tion of the Gaza Strip is dental fluorosis [10]. The sources of fluorides in the groundwater of Gaza Strip are believed to be natural bedrock that supplies the fluoride ions to the water. Maybe, there are other factors to be involved in the development of dental fluorosis. These factors revolve around the intake of fluoride from dietary sources such as the consumption of fish and tea [10]. This study shows that the 17% of wells are contaminated by high concentrations of fluoride, favoring the occur- rence of health problems associated with fluoride. According to this study the 60% of the wells analyzed exceeded the WHO standards as regard nitrate. Nitrate in contaminated water is known to cause methemoglobinemia in infants [11]. The association of diarrhea and acidosis with methemoglobinemia is more common than previously thought and can produce dan- gerously high methemoglobin levels [12-15]. Shomar [16] proposed that the excess NO3 in the groundwater of the Gaza Strip occurred as a results of NO3 leaching from irrigation, wastewater septic tanks, sewage sludge, ani- mal manure and synthetic fertilizers. Moreover the high values of nitrites in Gaza area, Khan Yunis and Rafah suggest that the source of nitrogenous compounds con- tamination is near the wells, so the nitrite didn’t yet un- dergo the oxidation process. The findings of this study show that the 100% of wells exceeded the WHO standards regarding aluminum con- centrations. The results of the only published study about trace elements in the Gaza Strip [1] reported that all the wells monitored during 2002 had an aluminum concen- tration below the WHO standards. As well as Hg and Ba where found to be less than the WHO standard during the monitoring reported by Shomar in 2002. This study de- tects that 41.4% and 8.6% of the 58 wells sampled in 2010 has a concentrations of respectively B and Hg higher than the WHO standards. Besides many of the agricultural wells have openings large surface area (greater than 1 m), where petroleum products, fertilizers, or any other substance can easily contaminate the aquifer, through carelessness or accident. In general, the greatest threat to the aquifer from these wells appear to be petroleum products or pesticides, since both of these products tend to be stored in well construction or during the application of pesticides, farmers spray, eat and smoke, disregarding Copyright © 2013 SciRes. JWARP  M. ABBAS ET AL. 62 the general spraying instructions [1]. This study has re- vealed that the state of contamination of the Gaza Strip, despite the recommendations of Shomar, has not im- proved. Between trace elements there is also a high con- centration of boron related to states of pollution due to civil and industrial discharges. Chlorine, fluoride, nitrite and nitrate are still above the limits set by WHO at times showing a decline compared to the analyses conducted in 2002 by Shomar. It is well known that the presence of metal particles is able to enter, in soluble form in the natural environment, as soil and water. The toxicity of mercury (Hg) has been linked to seri- ous reactions that occur in the central nervous system and during fetal development [17]. Aluminum (Al) accumu- lates in the brain, kidneys, lungs, thyroid, liver, bones and intestines is recognized as a potentially harmful metal fetotoxic. Aluminum (Al) has been the most inten- sively studied neurotoxic substance [18]. Lead can cause kidney damage and nervous system impairment. The po- pulation of the Gaza Strip who lives in precarious condi- tions, in direct contact with soil/water/air, is exposed at risk of coming into contact with poisonous substances through the skin, respiratory and through food (agricul- tural products). Drinking water is one of the major sources of human exposure to lead [19,20]. Lead par- ticularly targets the nervous system, blood and kidney [19] distal motor neuropathy and possibly seizures and coma [21]. Infants and small children are more sensitive to the effects of lead, which moreover is transported through the placenta to the fetus [22]. Lead accumulation in fetuses and small children might cause developmental disruption in terms of neurological impairment characterized by a decrease of cognitive fac- ulties, which can be reversible or not, evaluated by psy- chomotor tests such as the verbal IQ (Intellectual Quo- tient) test [23]. The period when IQ is most affected is from birth to/about 4 years of age [24] Health effects of metal contamination, even at low levels, are only begin- ning to understand and study their effects. For that it is needed to pay attention to the data presented in this study demonstrate that the risk from exposure to toxins and pollutants that can cause cancer and reproductive prob- lems, but specially can have serious consequences on children. 5. Conclusions This study has revealed that the state of contamination of the Gaza Strip, despite the recommendations of Shomar [1], has not improved. No groundwater in Gaza Strip meets all WHO drinking water standards. The contami- nants which affected the Gaza Strip are of various kind and they originate from different sources. The percentage of wells which present concentrations of chlorine and sodium above the WHO standards has increased from 2002 to 2010, Table 4, in Gaza Strip. The aquifer is contaminated and not recharging adequately. The coastal aquifer is the main source of drinking water and seawater intrusion in the coastal aquifer is still a problem for the population health. Pesticides and fertilizers are one of the main sources of contaminations. Pesticides compositions and their exces- sive use contaminated the groundwater with nitrate, ni- trite, chlorine and trace elements. Despite high level of Al in all wells analysed could be due to the large use of pesticides, several studies should be conducted to find other possible sources (of Al and the other trace metals) and minimize the health risk assessment. Some actions should carry out on several fronts: Groundwater constant monitoring which integrated the analysis of biological, organics and inorganic con- taminants; Wastewater and solid waste management; Setting up a management system for use of pesticides and fertilizers through safe storage and safe applica- tion training; Proper maintenance and cleaning of the areas sur- rounding the wells; Management of groundwater withdrawal in the areas vulnerable seawater intrusion. Searching for an alternative resource of water is one of the primarily action which should be carry out. Meanwhile private tube water filter or drinkable water point of distribution could be a short term solution. To reduce the over exploitation of groundwater the rain water should be collected and used for agricultural purpose It is necessary to keep in mind that the armed attacks cause environmental contamination [25]. We keep still little into consideration the fact that the attacks with no-conventional weapons have an impact on the environmental and consequently on the population with devastating consequences on the health and repro- duction, even and especially in the long term. Some of the initiatives are extremely important to safeguard the population: a) Develop the knowledge to counteract the long-term effects of such attacks by deploying structures for risk of attacks on people’s health and reproduction. Therefore operate for an inquiry on the risk of exposure to genotoxic materials of war. b) Assumption of responsibility for the scientific com- munity to continue to investigate the nature of the weap- ons used to understand how to treat the victims and the effects of environmental contamination. 6. Acknowledgements Thanks for the collaboration to Ayman Elramlawi M.o.H. Water Control Department and to the Organisation Pal- Copyright © 2013 SciRes. JWARP  M. ABBAS ET AL. Copyright © 2013 SciRes. JWARP 63 estinian Medial Relief Society-Gaza Palestine. REFERENCES [1] B. Shomar, “Groundwater of the Gaza Strip: Is It Drink- able?” Environmental Geology, Vol. 50, No. 5, 2006, pp. 743-751. doi:10.1007/s00254-006-0246-9 [2] S. Ghabayen, M. S. McKee and M. Kemblowski, “Ionic and Isotopic Ratios for Identification of Salinity Sources and Missing Data in the Gaza Aquifer,” Journal of Hy- drology, Vol. 318, No. 1-4, 2006, pp. 360-373. doi:10.1016/j.bbr.2011.03.031 [3] W. D. Newcomb and J. D. Rimstidt, “Trace Element Dis- tribution in US Groundwaters: A Probabilistic Assess- ment Using Public Domain Data,” Applied Geochemistry, Vol. 17, No. 1, 2002, pp. 49-57. doi: 10.1016/S0883-2927(01)00089-0 [4] B. Shomar, A. Yahya and G. Müller, “Potential Use of Treated Wastewater and Sludge in the Agricultural Sector of the Gaza Strip,” Technologies and Environmental Pol- icy, Vol. 6, No. 2, 2004, pp. 128-137. doi:10.1007/s10098-003-0228-5 [5] WHO, “Guidelines for Drinking-Water Quality,” 2010. http://www.WHO.int [6] PCBS, “Population, Housing and Establishment Census 2012,” Palestinian National Authority, Palestinian Central Bureau of Statistics, Ramallah, 2012. [7] Metcalf and Eddy, “Costal Aquifer Management Pro- gram,” Final Report: Modeling of Gaza Strip Aquifer, US Agency for International Development (USAID) and Pal- estinian Water Authority (PWA), Gaza, 2000. [8] APHA, “Standard Methods for the Examination of Water and Wastewater,” 19th Edition, American Public Health Association, Washington DC, 1995. [9] Central Intelligence Agency, “The World Fact Book,” 2012. http://www.CIA.gov [10] B. Shomar, G. Muller, A. Yahya, S. Askar and R. Sansur, “Fluorides in Groundwater, Soil and Infused Black Tea and the Occurrence of Dental Fluorosis among School Children of the Gaza Strip,” Journal of Water and Health, Vol. 2, No. 1, 2003, pp. 23-35. [11] A. Avery, “Infantile Methemoglobinemia: Reexamining the Role of Drinking Water Nitrates,” Environmental Health Perspectives, Vol. 107, No. 7, 1999, pp. 583-586. [12] T. Lebby, J. Roco and E. Arcinue, “Infantile Methemo- globinemia Associated with Acute Diarrheal Illness,” American Journal of Emergency Medicine, Vol. 11, No. 5, 1993, pp. 471-472. doi:10.1016/j.bbr.2011.03.031 [13] A. Avery, “Cause of Methemoglobinemia: Illness versus Nitrate Exposure,” Environmental Health Perspectives, Vol. 109, No. 1, 2001, pp. A12-A14. [14] R. J. Freishtat, J. M. Chamberlain, C. M. S. Johns, S. J. Teach, C. Ronzio, M. M. Murphy-Smith and N. Gor, “A Cross-Sectional ED Survey of Infantile Subclinical Meth- emoglobinemia,” American Journal of Emergency Medi- cine, Vol. 23, No. 4, 2005, pp. 574-576. doi:10.1016/j.ajem.2004.12.008 [15] R. Venkateswari, R. Ganesh, M. Deenadayalan, E. Ma- hender, B. Ramachandran and L. Janakiraman, “Transient Methemoglobinemia in an Infant,” The Indian Journal of Pediatrics, Vol. 74, No. 11, 2007, pp. 1037-1038. doi:10.1007/s12098-007-0192-x [16] B. Shomar, K. Osenbrückb and A. Yahyaa, “Elevated Nitrate Levels in the Groundwater of the Gaza Strip: Dis- tribution and Sources,” Science of the Total Environment, Vol. 398, No. 1-3, 2008, pp. 164-174. doi:10.1016/j.scitotenv.2008.02.054 [17] M. E. Crespo-López, G. L. Macêdo, S. I. D. Pereira, G. P. F. Arrifano, D. L. W. Picanço-Dinizc, J. L. M. do Nasci- mento and A. M. Herculano, “Mercury an Human Ge- notoxicity: Critical Considerations and Possible Molecu- lar Mechanisms,” Pharmacological Research, Vol. 60, No. 4, 2009, pp. 212-220. doi:10.1016/j.phrs.2009.02.011 [18] G. F. Craun, “Review of Epidemiologic Studies of Alu- minium and Neurologic Disorders,” Environmental Geo- chemistry and Health, Vol. 12, No. 1-2, 1990, pp. 125- 135. doi:10.1007/BF01734062 [19] INERIS (Institut National de l’Environnement Industriel et des Risques), “Plomb et ses Dérivés, in Fiche de Don- nées Toxicologiques et Environnementales des Substances Chimiques,” INERIS, Paris, pp. 1-90. [20] R. Fertmann, S. Hentschel, D. Dengler, U. Jan and A. Lommel, “Lead Exposure by Drinking Water: An Epide- miological Study in Hamburg,” International Journal of Hygiene and Environmental Health, Vol. 207, No. 3, 2004, pp. 235-244. doi:10.1078/1438-4639-00285 [21] M. Robson, “Methodologies for Assessing Exposures to Metals: Human Host Factors,” Ecotoxicology and Envi- ronmental Safety, Vol. 56, No. 1, 2003, pp. 104-109. doi:10.1016/S0147-6513(03)00054-X [22] R. Cleymaet, K. Collys, D. H. Retief, Y. Michotte, D. Slop, E. Taghon, W. Maex and D. Coomans, “Relation between Lead in Surface Tooth Enamel, Blood, and Sa- liva from Children Residing in the Vicinity of a Non Fer- rous Metal Plant in Belgium,” British Journal of Indus- trial Medicine, Vol. 48, No. 10, 1991, pp. 702-709. doi:10.1136/oem.48.10.702 [23] Académie des Sciences, “Contamination des Sols par les Éléments Traces: Les Risques et Leur Gestion,” Rapport No. 42, Lavoisier Tec&Doc, Paris, 1998, p. 440. [24] G. C. M. Watt, A. Britton, H. G. Gilmour, M. R. Moore, G. D. Murray and S. J. Robertson, “Public Health Impli- cations of New Guidelines of Lead in Drinking Water: A Case Study in an Area with Historically High Water Lead Levels,” Food and Chemical Toxicology, Vol. 38, No.1, 2000, pp. 573-579. [25] UNEP, “Protecting the Environment during Armed Con- flict an Inventory and Analysis of International Law,” United Nations Environment Programme, 2009. http://www.unep.org |