

Paper Menu >>
Journal Menu >>
 Open Journal of Composite Materials, 2013, 3, 7-15 http://dx.doi.org/10.4236/ojcm.2013.31002 Published Online January 2013 (http://www.scirp.org/journal/ojcm) Characterization of Reinforced Carbon Composites with Full Field Measurements: Long Gauge Length Compressive Apparatus Mathieu Colin de Verdiere1,2*, Alexandros A. Skordos1, Andrew Walton3 1Composites Centre, Cranfield University, Cranfield, UK; 2Fluid Structure Interaction, School of Engineering, Southampton Univer- sity, Hampshire, UK; 3Cranfield Impact Center, Cranfield, UK. Email: *[email protected] Received September 2nd, 2012; revised October 15th, 2012; accepted October 27th, 2012 ABSTRACT A new compressive testing apparatus is developed and used in this research. It has long gauge length to allow digital image correlation monitoring and anti buckling guides to prevent buckling. It allows the optical recording of strains and displacements. The novel setup is used to study the compressive response of tufted and untufted Carbon non crimp fab- ric composites with full field measurements. Experimental results show that the specimens are not bending in the appa- ratus under compression. Results also show reduced strain concentrations and a large strain field that provides a good environment for material compressive stiffness characterization. The test proves particularly successful for bias direc- tion layup of [+45/−45] for which large damage mechanism occurs. However for [0/90] specimens a scatter in com- pressive ultimate strength was noticed which is due to the difficulty to prepare specimens with best minute accurate geometry. The compressive apparatus has shown to be a good alternative to existing setups and to provide significantly more information as well as having the possibility to be used in dynamics with a drop tower. Keywords: Carbon Composite; Compression Testing; Full Field Measurements 1. Introduction Composite structures undergo complex deformations depending on the laminate design, part geometry and the loading itself. Such structures are subjected to in-plane tension, shear, compression and out of plane stresses. In order to simulate the material response for structural de- sign purposes, tensile, shear, compression, and out of plane data are required and gathered from tests. Com- pression testing remains difficult compared to other sets of tests as specimen misalignments, material defects, and poor specimen geometry lead to premature catastrophic failure at the specimen level not representative of the material itself. Compressive loading of polymeric com- posites is often characterized by damage occurrence such as micro buckling (axial) and matrix cracking (bias di- rection) mechanism. Many researchers investigated these responses through better compressive apparatus designs allowing better specimen characterization. Meanwhile in the last ten years digital image correlation (DIC) has gain accuracy and a more trouble-free usage due to better al- gorithms and optics. It can provide full field information exceeding the strain gauges elongation. The method is often used in tension to characterize polymeric materials through failure strain and stiffness measurements. As stiffness and damage in compression is much different than in tension the need to investigate this difference with a full field experimental approach is of interest. Current compressive apparatus do not allow good use of full field measurements in compression as the specimens are often too small or direct view is diverted by the com- pressive apparatus. In this research a new compressive testing setup was designed that allowed the use of full field digital image correlation on polymeric composites and provided added information on compressive failure, compressive strain, compressive stiffness and compres- sive damage behavior. The capacity of the apparatus has been introduced briefly in [1] but is presented in this pa- per in greater detail. The paper reviews existing com- pressive apparatus first and then describes the new com- pressive design. Subsequently, results using a modified standard apparatus and the new compressive apparatus on standard and tufted non crimp fabric composites are reported. Finally, the results are discussed and com- pared to the published literature. Conclusions on the va- lidity of the tests and the material response are presented. *Corresponding author. Copyright © 2013 SciRes. OJCM 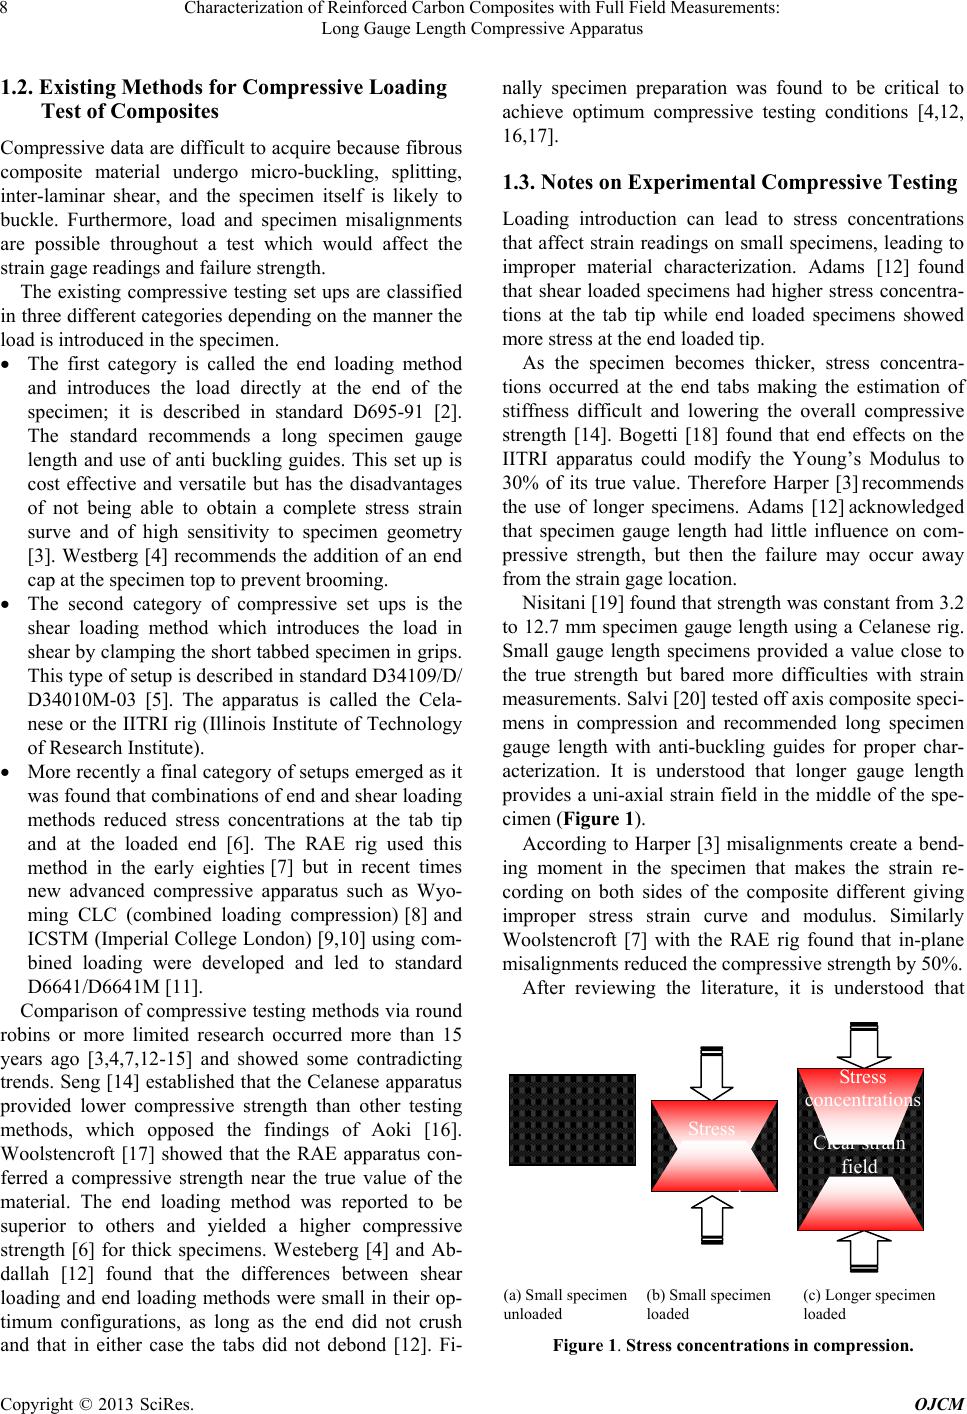 Characterization of Reinforced Carbon Composites with Full Field Measurements: Long Gauge Length Compressive Apparatus 8 1.2. Existing Methods for Compressive Loading Test of Composites Compressive data are difficult to acquire because fibrous composite material undergo micro-buckling, splitting, inter-laminar shear, and the specimen itself is likely to buckle. Furthermore, load and specimen misalignments are possible throughout a test which would affect the strain gage readings and failure strength. The existing compressive testing set ups are classified in three different categories depending on the manner the load is introduced in the specimen. The first category is called the end loading method and introduces the load directly at the end of the specimen; it is described in standard D695-91 [2]. The standard recommends a long specimen gauge length and use of anti buckling guides. This set up is cost effective and versatile but has the disadvantages of not being able to obtain a complete stress strain surve and of high sensitivity to specimen geometry [3]. Westberg [4] recommends the addition of an end cap at the specimen top to prevent brooming. The second category of compressive set ups is the shear loading method which introduces the load in shear by clamping the short tabbed specimen in grips. This type of setup is described in standard D34109/D/ D34010M-03 [5]. The apparatus is called the Cela- nese or the IITRI rig (Illinois Institute of Technology of Research Institute). More recently a final category of setups emerged as it was found that combinations of end and shear loading methods reduced stress concentrations at the tab tip and at the loaded end [6]. The RAE rig used this method in the early eighties [7] but in recent times new advanced compressive apparatus such as Wyo- ming CLC (combined loading compression) [8] and ICSTM (Imperial College London) [9,10] using com- bined loading were developed and led to standard D6641/D6641M [11]. Comparison of compressive testing methods via round robins or more limited research occurred more than 15 years ago [3,4,7,12-15] and showed some contradicting trends. Seng [14] established that the Celanese apparatus provided lower compressive strength than other testing methods, which opposed the findings of Aoki [16]. Woolstencroft [17] showed that the RAE apparatus con- ferred a compressive strength near the true value of the material. The end loading method was reported to be superior to others and yielded a higher compressive strength [6] for thick specimens. Westeberg [4] and Ab- dallah [12] found that the differences between shear loading and end loading methods were small in their op- timum configurations, as long as the end did not crush and that in either case the tabs did not debond [12]. Fi- nally specimen preparation was found to be critical to achieve optimum compressive testing conditions [4,12, 16,17]. 1.3. Notes on Experimental Compressive Testing Loading introduction can lead to stress concentrations that affect strain readings on small specimens, leading to improper material characterization. Adams [12] found that shear loaded specimens had higher stress concentra- tions at the tab tip while end loaded specimens showed more stress at the end loaded tip. As the specimen becomes thicker, stress concentra- tions occurred at the end tabs making the estimation of stiffness difficult and lowering the overall compressive strength [14]. Bogetti [18] found that end effects on the IITRI apparatus could modify the Young’s Modulus to 30% of its true value. Therefore Harper [3] recommends the use of longer specimens. Adams [12] acknowledged that specimen gauge length had little influence on com- pressive strength, but then the failure may occur away from the strain gage location. Nisitani [19] found that strength was constant from 3.2 to 12.7 mm specimen gauge length using a Celanese rig. Small gauge length specimens provided a value close to the true strength but bared more difficulties with strain measurements. Salvi [20] tested off axis composite speci- mens in compression and recommended long specimen gauge length with anti-buckling guides for proper char- acterization. It is understood that longer gauge length provides a uni-axial strain field in the middle of the spe- cimen (Figure 1). According to Harper [3] misalignments create a bend- ing moment in the specimen that makes the strain re- cording on both sides of the composite different giving improper stress strain curve and modulus. Similarly Woolstencroft [7] with the RAE rig found that in-plane misalignments reduced the compressive strength by 50%. After reviewing the literature, it is understood that Clear strain field Stress concentrations Stress tti (a) Small specimen unloaded (b) Small specimen loaded (c) Longer specimen loaded Figure 1. Stress concentrations in compression. Copyright © 2013 SciRes. OJCM  Characterization of Reinforced Carbon Composites with Full Field Measurements: Long Gauge Length Compressive Apparatus 9 most compressive apparatus have been designed specifi- cally to reduce the scatter in ultimate strength of the ma- terial, and only in secondary for compressive modulus or strain measurements. For practical reasons many resear- chers use an extensometer to characterize the specimen compressive displacement from which they compute an overall strain to avoid gluing a small strain gauge on such reduced specimen size. 1.4. Compressive Failure and Damage Composite materials have lower properties in compres- sion than in tension because of catastrophic instability via microbuckling, inter laminar shear failure [10], and stress concentrations near the tabs [19]. Failure is initi- ated by local shear, followed by delamination and buck- ling of layer [3,21]. Berbinau [15] found that kink bands were initiated at the laminate free edge, at a void, or at points of high fibre curvature. As microbuckling occurs due to the buckling of fibres whilst kink bands are formed at peak stress when the matrix is deformed plas- tically [22]. The best model to predict microbukling was the Xu-Reifsnider model [23] and to predict kink bands the Budiansky model [22]. 2. Experimental Procedures and Apparatus 2.1. New Compressive Testing Apparatus Light reflection on the specimen can make the calibration of the optical system difficult and time consuming. Therefore the new compressive apparatus is designed to provide maximum and regular enlightenment of the sam- ple (Figure 2). The specimen is loaded via end and shear loading at the bottom end, while it is simply end loaded at the top end. In order to improve the end load introduc- tion in the composite and reduce stress concentration, 1.5 mm aluminum tabs are added at each end of the speci- men. To prevent any delamination or splitting a cap is added on top of the composite. Anti-buckling guides are composed of steel struts 3 × 5× 50 mm (Figure 3). Possible specimen thicknesses that can be tested vary (a) Drawing view (c) Apparatus with specimen Figure 2. Long gauge length compressive rig. from 1 to 4.5 mm. The specimen length is 80 mm, the width 25 mm and the gauge length can vary from 70 to 60 mm. 2.2. Specimens Specimens are manufactured from carbon fibres and ep- oxy resin. TENAX HTA 6 K carbon fibre arranged in a NCF (Non CrimpFAbric) of 540 g/m2 areas density with a +/−45 degrees bi-diagonal architecture are used. Some of the specimens are reinforced through the thickness by tufting with a 1K carbon thread and 5 × 5 mm density. The matrix is RTM6 resin. The specimens are made via resin infusion at high temperature. Specimens are sprayed in white and black paint to form a speckle pattern (Fi- gure 3). Paint dot positions are recorded and interpreted throughout the tests with 2 cameras. The layups and size of specimens are reviewed in Table 1 for the different test configurations. 2.3. Strain and Displacement Recording Strain gauges measurements are limited by the gauge size and the maximum deformation they can hold before failing and the necessity of gluing and wiring them. An alternative solution such as DICM is more time consum- ing in data post processing but it provides further infor- mation as strain and displacement are monitored on the whole surface. Optical strain field measurement requires the use of one camera (in 2D) or two cameras (in 3D); the latest provides the opportunity to check for out of plane deformation with positions and angles of the cam- eras computed via pictures recorded with a calibration target (Figure 4(a)). The camera position and light intensity are important features of the design of the new compressive set up (Figure 4). Optical recording provides vertical displace- Aluminium Composite Aluminium (a) Steel anti buckling guides (b) End cap (c) Schematics of specimen with tabs and speckle pattern Figure 3. Anti buckling guide cap and specimen. Table 1. Apparatus and specimen used. Lay up Specimen size Specimen gauge lenght Specimen numbers [0/90]6s and [+45]6s 80 - 72 mm±55 mm 35 Copyright © 2013 SciRes. OJCM  Characterization of Reinforced Carbon Composites with Full Field Measurements: Long Gauge Length Compressive Apparatus 10 ment on the specimen area. The large strain field also permits to analyze the specimen failure in compression throughout the loading using several strain extraction methods (Table 2). This permits to gain useful informa- tion such as possible bending or strain concentration on the specimen that could invalidate the tests. Displace- ment data can be extracted in specified locations such as top and bottom of the specimen from which an overall strain can be calculated. If bending or misalignments occur then the two extractions technique yields signifi- cant difference. Comparing the two measurements can be used to check that the specimen is not bending and that the test is valid. 3. Experimental Results The long compressive apparatus provides a long area of interest that allowed the characterization of [0/90] and [+45/−45] tufted and untufted specimens. The strain field allows the identification of maximum strains regions which are in agreement with the locations of specimen failure. Tufted and untufted specimens are tested in axial compression on [0/90] specimens and bias direction com- pression on [±45] specimens. 3.1. Axial Behavior [0/90] a) Untufted material Figure 5 describes the behavior of the untufted [0/90] specimen in compression. It is observed that the strain at failure is higher than the other extracted strains, which Camera (a) Calibration target (b) Top view of full field strains recording on specimen Figure 4. Optical strain recording set up. Table 2. Different extraction methods. Strains extraction methods Corresponding method Failure The strains were extracted on the failure area Average centre The strains were average on the whole specimen. “Average displacement” “global extensometer” The strains were calculated from the displacement at the top and bottom of the sample. “Local central point” or “middle” The strains were extracted in the middle of the sample and were assumed to be similar to a strain gauge. means that the failure is relatively localized. The average displacement and the average centre strain are very close. Thus it is deduced that the specimen was not bending and that the test was therefore valid. The specimen cross sec- tion was observed with an optical microscope. The failure modes identified are delamination, kink bands, matrix cracking and fibre breaking (Figure 6). The “0” plies can be observed in white and the “90” plies in dark grey. It can be observed that the non crimp plies have some waviness throughout the thickness of the ma- terials even so they are not weaved. It can be also noticed that little damage occurs away from the failure area. Fi- nally the 0 degrees fibers are rarely at a strict 0 degrees from the specimen axis. -500 -400 -300 -200 -100 0 -1.00% -0.75%-0.50% -0.25%0.00% s t ra i n s t ress (MP a ) at fa ilure po int average c e ntr e aver a ge d isplaceme nt local centr al poin t Figure 5. Compressive stress strain response of [0/90] un- tufted specimens. (a) (b) Figure 6. Optical microscope images of untufted [0/90] spe- cimens; (a) specimen failure, (b) fibre waviness. Copyright © 2013 SciRes. OJCM 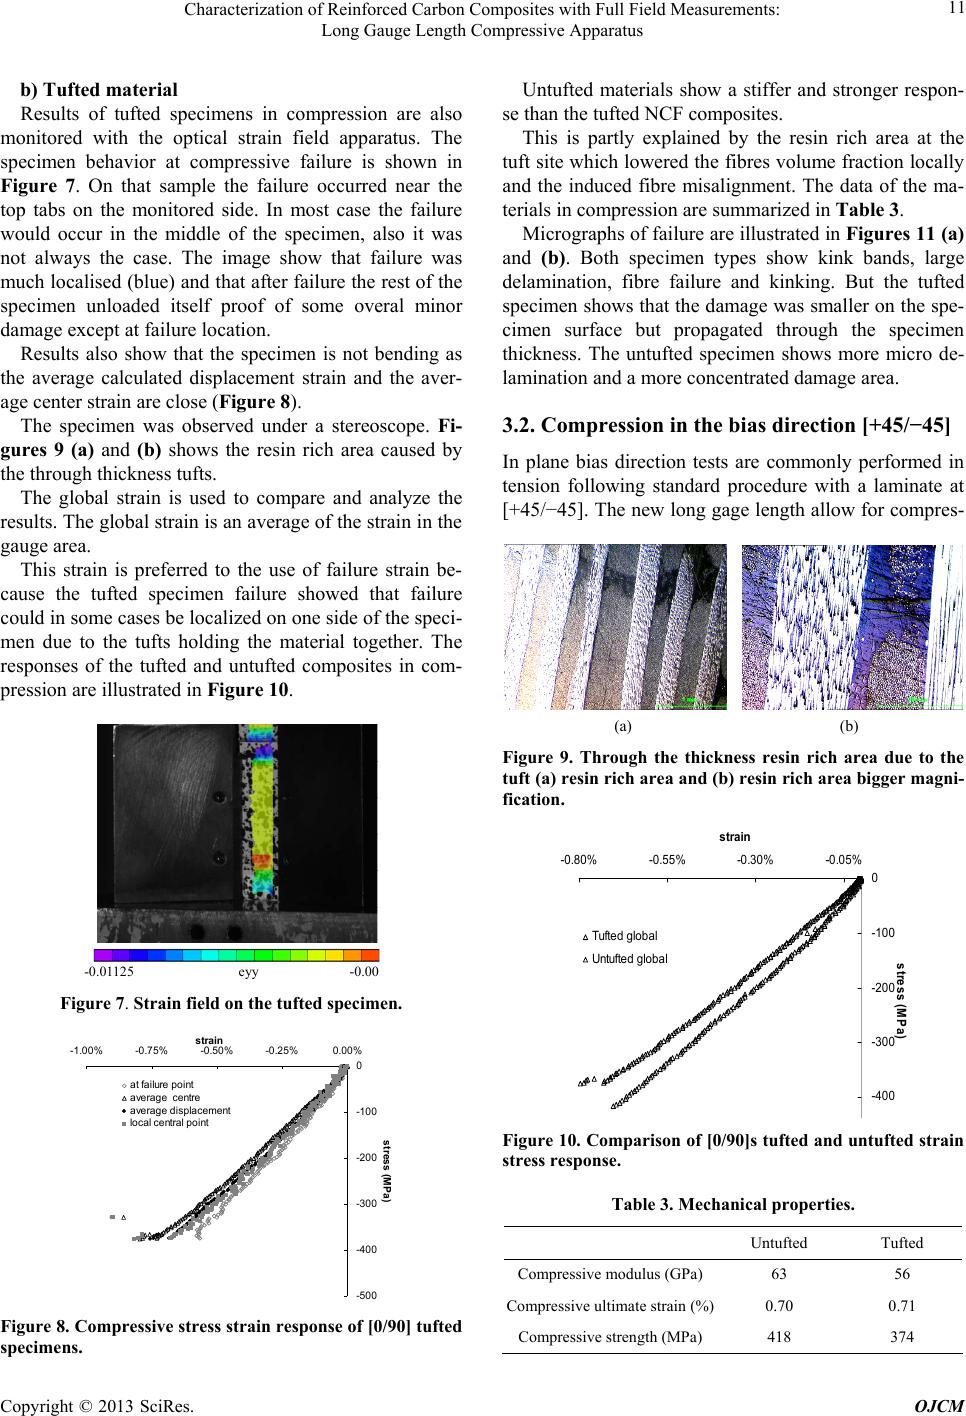 Characterization of Reinforced Carbon Composites with Full Field Measurements: Long Gauge Length Compressive Apparatus 11 b) Tufted material Results of tufted specimens in compression are also monitored with the optical strain field apparatus. The specimen behavior at compressive failure is shown in Figure 7. On that sample the failure occurred near the top tabs on the monitored side. In most case the failure would occur in the middle of the specimen, also it was not always the case. The image show that failure was much localised (blue) and that after failure the rest of the specimen unloaded itself proof of some overal minor damage except at failure location. Results also show that the specimen is not bending as the average calculated displacement strain and the aver- age center strain are close (Figure 8). The specimen was observed under a stereoscope. Fi- gures 9 (a) and (b) shows the resin rich area caused by the through thickness tufts. The global strain is used to compare and analyze the results. The global strain is an average of the strain in the gauge area. This strain is preferred to the use of failure strain be- cause the tufted specimen failure showed that failure could in some cases be localized on one side of the speci- men due to the tufts holding the material together. The responses of the tufted and untufted composites in com- pression are illustrated in Figure 10. -0.01125 eyy -0.00 Figure 7. Strain field on the tufted specimen. -500 -400 -300 -200 -100 0 -1.00% -0.75% -0.50% -0.25%0.00% strain stress (MPa) at f ail ure point average centre average displacement l ocal central poin t Figure 8. Compressive stress strain response of [0/90] tufted specimens. Untufted materials show a stiffer and stronger respon- se than the tufted NCF composites. This is partly explained by the resin rich area at the tuft site which lowered the fibres volume fraction locally and the induced fibre misalignment. The data of the ma- terials in compression are summarized in Table 3. Micrographs of failure are illustrated in Figures 11 (a) and (b). Both specimen types show kink bands, large delamination, fibre failure and kinking. But the tufted specimen shows that the damage was smaller on the spe- cimen surface but propagated through the specimen thickness. The untufted specimen shows more micro de- lamination and a more concentrated damage area. 3.2. Compression in the bias direction [+45/−45] In plane bias direction tests are commonly performed in tension following standard procedure with a laminate at [+45/−45]. The new long gage length allow for compres- (a) (b) Figure 9. Through the thickness resin rich area due to the tuft (a) resin rich area and (b) resin rich area bigger magni- fication. -400 -300 -200 -100 0 -0.80%-0.55% -0.30% -0.05% s t ra i n stress (MPa) Tufted global Untuf ted global Figure 10. Comparison of [0/90]s tufted and untufted strain stress response. Table 3. Mechanical properties. Untufted Tufted Compressive modulus (GPa)63 56 Compressive ultimate strain (%)0.70 0.71 Compressive strength (MPa)418 374 Copyright © 2013 SciRes. OJCM 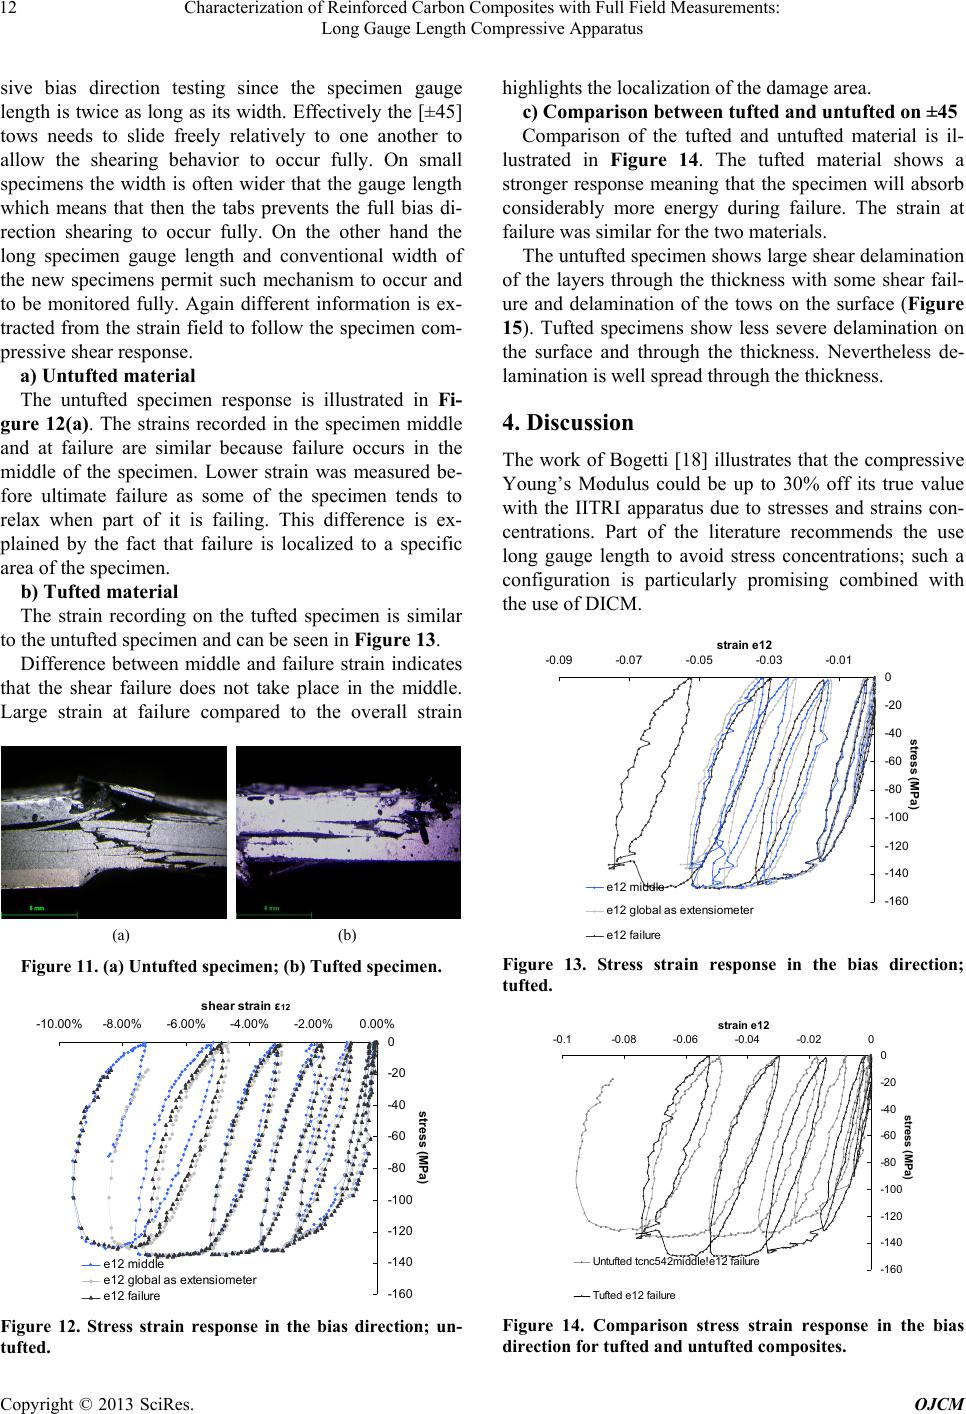 Characterization of Reinforced Carbon Composites with Full Field Measurements: Long Gauge Length Compressive Apparatus 12 sive bias direction testing since the specimen gauge length is twice as long as its width. Effectively the [±45] tows needs to slide freely relatively to one another to allow the shearing behavior to occur fully. On small specimens the width is often wider that the gauge length which means that then the tabs prevents the full bias di- rection shearing to occur fully. On the other hand the long specimen gauge length and conventional width of the new specimens permit such mechanism to occur and to be monitored fully. Again different information is ex- tracted from the strain field to follow the specimen com- pressive shear response. a) Untufted material The untufted specimen response is illustrated in Fi- gure 12(a). The strains recorded in the specimen middle and at failure are similar because failure occurs in the middle of the specimen. Lower strain was measured be- fore ultimate failure as some of the specimen tends to relax when part of it is failing. This difference is ex- plained by the fact that failure is localized to a specific area of the specimen. b) Tufted material The strain recording on the tufted specimen is similar to the untufted specimen and can be seen in Figure 13. Difference between middle and failure strain indicates that the shear failure does not take place in the middle. Large strain at failure compared to the overall strain (a) (b) Figure 11. (a) Untufted specimen; (b) Tufted specimen. -16 0 -14 0 -12 0 -10 0 -80 -60 -40 -20 0 -10.00% -8.00%-6.00%-4.00%-2.00%0.00% shear strain ε 12 stress (MPa) e12 middle e12 global as ext ensiometer e12 failure Figure 12. Stress strain response in the bias direction; un- tufted. highlights the localization of the damage area. c) Comparison between tufted and untufted on ±45 Comparison of the tufted and untufted material is il- lustrated in Figure 14. The tufted material shows a stronger response meaning that the specimen will absorb considerably more energy during failure. The strain at failure was similar for the two materials. The untufted specimen shows large shear delamination of the layers through the thickness with some shear fail- ure and delamination of the tows on the surface (Figure 15). Tufted specimens show less severe delamination on the surface and through the thickness. Nevertheless de- lamination is well spread through the thickness. 4. Discussion The work of Bogetti [18] illustrates that the compressive Young’s Modulus could be up to 30% off its true value with the IITRI apparatus due to stresses and strains con- centrations. Part of the literature recommends the use long gauge length to avoid stress concentrations; such a configuration is particularly promising combined with the use of DICM. -16 0 -14 0 -12 0 -10 0 -80 -60 -40 -20 0 -0.09 -0.07-0.05 -0.03 -0.01 strain e12 stress (MPa) e1 2 middle e12 global as extensiometer e12 fail ure Figure 13. Stress strain response in the bias direction; tufted. -160 -140 -120 -100 -80 -60 -40 -20 0 -0.1-0.08 -0.06 -0.04 -0.020 strain e12 stress (MPa) U nt ufted t cnc542middle!e12 failure T uft ed e12 f ail ur e Figure 14. Comparison stress strain response in the bias direction for tufted and untufted composites. Copyright © 2013 SciRes. OJCM 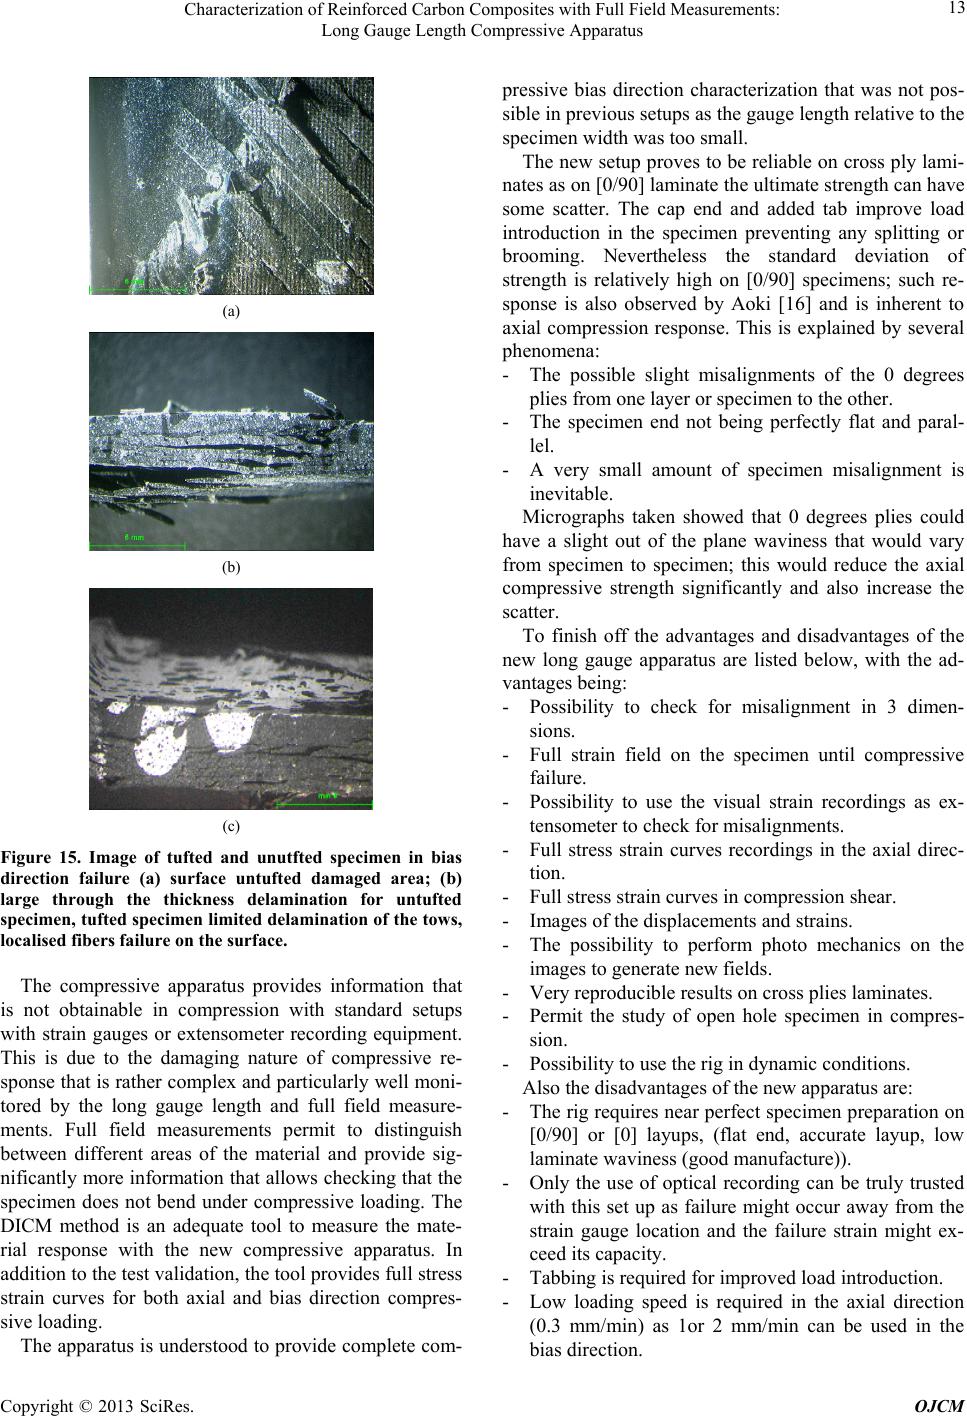 Characterization of Reinforced Carbon Composites with Full Field Measurements: Long Gauge Length Compressive Apparatus 13 (a) (b) (c) Figure 15. Image of tufted and unutfted specimen in bias direction failure (a) surface untufted damaged area; (b) large through the thickness delamination for untufted specimen, tufted specimen limited delamination of the tows, localised fibers failure on the surface. The compressive apparatus provides information that is not obtainable in compression with standard setups with strain gauges or extensometer recording equipment. This is due to the damaging nature of compressive re- sponse that is rather complex and particularly well moni- tored by the long gauge length and full field measure- ments. Full field measurements permit to distinguish between different areas of the material and provide sig- nificantly more information that allows checking that the specimen does not bend under compressive loading. The DICM method is an adequate tool to measure the mate- rial response with the new compressive apparatus. In addition to the test validation, the tool provides full stress strain curves for both axial and bias direction compres- sive loading. The apparatus is understood to provide complete com- pressive bias direction characterization that was not pos- sible in previous setups as the gauge length relative to the specimen width was too small. The new setup proves to be reliable on cross ply lami- nates as on [0/90] laminate the ultimate strength can have some scatter. The cap end and added tab improve load introduction in the specimen preventing any splitting or brooming. Nevertheless the standard deviation of strength is relatively high on [0/90] specimens; such re- sponse is also observed by Aoki [16] and is inherent to axial compression response. This is explained by several phenomena: - The possible slight misalignments of the 0 degrees plies from one layer or specimen to the other. - The specimen end not being perfectly flat and paral- lel. - A very small amount of specimen misalignment is inevitable. Micrographs taken showed that 0 degrees plies could have a slight out of the plane waviness that would vary from specimen to specimen; this would reduce the axial compressive strength significantly and also increase the scatter. To finish off the advantages and disadvantages of the new long gauge apparatus are listed below, with the ad- vantages being: - Possibility to check for misalignment in 3 dimen- sions. - Full strain field on the specimen until compressive failure. - Possibility to use the visual strain recordings as ex- tensometer to check for misalignments. - Full stress strain curves recordings in the axial direc- tion. - Full stress strain curves in compression shear. - Images of the displacements and strains. - The possibility to perform photo mechanics on the images to generate new fields. - Very reproducible results on cross plies laminates. - Permit the study of open hole specimen in compres- sion. - Possibility to use the rig in dynamic conditions. Also the disadvantages of the new apparatus are: - The rig requires near perfect specimen preparation on [0/90] or [0] layups, (flat end, accurate layup, low laminate waviness (good manufacture)). - Only the use of optical recording can be truly trusted with this set up as failure might occur away from the strain gauge location and the failure strain might ex- ceed its capacity. - Tabbing is required for improved load introduction. - Low loading speed is required in the axial direction (0.3 mm/min) as 1or 2 mm/min can be used in the bias direction. Copyright © 2013 SciRes. OJCM 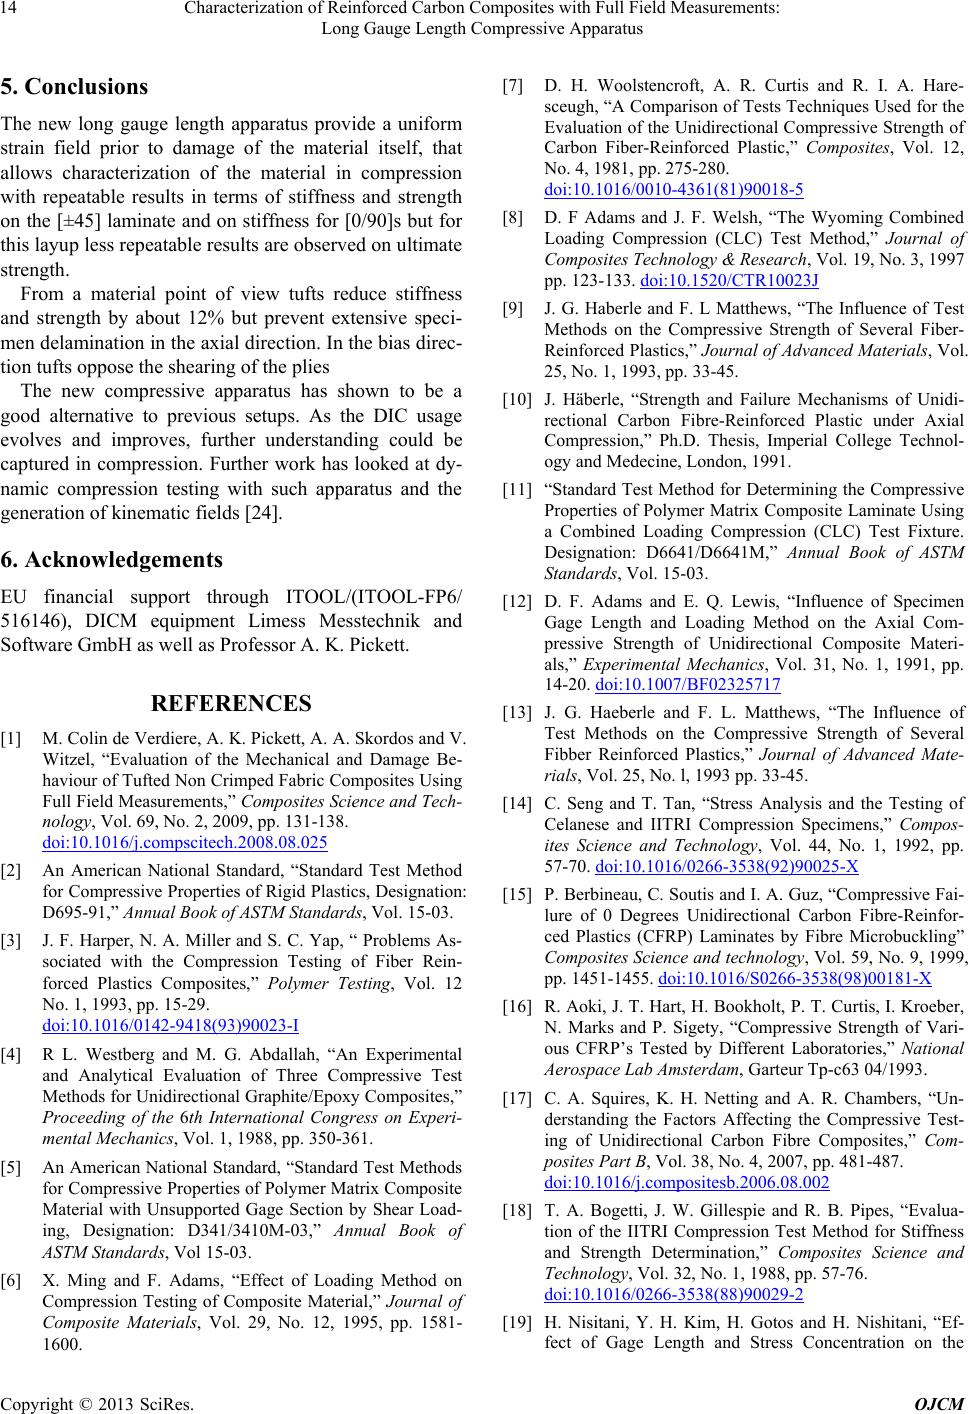 Characterization of Reinforced Carbon Composites with Full Field Measurements: Long Gauge Length Compressive Apparatus 14 5. Conclusions The new long gauge length apparatus provide a uniform strain field prior to damage of the material itself, that allows characterization of the material in compression with repeatable results in terms of stiffness and strength on the [±45] laminate and on stiffness for [0/90]s but for this layup less repeatable results are observed on ultimate strength. From a material point of view tufts reduce stiffness and strength by about 12% but prevent extensive speci- men delamination in the axial direction. In the bias direc- tion tufts oppose the shearing of the plies The new compressive apparatus has shown to be a good alternative to previous setups. As the DIC usage evolves and improves, further understanding could be captured in compression. Further work has looked at dy- namic compression testing with such apparatus and the generation of kinematic fields [24]. 6. Acknowledgements EU financial support through ITOOL/(ITOOL-FP6/ 516146), DICM equipment Limess Messtechnik and Software GmbH as well as Professor A. K. Pickett. REFERENCES [1] M. Colin de Verdiere, A. K. Pickett, A. A. Skordos and V. Witzel, “Evaluation of the Mechanical and Damage Be- haviour of Tufted Non Crimped Fabric Composites Using Full Field Measurements,” Composites Science and Tech- nology, Vol. 69, No. 2, 2009, pp. 131-138. doi:10.1016/j.compscitech.2008.08.025 [2] An American National Standard, “Standard Test Method for Compressive Properties of Rigid Plastics, Designation: D695-91,” Annual Book of ASTM Standards, Vol. 15-03. [3] J. F. Harper, N. A. Miller and S. C. Yap, “ Problems As- sociated with the Compression Testing of Fiber Rein- forced Plastics Composites,” Polymer Testing, Vol. 12 No. 1, 1993, pp. 15-29. doi:10.1016/0142-9418(93)90023-I [4] R L. Westberg and M. G. Abdallah, “An Experimental and Analytical Evaluation of Three Compressive Test Methods for Unidirectional Graphite/Epoxy Composites,” Proceeding of the 6th International Congress on Experi- mental Mechanics, Vol. 1, 1988, pp. 350-361. [5] An American National Standard, “Standard Test Methods for Compressive Properties of Polymer Matrix Composite Material with Unsupported Gage Section by Shear Load- ing, Designation: D341/3410M-03,” Annual Book of ASTM Standards, Vol 15-03. [6] X. Ming and F. Adams, “Effect of Loading Method on Compression Testing of Composite Material,” Journal of Composite Materials, Vol. 29, No. 12, 1995, pp. 1581- 1600. [7] D. H. Woolstencroft, A. R. Curtis and R. I. A. Hare- sceugh, “A Comparison of Tests Techniques Used for the Evaluation of the Unidirectional Compressive Strength of Carbon Fiber-Reinforced Plastic,” Composites, Vol. 12, No. 4, 1981, pp. 275-280. doi:10.1016/0010-4361(81)90018-5 [8] D. F Adams and J. F. Welsh, “The Wyoming Combined Loading Compression (CLC) Test Method,” Journal of Composites Technology & Research, Vol. 19, No. 3, 1997 pp. 123-133. doi:10.1520/CTR10023J [9] J. G. Haberle and F. L Matthews, “The Influence of Test Methods on the Compressive Strength of Several Fiber- Reinforced Plastics,” Journal of Advanced Materials, Vol. 25, No. 1, 1993, pp. 33-45. [10] J. Häberle, “Strength and Failure Mechanisms of Unidi- rectional Carbon Fibre-Reinforced Plastic under Axial Compression,” Ph.D. Thesis, Imperial College Technol- ogy and Medecine, London, 1991. [11] “Standard Test Method for Determining the Compressive Properties of Polymer Matrix Composite Laminate Using a Combined Loading Compression (CLC) Test Fixture. Designation: D6641/D6641M,” Annual Book of ASTM Standards, Vol. 15-03. [12] D. F. Adams and E. Q. Lewis, “Influence of Specimen Gage Length and Loading Method on the Axial Com- pressive Strength of Unidirectional Composite Materi- als,” Experimental Mechanics, Vol. 31, No. 1, 1991, pp. 14-20. doi:10.1007/BF02325717 [13] J. G. Haeberle and F. L. Matthews, “The Influence of Test Methods on the Compressive Strength of Several Fibber Reinforced Plastics,” Journal of Advanced Mate- rials, Vol. 25, No. l, 1993 pp. 33-45. [14] C. Seng and T. Tan, “Stress Analysis and the Testing of Celanese and IITRI Compression Specimens,” Compos- ites Science and Technology, Vol. 44, No. 1, 1992, pp. 57-70. doi:10.1016/0266-3538(92)90025-X [15] P. Berbineau, C. Soutis and I. A. Guz, “Compressive Fai- lure of 0 Degrees Unidirectional Carbon Fibre-Reinfor- ced Plastics (CFRP) Laminates by Fibre Microbuckling” Composites Science and technology, Vol. 59, No. 9, 1999, pp. 1451-1455. doi:10.1016/S0266-3538(98)00181-X [16] R. Aoki, J. T. Hart, H. Bookholt, P. T. Curtis, I. Kroeber, N. Marks and P. Sigety, “Compressive Strength of Vari- ous CFRP’s Tested by Different Laboratories,” National Aerospace Lab Amsterdam, Garteur Tp-c63 04/1993. [17] C. A. Squires, K. H. Netting and A. R. Chambers, “Un- derstanding the Factors Affecting the Compressive Test- ing of Unidirectional Carbon Fibre Composites,” Com- posites Part B, Vol. 38, No. 4, 2007, pp. 481-487. doi:10.1016/j.compositesb.2006.08.002 [18] T. A. Bogetti, J. W. Gillespie and R. B. Pipes, “Evalua- tion of the IITRI Compression Test Method for Stiffness and Strength Determination,” Composites Science and Technology, Vol. 32, No. 1, 1988, pp. 57-76. doi:10.1016/0266-3538(88)90029-2 [19] H. Nisitani, Y. H. Kim, H. Gotos and H. Nishitani, “Ef- fect of Gage Length and Stress Concentration on the Copyright © 2013 SciRes. OJCM  Characterization of Reinforced Carbon Composites with Full Field Measurements: Long Gauge Length Compressive Apparatus Copyright © 2013 SciRes. OJCM 15 Compressive Strength of a Unidirectional CFRP,” Engi- neering Frac ture Mechanics, Vol. 49, No. 6, 1988, pp. 953-961. doi:10.1016/0013-7944(94)90026-4 [20] A. G Salvi, A. M Waas and A. Caliskan, “Specimen Size Effects in the Off-Axis Compression Test of Unidirec- tional Carbon Fiber Tow Composites,” Composites Sci- ence and Technology, Vol. 64, No. 1, 2004, pp. 83-97. doi:10.1016/S0266-3538(03)00214-8 [21] H. M. Hsiao and I. M. Daniel, “Effect of Fibre Waviness on Stiffness and Strength Reduction of Unidirectional Composites under Compressive Loading,” Composites Science and Technology, Vol. 56, No. 5, 1996, pp. 581- 593. doi:10.1016/0266-3538(96)00045-0 [22] N. K. Naik and R. S. Kumar, “Compressive Strength of Unidirectional Composites: Evaluation and Comparison of Prediction Models,” Composites Structures, Vol. 46, No. 3, 1999, pp. 299-308. doi:10.1016/S0263-8223(99)00098-7 [23] Y. L. Xu and K. L. Reifsnider. “Micromechanical Mo- deling of Composite Compressive Strength,” Journal of Composite Materials, Vol. 27, No. 6, 1993, pp. 558-572. [24] M. Colin de Verdiere, “Damage and Strain Rate Optical Characterization of Tutfted and Untufted Carbon Com- posites for Mesoscale Impact Models,” Ph.D. Thesis, Cranfield University, Cranfield, 2009. |