

Paper Menu >>
Journal Menu >>
 Technology and Investment, 2013, 4, 73-77 Published Online Febr uary 20 http://www.SciRP.org/journal/ti) Copyright © 20 SciRes. TI Portfolio Selection by Maximizing Omega Function using Differential Evolution PEKÁR Juraj, BREZINA Ivan, ČIČKOVÁ Zuzana, REIFF Marian Department of Operations Research and Econometrics, University of Economics, Bratislava, Slovakia Email: [email protected] Received 2012 ABSTRACT Paper presents alternative solution seeking approach for portfolio selection problem with Omega function performance measure which allows determining capital allocation over the number of assets. Omega function computability is diffi- cult due to substandard structures and therefore the use of standard techniques seems to be relatively complicated. Dif- ferential evolution from the group of evolutionary algorithms was selected as an alternative computing procedure. Al- ternative approach is analyzed on the Down Jones Industrial Index data. Presented approach enables to determine good real-time solution and the quality of results is comparable with results obtained by professional software. Keywords: differential evolution, Omega function, problem of portfolio selection 1. Introduction In general, portfolio theory deals with the selection of an appropriate mix of assets in a portfolio in order to meet predetermined properties. Various mathematical models, which measure the portfolio performance measurement can be used to support the decision making process of selection of the portfolio assets. The aim is to determine the allocation of the available resources in the selected group of assets that results in maximization of portfolio performance. Follow this idea, various measurements of performance can be used. The performance measurement techniques are e.g. Sharpe ratio, Treynor ratio, Jensen's alpha, Information Ratio, Sortino ratio, Omega function and the Sharpe Omega ratio ([1], [2], [3], [4], [5], [6], [7], [8]). The paper deals wi th Omega function, which com- putability is difficult due to substandard structures of performance level and therefore the use of standard tech- niques seems to be relatively complicated. The alterna- tive computing procedures includes variety of different approaches. Nowadays a lot of research attention is fo- cused on evolutionary algorithms. The paper presents the algorithm of differential evolution that is able to deal with nonlinear objective function with success (e na b l es quick a c hieve ment of suboptimal solutions) and thus demonstrates suitability of evolutionary algorithms for financial modeling. Above mentioned approach is ana- lyzed on assets inc lude d in the Down Jones Industrial Inde x and its historical data1 1 publ is hed from July 1st 2001 to April 1st 2012 on weekly basis were used. http://finance. yahoo. co m/ (2012) 2. Portfolio selection models based on Omega function Omega function is measure which incorporates all the distributional, characteristics of a return series. The measure is a function of the returns leveled and requires no parametric assumption on the distribution. Precisely, it considers the returns below and above a specific loss threshold and provides a ratio of total probability weighted losses and gains that fully describes the risk reward properties of the distribution [8]: where: MAR denotes the return level regarded as a loss threshold, (a, b ) denotes yields range, F(x) the cumulative distribution fu nction of asset returns. In the next part we formulate the problem of portfolio selection based on omega function performance measure. As it is mentioned, the Omega function involves consid- eration of all the information contained in the time series of returns. The aim of portfolio selection problem is to maximize the level of Omega performance measure, where the variables w1, w2,…wd (where d represents the number of assets) represent the weights of each asset in the portfolio. Corresponding problem can be formulated as follows [9]: ∫ ∫− =Ω MAR a b MAR dxxF dxxF MAR )( ))(1( )( 13 13 ( 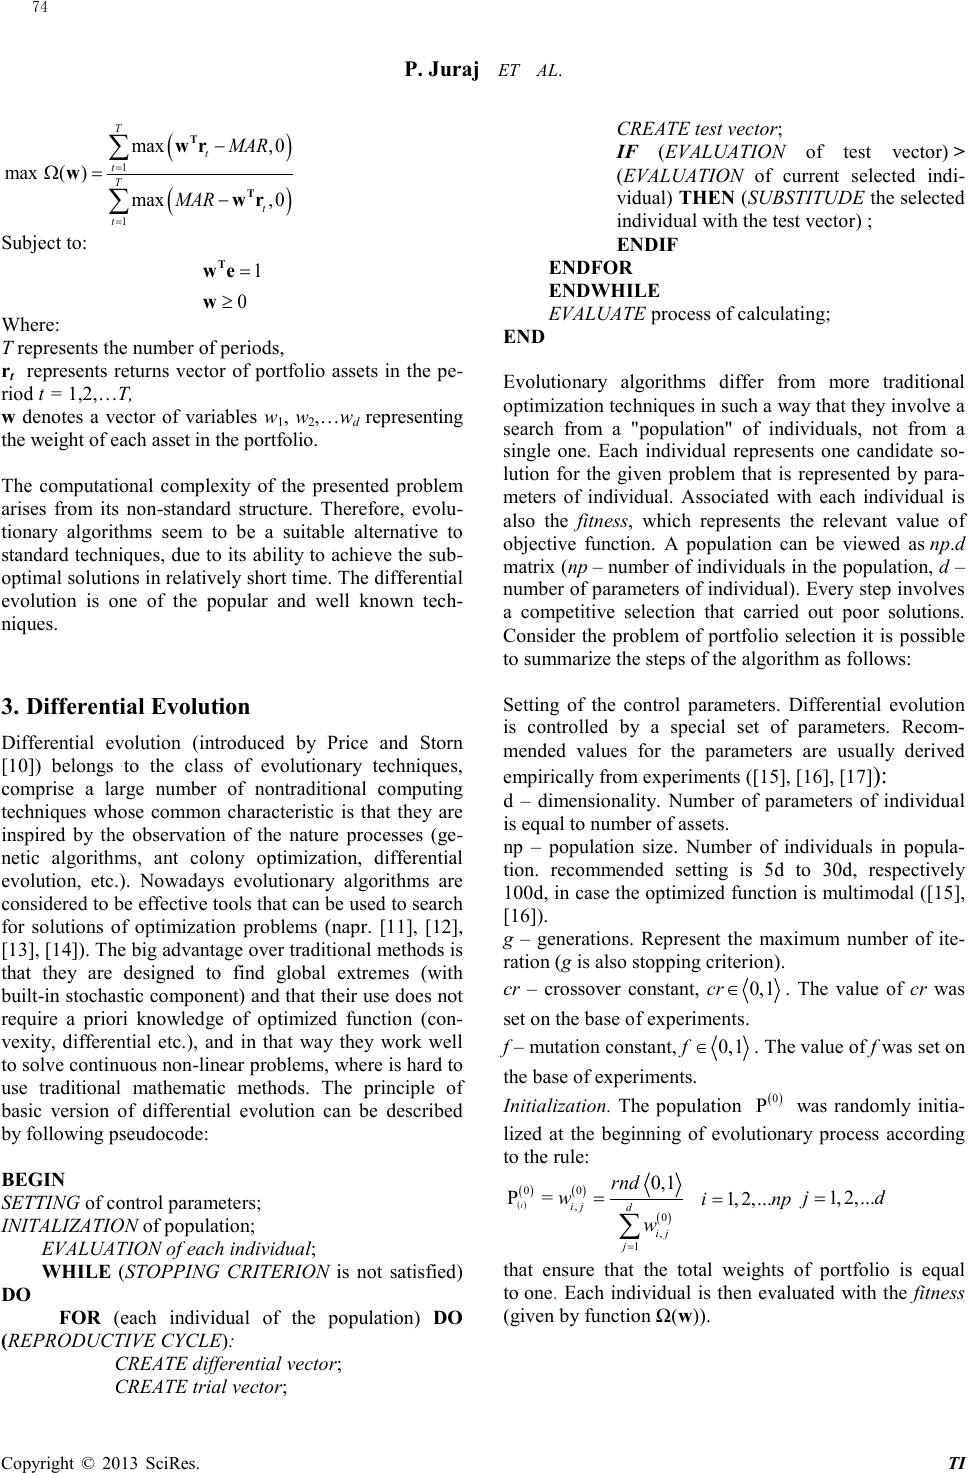 P. Juraj ET AL. TI ( ) ( ) 1 1 max ,0 max( ) max ,0 T t t T t t MAR MAR = = − Ω= − ∑ ∑ T T wr w wr Subject to: 1 0 = ≥ T we w Wher e : T represents the number of periods, rt represents returns vector of portfolio assets in the pe- riod t = 1,2,…T, w denotes a vector of variables w1, w2,…wd representing the weight of each asset in the portfolio. The computationa l c omplexity of the presented problem arises from its non-standard structure. Therefore, evolu- tionary algorithms seem to be a suitable alternative to standard techniques, due to its ability to achieve the sub- optimal solutions in relatively short time. The d iffere ntial evolution is one of the popular and well known tech- niques. 3. Differential Evolution Differential evolution (introduced by Price and Storn [10]) belongs to the class of evolutionary techniques, comprise a large number of nontraditional computing techniques whose common characteristic is that they are inspired by the observation of the nature processes (ge- netic algorithms, ant colony optimization, differential evolution, etc.). Nowadays evolutionary algorithms are considered to be effective tools that can be used to search for solutions of optimization problems (napr. [11], [12], [13], [14]). The big advantage over traditional methods is that they are designed to find global extremes (with built-in stochastic component) and that their use does not require a priori knowledge of optimized function (con- vexity, differential etc.), and in that way they work well to solve continuous non-linear problems, where is hard to use traditional mathematic methods. The principle of basic version of differential evolution can be described by following pseudocode: BEGIN SETTING of control parameters; INITALIZATION of population; EVALUATION of each individual; WHILE (STOPPING CRITERION is not satisfied) DO FOR (each individual of the population) DO (REPRODUCTIVE CYCLE): CREATE differential vector; CREATE trial vector; CREATE test vector; IF (EVALUATION of test vector) > (EVALUATION of current selected indi- vidual ) THEN (SUBSTITUD E the selected individual with the test vector) ; ENDIF ENDFOR ENDWHILE EVALUATE process of calculating; END Evolutionary algorithms differ from more traditional optimization techniques in such a way that they involve a search from a "population" of individuals, not from a single one. Each individual represents one candidate so- lution for the given problem that is represented by para- meters of individual. Associated with each individual is also the fitness, which represents the relevant value of objective function. A population can be viewed as np.d matrix (np – number of individuals in the population, d – number of parameters of individual). Every step involves a competitive selection that carried out poor solutions. Consider the problem of portfolio selection it is possible to summarize the steps of the algorithm as follows: Setting of the control parameters. Differential evolution is controlled by a special set of parameters. Recom- mended values for the parameters are usually derived empirically from experiments ([15], [16], [17]): d – dimensio na lity. Number of parameters of individual is equal to number of asse ts. np – population size. Number of individuals in popula- tion. recommended setting is 5d to 30d, respectively 100d, in case the optimized function is multimodal ([15], [16]). g – generations. Represent the maximum number of ite- ration (g is also stopping criterion). cr – crossover constant, cr 0,1∈ . The value of cr was set on the base of experiments. f – mutation constant, f 0,1∈ . The value of f was set on the base of experiments. Initializatio n. The population ( ) 0 P was randomly initia- lized at the beginning of evolutionary process according to the rule: ( ) ( )( ) ( ) 00 ,0 , 1 0,1 P = i ij d ij j rnd w w = =∑ 1,2,...i np= 1,2, ...jd= that ensure that the total weights of portfolio is equal to one. Each individual is then evaluated with the fitne ss (given by function Ω(w)). 74 Copyright © 20 SciRes. 13 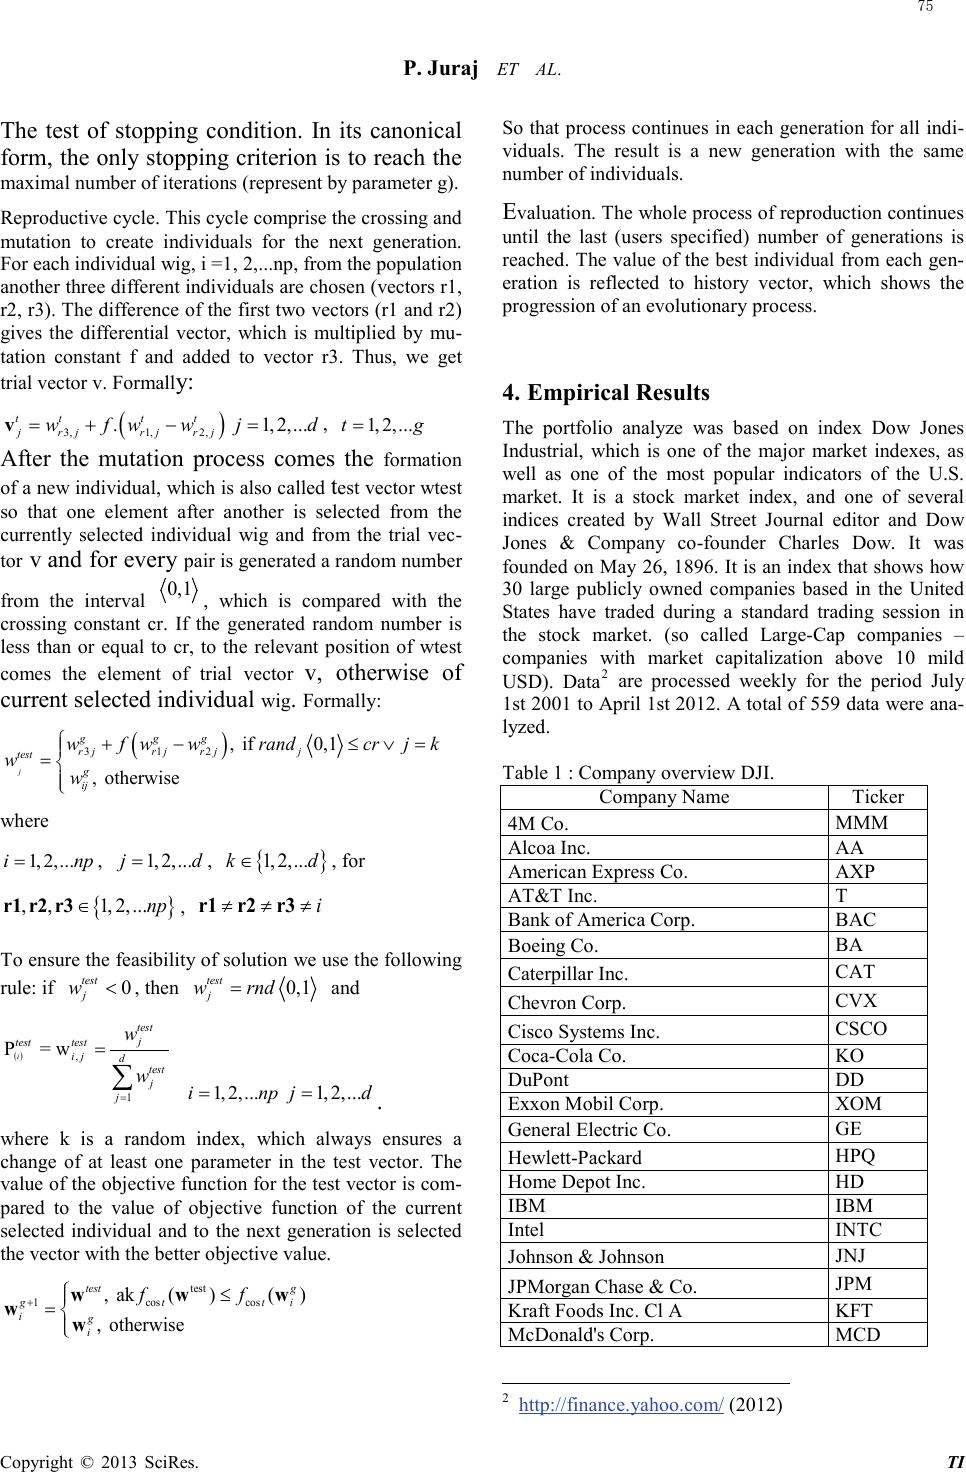 P. Juraj ET AL. TI The test of stopping condition. In its canonical form, the only stopping criterion is to reach the maximal number of iterations (represent by parameter g). Reproductive cycle. This cycle comprise the crossing and mutation to create individuals for the next generation. For each individual wig, i =1, 2,...np, from the population another three different individuals are chosen (vectors r1, r2, r3). The difference of the first two vectors (r1 and r2) gives the differential vector, which is multiplied by mu- tation constant f and added to vector r3. Thus, we get trial vector v. Formally: ( ) 3,1, 2, . ttt t jr jrjrj wfw w=+−v 1,2, ...jd= , 1,2,...tg= After the mutation process comes the formation of a new individual, which is also called test vector wtest so that one element after another is selected from the currently selected individual wig and from the trial vec- tor v and for every pair is generated a random number from the interval 0,1 , which is compared with the crossing constant cr. If the generated random number is less than or equal to cr, to the relevant position of wtest comes the element of trial vector v, otherwise of current selected individual wig . Formal ly : ( ) 3 12 , if 0,1 , otherwise j g gg r jrjr jj test g ij wf wwrandcrjk w w +−≤ ∨= = where 1,2,...i np= , 1,2, ...jd= , { } 1,2, ...kd∈ , for { } ,,1, 2,...np∈r1 r2r3 , i≠≠≠r1 r2r3 To ensure the feasibility of solution we use the following rule: if 0 test j w< , then 0,1 test j w rnd= and ( ) , 1 P = w i test j test test ij d test j j w w = = ∑ 1,2,...i np= 1,2, ...jd= . where k is a random index, which always ensures a change of at least one parameter in the test vector. The value of the objective function for the test vector is com- pared to the value of objective function of the current selected individual and to the next generation is selected the vector with the better objective value. test 1cos cos , ak ()() , otherwise test g gt ti ig i ff + ≤ = w ww ww So that process continues in each generation for all indi- viduals. The result is a new generation with the same number of individuals. Evaluation. The whole process of reproduction continues until the last (users specified) number of generations is reached. The value of the best individual from each gen- eration is reflected to history vector, which shows the progression of an evolutionary process. 4. Empirical Results The portfolio analyze was based on index Dow Jones Industrial, which is one of the major market indexes, as well as one of the most popular indicators of the U.S. market. It is a stock market index, and one of several indices created by Wall Street Journal editor and Dow Jones & Company co-founder Charles Dow. It was founded on May 26, 1896. It is an index that shows how 30 large publicly owned companies based in the United States have traded during a standard trading session in the stock market. (so called Large-Cap companies – companies with market capitalization above 10 mild USD). Data2 Company Name are processed weekly for the period July 1st 2001 to April 1st 2012. A total of 559 data were ana- lyzed. Table 1 : Company overview DJI. Ticker 4M Co. MMM Alcoa Inc. AA American Express Co. AXP AT&T Inc. T Bank of America Corp. BAC Boeing Co. BA Caterpillar Inc. CAT Chevron Corp. CVX Cisco Systems Inc. CSCO Coca-Cola Co. KO DuPo nt DD Exxon Mobil Corp. XOM General Electric Co. GE Hewlett-Packard HP Q Home Depot Inc. HD IBM IBM Intel INT C Johnson & Johnson JNJ JPMorgan Chase & Co. JPM Kraft Foods Inc. Cl A KFT McDonald's Corp. MCD 2 http://finance.yahoo .co m/ (2012) 75 Copyright © 20 SciRes. 13 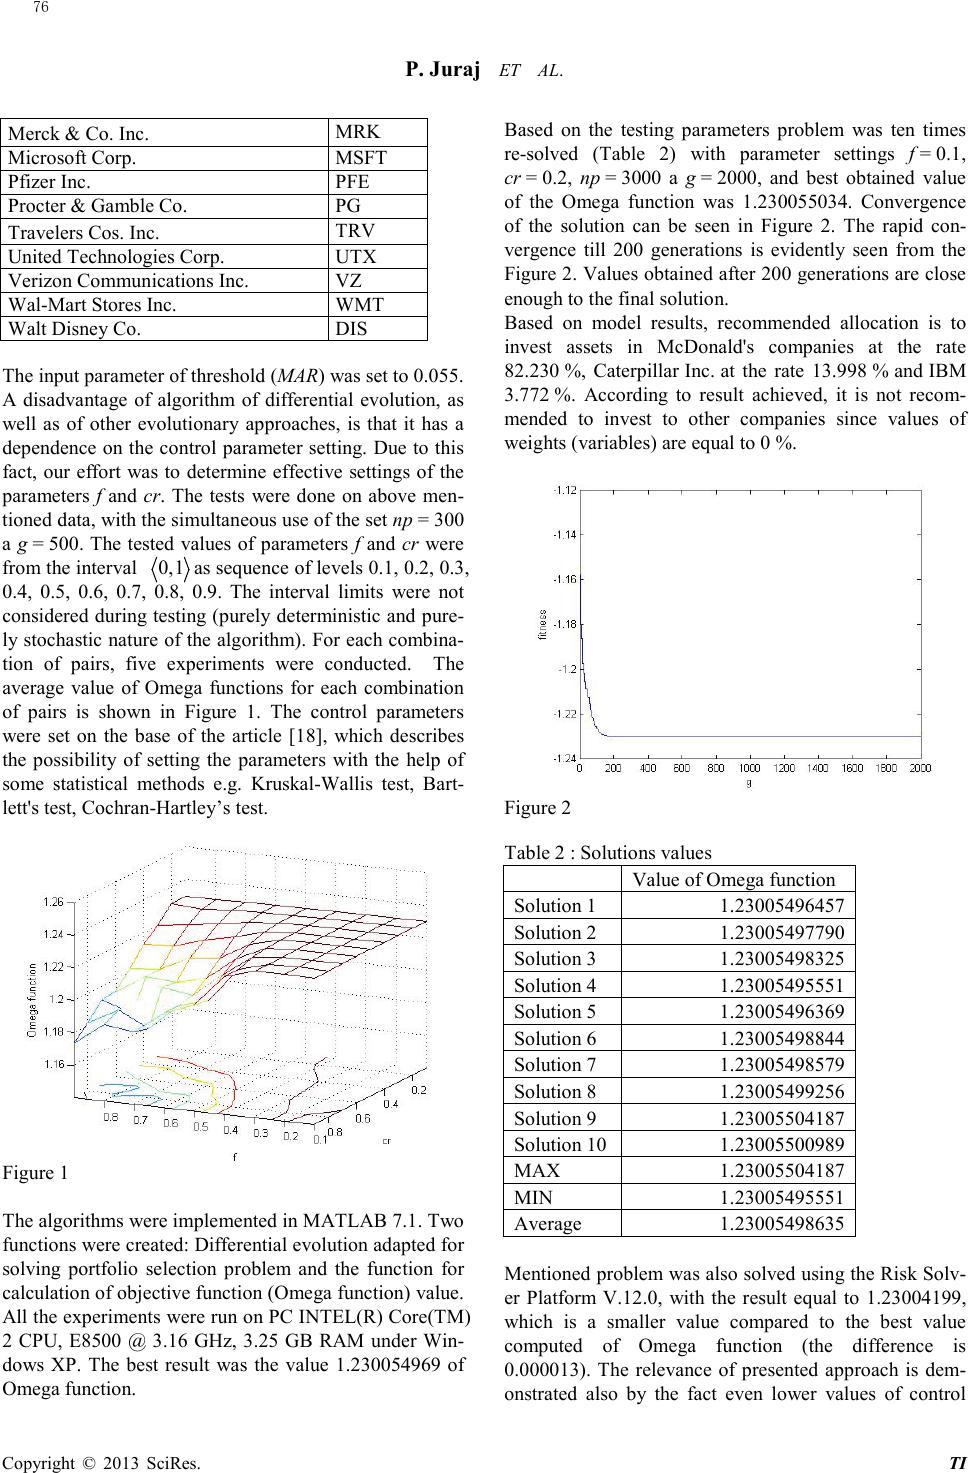 P. Juraj ET AL. TI Merck & Co. Inc. M RK Microsoft Corp. MSFT Pfizer Inc. PFE Procter & Gamble Co. PG Travelers Cos. Inc. TRV United Technologies Corp. UTX Verizon Communications Inc. VZ Wal-Mart Stores Inc. WMT Walt Disney Co. DIS The input parameter of threshold (MAR) was set to 0.055. A disadvantage of algorithm of differential evolution, as well as of other evolutionary approaches, is that it has a dependence on the control parameter setting. Due to this fact, our effort was to determine effective settings of the parameters f and cr. The tests were done on above men- tioned data, with the simultaneous use of the set np = 300 a g = 500. The tested values of parameters f and cr were from the interval 0,1 as sequence of levels 0.1, 0.2, 0.3, 0.4, 0.5, 0.6, 0.7, 0.8, 0.9. The interval limits were not considered during testing (purely deterministic and pure- ly stochastic nature of the algorithm). For each combina- tion of pairs, five exp er imen ts were conducted. The average value of Omega functions for each combination of pairs is shown in Figure 1. The control parameters were set on the base of the article [18], which describes the possibility of setting the parameters with the help of some statistical methods e.g. Kr uskal-Wallis test, Bart- lett's test, Cochran-Hartley’s test. Figure 1 The algorithms were implemented in MATLAB 7.1. Two functions were created: Differential evolution adapted for solving portfolio selection problem and the function for calculation of objective function (Omega function) value. All the experiments were run on PC INTEL(R) Core(TM) 2 CPU, E8500 @ 3.16 GHz, 3.25 GB RAM under Win- dows XP. The best result was the value 1.230054969 of O mega function. Based on the testing parameters problem was ten times re-solved (Table 2) wi th parameter settin gs f = 0.1, cr = 0.2, np = 3000 a g = 2000, and best obtained value of the Omega function was 1.230055034. Convergence of the solution can be seen in Figure 2. The rapid con- vergence till 200 generations is evidently seen from the Figure 2. Values obtained afte r 200 generations are close enou gh to the final solution. Based on model results, recommended allocation is to inves t assets in McDonald's companies at the rate 82.230 %, Caterpillar Inc. at the rate 13.998 % and IBM 3.772 %. According to result achieved, it is not recom- mended to invest to other companies since values of weights (variables) are equal to 0 %. Figure 2 Table 2 : Solutions values Value of Omega function Solution 1 1.23005496457 Solution 2 1.23005497790 Solution 3 1.23005498325 Solution 4 1.23005495551 Solution 5 1.23005496369 Solution 6 1.23005498844 Solution 7 1.23005498579 Solution 8 1.23005499256 Solution 9 1.23005504187 Solution 10 1.23005500989 MAX 1.23005504187 MIN 1.23005495551 Avera ge 1.23005498635 Mentioned problem was also solved using the Risk Solv- er Platform V.12.0, with the result equal to 1.23004199, which is a smaller value compared to the best value computed of Omega function (the difference is 0.000013). The relevance of presented approach is dem- onstrated also by the fact even lower values of control 76 Copyright © 20 SciRes. 13 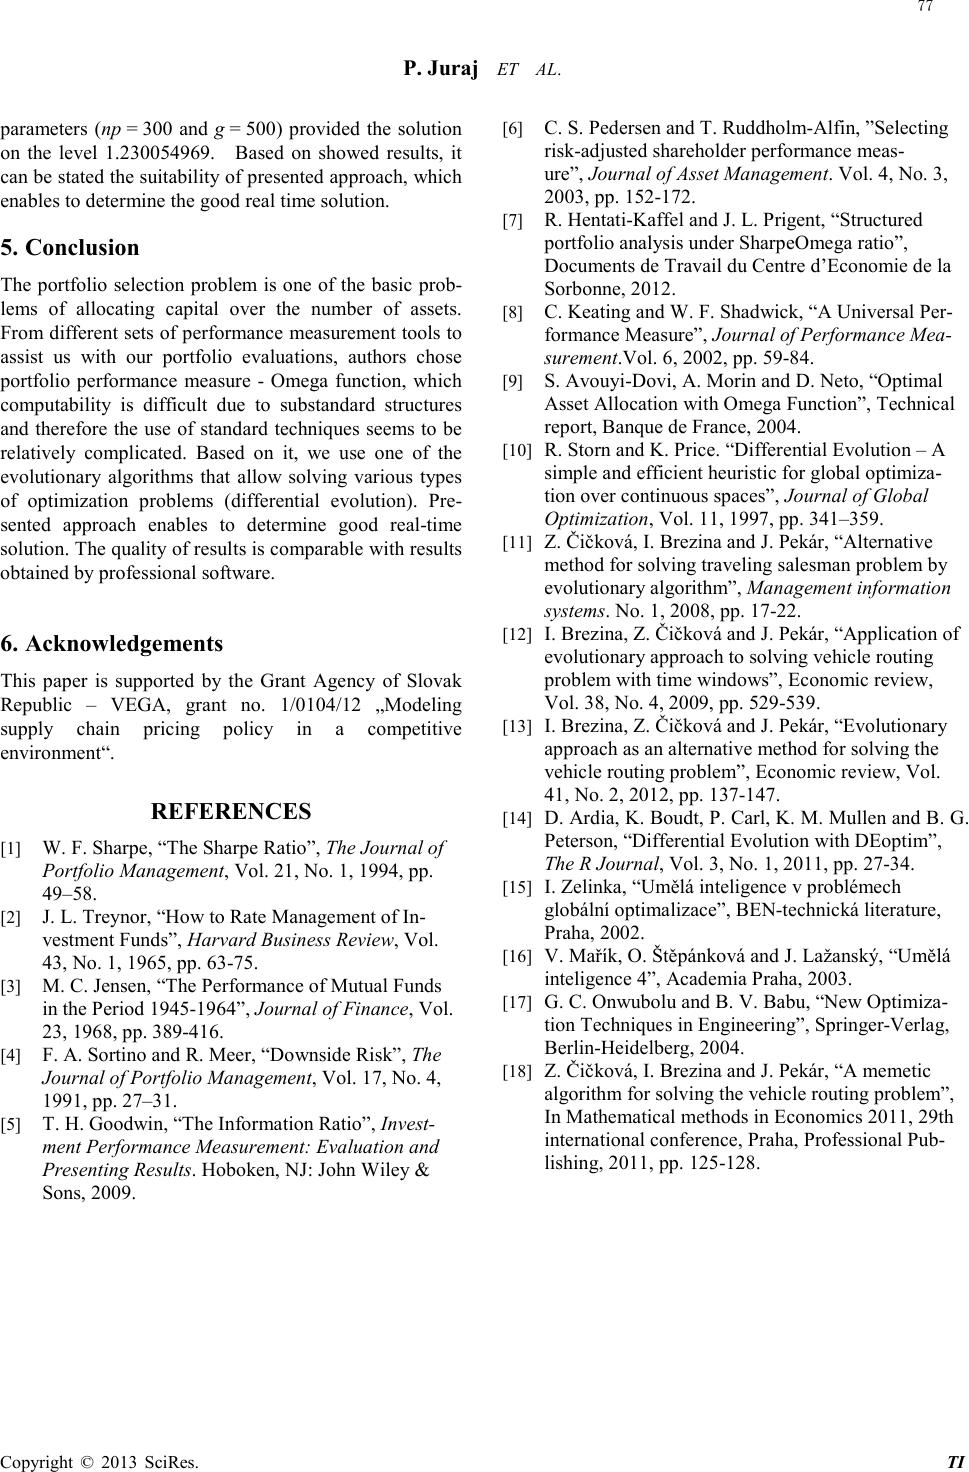 P. Juraj ET AL. TI parameters (np = 300 and g = 500) provided the solution on the level 1.230054969. Based on showed resul ts, it can be stated the suitability of presented approach, which enables to determine the good real time solution. 5. Conclusion The portfolio selection problem is one of the basic prob- lems of allocating capital over the number of assets. Fro m differ ent sets of performance measurement tools to assist us with our portfolio evaluations, authors chose portfolio performance measure - Omega function, which computability is difficult due to substandard structures and therefore the use of standard techniques seems to be relatively complicated. Based on it, we use one of the evolutionary algorithms that allow solving various types of optimization problems (differential evolution). Pre- sented approach enables to determine good real-time solution. The quality of results is comparable with results obtained by professional software. 6. Acknowledgements This paper is supported by the Grant Agency of Slovak Republic – VEGA, grant no. 1/0104/12 „Modeling supply chain pricing policy in a competitive environ ment“. REFERENCES [1] W. F. Sharp e , “The Sharpe Ratio”, The Journal of Portfolio Management, Vol . 21, No. 1, 1994, pp. 49–58. [2] J. L. Treyno r , “How to Rate Management of In- vestment Funds”, Harvard Business Review, Vol. 43, No. 1, 1965, pp. 63-75. [3] M. C. Jensen, “The Performance of Mutual Funds in the Period 1945-1964”, Journal of Finance, Vol. 23, 1968, pp. 389-416. [4] F. A. Sortino and R. Meer, “Downside Risk”, The Journal of Portfolio Management, Vol. 17, No. 4, 1991, pp. 27–31. [5] T. H. Goodwin, “The Information Ratio”, Invest- ment Performance Measurement: Evaluation and Presenting Results. Hoboken, NJ: John Wiley & Sons, 2009. [6] C. S. Pedersen and T. Ruddholm-Alfin, ”Selecting risk-adjusted shareholder performance meas- ure”, Journal of Asset Management. Vol. 4, No. 3, 2003, pp. 152-172. [7] R. Hentati-Kaffe l and J. L. Prigent , “Structured portfolio analysis under SharpeOmega ratio”, Documents de Travail du Centre d’Economie de la Sorbonne, 2012. [8] C. Keating and W. F. Shadwick, “A Universal Per- formance Measure”, Journal of Performance Mea- sureme nt .Vol. 6, 2002, pp. 59-84. [9] S. Avouyi-Dovi, A. Morin and D. Neto, “Optimal Asset Allocation with Omega Function”, Technical report, Banque de France, 2004. [10] R. Storn and K. Price. “Differential Evolution – A simple and efficient heuristic for global optimiza- tion over continuous spaces”, Journal of Global Optimization , Vol. 11, 1997, pp. 341–359. [11] Z. Čičková, I. Brezina and J. Pekár, “Alternative method for solving traveling salesman problem by evolutionary algorithm”, Management information system s. No. 1, 2008, pp. 17-22. [12] I. Brezina, Z. Či čková a nd J. Pekár, “Application of evolutionary approach to solving vehicle routing problem with time windows”, Economic review, Vol. 38, No. 4, 2009, pp. 529-539. [13] I. Brezina, Z. Čičko vá a nd J. Pekár, “Evolutionary approach as an alternative method for solving the vehicle routing problem”, Economic review, Vo l. 41, No. 2, 2012, pp. 137-147. [14] D. Ardia, K. Boudt, P. Carl, K. M. Mullen and B. G. Peterson, “Differential Evolution with DEoptim”, The R Journal, Vol. 3, No. 1, 2011, pp. 27-34. [15] I. Zelinka, “Umělá inteligence v problémech globální optimalizace”, BEN-technická literature, Pr aha , 2002. [16] V. Mařík, O. Štěpánková and J. Lažanský, “Umělá inteligence 4”, Academia Praha, 2003. [17] G. C. Onwubolu and B. V. Babu, “New Optimiza- tion Techniques in Engineering”, Springer-Verlag, Berlin-Heidelberg, 2004. [18] Z. Čičková, I. Brezina and J. Pekár, “A memetic algorithm for solving the vehicle routing problem”, In Mathematical methods in Economics 2011, 29th international conference, Praha, Professional Pub- lishing, 2011, pp. 125-128. 77 Copyright © 20 SciRes. 13 |