

Paper Menu >>
Journal Menu >>
 Engineering, 2013, 5, 208-214 doi:10.4236/eng.2013.51b038 Published Online January 2013 (http://www.SciRP.org/journal/eng) Copyright © 2013 SciRes. ENG Coordinated Voltage Control in Distribution Network with Renewable Energy Ba sed Dist rib ut ed Gen eration Mohd Khairun Nizam Mohd Sarmin1, Worawat Nakawiro1, Mohd Zamri Che Wanik2, Mohd FadzilMohd Siam1, ZahrulFaiziHussien1, Ahmad Asrul Ibrahim3, Ahmad Kamil Mat Hussin2 1Smart Grid Sectio n, TNB Research Malaysia, M alaysia 2Green Technology Section,TNB Research Malaysi a, Malaysia 3Power system research group, Uni vers itiKeb angsaan Malaysia, Mal aysia Email: [email protected] m.my Received 2013 ABSTRACT This paper presentsa voltage control strategy for power distribution systems with interconnected renewable energy based distributed generators (DGs). The control strategy coordinating conventional voltage control devices and reactive po wer from DG.A mixed-integer nonlinear programming problem was formulated and solved by particle swarm opti- mization (PSO). The code is written using DigSILENT programming language (DPL) and implemented inside DigSI- LENT po wer factory simulatio n software. All syste m constraints and operating limits are considered. The optimal pow- er flow based approach can incorporate various uncertainties such as intermittent po wer characteristics and varying load demand. The proposed method is tested using real distribution network to demonstrate its effectiveness. T he merits of the proposed method over the classical local-based control are presented in the simulation results. It is demonstrated that the proposed method is capable of keeping the system voltage within operating limit. Power losses is at the same time is minimized in comparison to the losses using conventional method. Keywords: Photovoltaic; D istributed G e ner a tion; Particle Swarm Optimisation; Di gSI LE NT; Coordinated Control 1. Introduction Renewable resources has gained significant attention in recent years due to the cost increment and adverse en- vironmental impacts of conventional fossil fuels [1]. Currently, Photovoltaic (PV)energy systems are considered as opti mum sol ution to the ele ctricity supply i n most r ural zones in developing countries [2,3]. PV application is gaining a lot of attention in the de- veloping countr y like Mala ysia. Feed in Tariff introduced in Malaysia in 2011 [5] is a sign that the government is serious in promoting PV as a new energy source in sup- porting Malaysian sustainable growth. Typicallya re- newable energy resource such as PV system generatese- lectricity as distributed generator (DG) is connected to distribution networks. DG application is highlighted of- fers various benefits to the distribution network where it is connected to but harve sting the benefits is not without chall enges [ 6]. Voltage contro l is one of well-documented operational challenges [7]. Currently the voltage control strategies are also developed based on the assumption of unidirec- tional power flow. However in some extreme conditions due to the intermittent and non-dispatchable characteris- tics the excess DG power could flow in a reverse direc- tion to the transformer high voltage side. Therefore a new scheme for voltage control is definitely needed in modern power distribution systems which comprising DG. Some of these control schemes can be broadly cate- gorized as tabulated in Table 1. From practical viewpoints, the offline planning ap- proach should be deployed in complimentary with an advanced online contro ller. This coord ination will enable the system to achieve economic operation and guarantee security when subject to unexpected disturbances. In this p a pe r , a n o ffline ( d a y-ahead) planning approach based on particle swarm optimization (PSO) is proposed. The approach determines optimal settings of all control devices including on-load tap changers, switched shunt capacitors, commonly found in most power distribution network. System state quantities are considered and op- erational limits is incorporated. PSO code is written in DigSILENT programming language (DPL) and the pro- posed approach is implemented in DigSILENT Power Factory [15]. 2. Voltage and Reactive Power Control The concept of power loses can be explained by referring to Figure 1. In a simple radial networ k shown in Figure 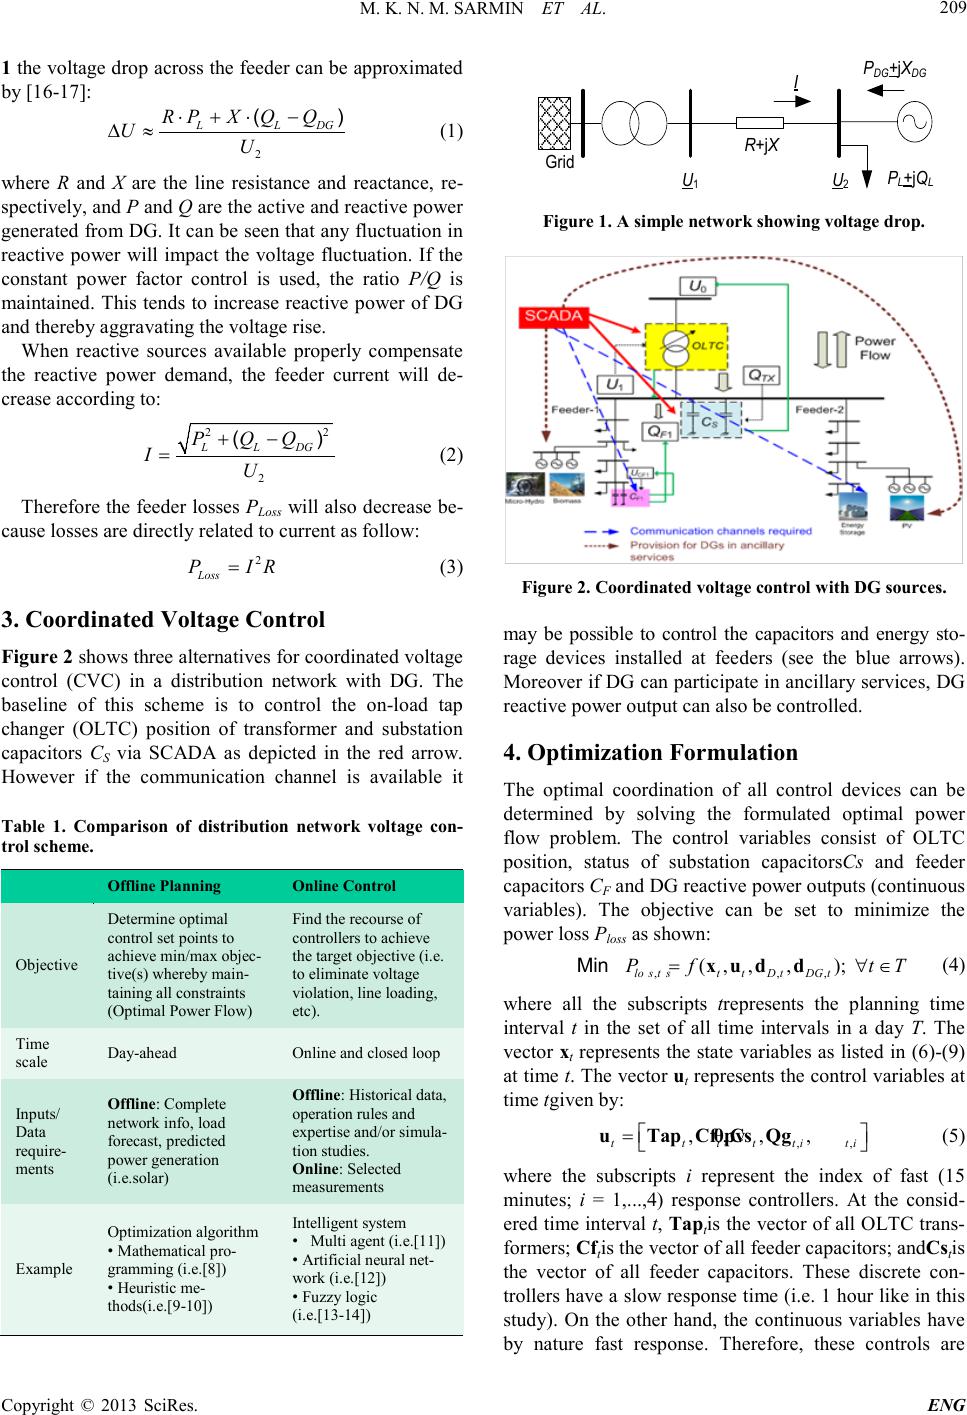 M. K. N. M. SARMIN ET AL. Copyright © 2013 SciRes. ENG 209 1 the voltage drop across the feeder can be approximated by [16-17]: 2 LL DG RPX QQ UU ⋅+⋅ − ∆≈ () (1) where R and X are the line resistance and reactance, re- spectively, and P and Q are the active and reactive power generated from DG. It can be seen that any fluctuation in reactive power will impact the voltage fluctuatio n. If the constant power factor control is used, the ratio P/Q is maintained. This tends to increase reactive power of DG and there by aggravating the v olta ge rise. When reactive sources available properly compensate the reactive power demand, the feeder current will de- crease according to: 22 2 LL DG P QQ IU +− =() (2) Therefore the feeder losses PLoss will also decrease be- cause losses are directly related to current as follow: 2 Loss P IR= (3) 3. Coordinated Voltage Control Figure 2 shows three alternatives for coordinated voltage control (CVC) in a distribution network with DG. The baseline of this scheme is to control the on-load tap changer (OLTC) position of transformer and substation capacitors CS via SCADA as depicted in the red arrow. However if the communication channel is available it Table 1. Comparison of distribution network voltage con- trol scheme. Offline Planning Online Control Objective Determine optimal control set points to achi eve min/max objec- ti v e( s) whereby main- taining all constr aints (Optimal Power Flow) Find the recourse of controllers to achieve th e t arget objective (i.e. to elimina te voltage violati on, line loa ding, etc). Time scale Day-ahead Online and closed loop Inputs/ Data require- ments Offline : Complete network info, load forecast, predicted power generation (i.e.solar) Offline : Histor ical data , operat ion rules and expertise and/or simula- tion studies. Online: S el ected measurements Example Opt imiza tion algorithm • Mat hematical pro- grammi ng (i.e.[ 8]) • Heuristic me- th o ds(i.e.[ 9-10]) Intelligent system • Multi agent ( i.e.[11]) • Ar tif icia l ne ur a l net- work (i.e.[12]) • Fuzzy logic (i.e.[13-14]) R+jX P DG +jX DG P L +jQ L I Grid U 1 U 2 Figure 1 . A simple network showi ng vol tage drop. Figure 2. Coordinated voltage control with DG sources. may be possible to control the capacitors and energy sto- rage devices installed at feeders (see the blue arrows). Moreover if DG can participate in ancillary service s, DG reactive power output can also be controlled. 4. Optimization Formulation The optimal coordination of all control devices can be determined by solving the formulated optimal power flow problem. The control variables consist of OLTC position, status of substation capacitorsCs and feeder capacitors CF and DG reactive po wer out put s (co ntinuous variables). The objective can be set to minimize the power loss Ploss as shown: , ,, ( ,,,); losst ttDtDGt P ftT= ∀∈Min xud d (4) where all the subscripts trepresents the planning time interval t in the set of all time intervals in a day T. The vector xt represents the state variables as listed in (6)-(9) at time t. The vector ut represents the control variables at time tgiven by: ,, ,,, , tt tttiti = uTap Cf Cs Qgθpv (5) where the subscripts i represent the index of fast (15 minutes; i = 1,...,4) response controllers. At the consid- ered time interval t, Taptis the vecto r of all OLTC trans- formers; Cftis the vector of all feeder capacitors; andCstis the vector of all feeder capacitors. These discrete con- tro llers ha ve a slo w resp onse t ime (i. e. 1 ho ur li ke in thi s study). On the other hand, the continuous variables have by nature fast response. Therefore, these controls are  M. K. N. M. SARMIN ET AL. Copyright © 2013 SciRes. ENG 210 discretized with a smaller time step i (15 minutes; i = 1,...,4 for any planning hour t). At time t, the vector Qgt,icontains reactive power output for all synchronous DGs and the vector θpvt,i contains the power factor set point for all solar PV co nverter. The network should be operated within a narrow band of voltage variation to ensure safety of power system equipments and supply quality min , maxit U UUit≤≤∀∈ ∀∈ , B NT (6) whereUi,tis t he volta ge o f b usi at time t; Uminand Umax are mini mum and maxi mum allo wable voltages, respectively and NB is the set of controlled buses. The current flo w in all lines must be maintained b elo w the rating limit ,, ,,Ljt Lj II jt≤∀∈ ∀∈ rat , L NT (7) where IL,j,tis the current flow on line j at time t; IL,j,rat is the the rma l capacity of line j and NL is the set of all lines. The apparent power transfer on the substation trans- former is limited to prevent any overloading ,t SS t≤ ∀∈ TX TX,rat , T (8) where STX,t is the apparent power flow on substation transformer at time t and STX,rat is the capacity rating of the substation transformer. When DGs are centrally dispatched, the operating re- gion is restricted by the power factor operating limits described as: min,maxmin, maxkt kt PFPF PF kt θ θθ ≤≤⇒ ≤≤ ∀ ∈∀∈ DG NT (9) wherePFmin and PFmax are minimum and maximum op- erating power factor of DGs (here assumed common for all DGs for simplicity), respectively. To consider induc- tive and capacitive operating range of DGs, the power factor angle θ is preferred because it is positive for lag- ging (inductive) and leading (capacitive) power factors. The angle θ is constrained in the range between the min- imum and operating power factor angles [ θ min, θ max ]. The NDGrepresents the set of all DGs. As mentioned earlier that the proposed control meth- odology will provide the set of opti mal control set -points for the day-ahead operation. Therefore the necessary input data is forecast of the load demand and predicted generation pattern to be dispatched for the next 24 hours. The developed optimization algorithm will iteratively search for the best control variables which resulting in the minimum total power losses while maintaining all operational bounds and system security constraints. The heuristic optimization approach is preferred be- cause of its ability to handle complex problems without any need for an explicit mathematical model. For every iteration, the power system analysis (DigSILENT) is called and load flow simulation is performed to deter- mine the power system states corresponding to the con- trol variable s updated by the optimization algorith m. T he outputs of this method are the optimal position of trans- former tap changers and the optimal status of capacitors for the next da y of ope ration. The exp lanation given ear- lier can be depicted as in Figure 3. 5. PSO Implementation PSO algorith m flow char t is d epicted in Figure 4. A par- ticle iflies in the search space between two successive iterations acco rding to: ( )()( ) 11 i ii t tt+=+ +xxv (10) The or iginal eq uatio n for velocity update is given by: ()( ) ( ) ( ) 1 2 1() () () () i ttctt c tt += +− +− ii1pi 2g i vvrx x rx x (11) The randomness in the search procedure is introduced by two independent uniform random sequences, r1 and r2 in the range (0, 1). The weighting coefficients c1 and c2 are the acceleration coefficients which control the influ- ence of cognitive and social parameters on the particle’s velocity. Figure 3. Co nceptual diagram of the developed OPF . Figure4 . PSO algorithm flow chart.  M. K. N. M. SARMIN ET AL. Copyright © 2013 SciRes. ENG 211 In thi s wo rk, t he sta nd ard PSO versi o n 200 6 was used . The parameters w and c remain unchanged from [18]. The global best position in the swarm xg is considered as xg∈{xp1, xp2 ,…….., xps} suc h that ( )() 12 fmin f(),f(),........,f()= gp pps xxx x (12) Constraint handli ng is the most important pa rt in sol v- ing a constrained optimization problem. Fitness functions are used to assign a qualitative measure to individuals in the population. To properly handle constraints in PSO, the fitness function should be carefully designed such that it can help guide the swarm process to the promising and feasible search space. The self-learning penalty function proposed in [19] is applied. The elegant feature of this technique is that it is parameter-less and capable of adjusting the penalized fitness function at different stages of the search process. 6. Distribution Network This section presents the network model used for simula- tions in this research work. A part of real distribution network in middle region of peninsular Malaysia was chosen as the test network and the schematic diagram is shown in Figure 5. This is a distribution network sup- plied by two substations. The system basically operates as a radial network with options for feedback from the other 33/11 kV substation in case of breakdown. Since our assumption is to have high degree of DG penetration, therefore 5x1 MVA synchronous DGs and 5x1 MW solar PV are assumed to be installed at various loca tio ns thro ug hout t he net w or k. All DG s and sol ar P Vs are connected at 11 kV busbars. The 11 kV busbar is supplied by two 33/11 kV transformers namely Tr(L1) and Tr (L2). In the simulation, all the loads are assumed to be of constant power type with the power factor of 0.9 induc- tive. Average power factor was stated to be 0.9. A future- istic load pattern with the peak of 12.8 MW (presently about 5 MW) is assumed as shown in Figure 6(a). The power output for each solar PV is illustrated in Fig- ure6(b) . This data is obtained by fitting the real-meas- urements from a test unit of 3 kW solar PV into the nor- mal (Gaussian) distribution. This unit is installed on the rooftop one of the building at UniversitiTenagaNasional main ca mpus. This assumption may not be accurate since the statis- tical characteristics of solar energy is quite complicated and varied due to several factors. Finally, the power gen- eration dispatch of synchronous DG is included in the study scope. Therefore, two generation levels are as- sumed fo r all syn chro no us D Gs as s hown in Figure 6( c). DigSILENT Power Factory [15] is used as the power system analysis software and the PSO code is written in DP L. Figure 5. Schematic diagram of the test net work. 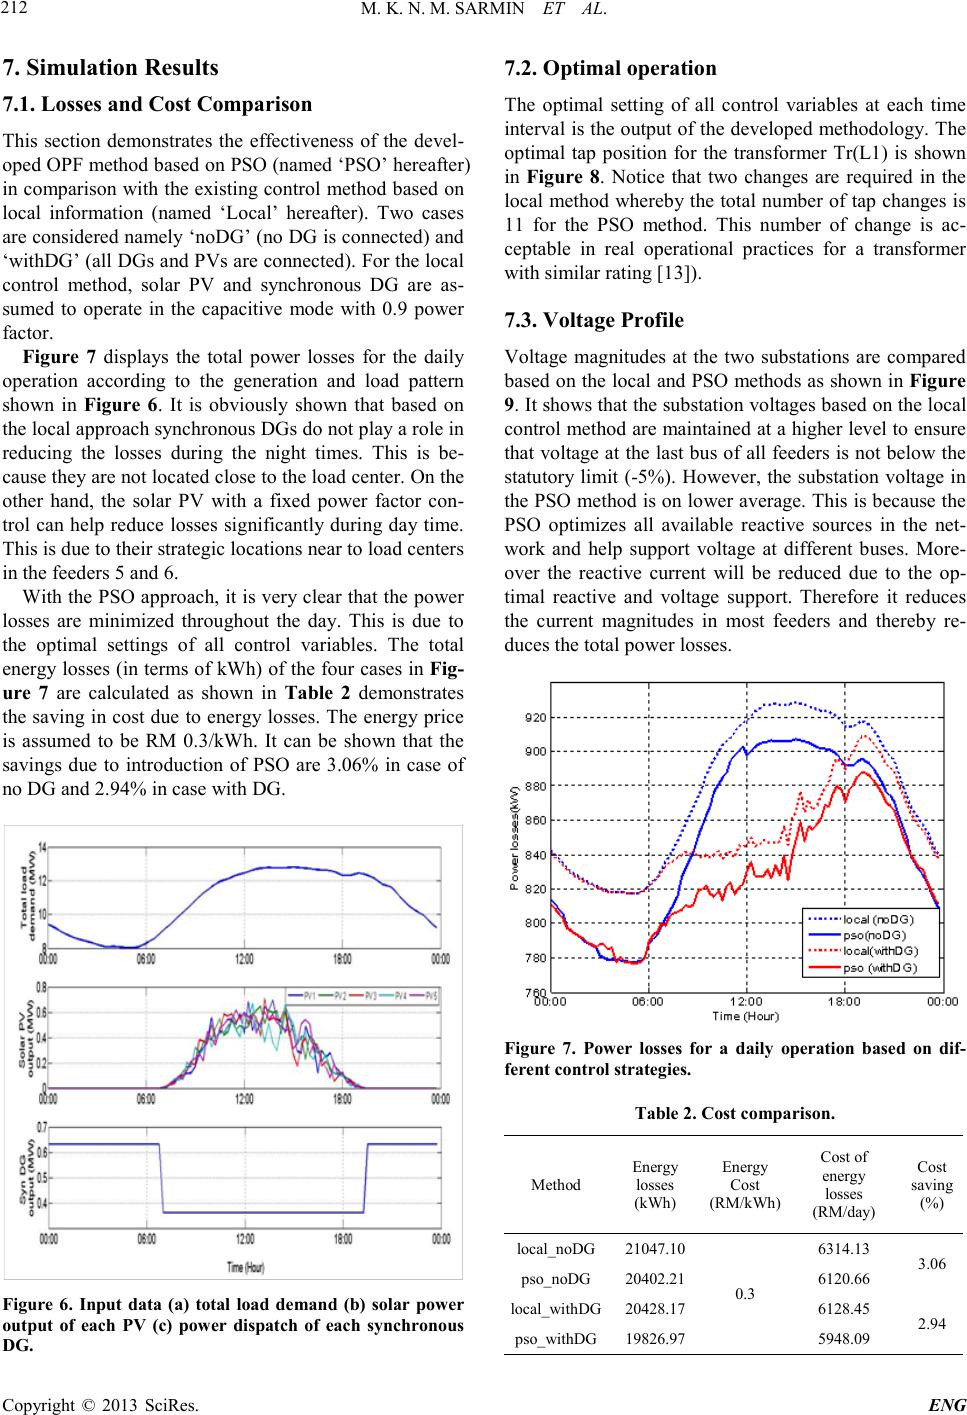 M. K. N. M. SARMIN ET AL. Copyright © 2013 SciRes. ENG 212 7. Simulation Results 7.1. Losses and Cost Comparison This section demonstrates the effectiveness of the devel- oped OPF method based on PSO (named ‘PSO’ hereafter) in co mparison with the existing control method based on local information (named ‘Local’ hereafter). Two cases are considered namely ‘noDG’ (no DG is connected) and ‘withDG’ (all DGs a nd PVs are co nnected). For the local control method, solar PV and synchronous DG are as- sumed to operate in the capacitive mode with 0.9 power factor. Figure 7 displays the total power losses for the daily operation according to the generation and load pattern shown in Figure 6. It is obviously shown that based on the local approach synchronous DGs do not play a role in reducing the losses during the night times. This is be- cause they are not located close to the load center. On the other hand, the solar PV with a fixed power factor con- trol can help reduce losses significantly during day time. This is due to their stra tegic locations near to load c e nters in the feeders 5 and 6. With the PSO approach, it is very clear that the power losses are minimized throughout the day. This is due to the optimal settings of all control variables. The total energy losses (in terms of kWh) of the four cases in Fig- ure 7 are calculated as shown in Table 2 demonstrates the sa ving i n cost due to ener gy losse s. T he energy p rice is assumed to be RM 0.3/kWh. It can be shown that the savings due to introduction of PSO are 3.06% in case of no DG and 2.94% in case with DG. Figure 6. Input data (a) total load demand (b) solar power output of each PV (c) power dispatch of each synchronous DG. 7.2. Optimal operation The optimal setting of all control variables at each time interval is the output of the developed methodology. The optimal tap position for the transformer Tr(L1) is shown in Figure 8. Notice that two changes are required in the local method whereby the total number of tap changes is 11 for the PSO method. This number of change is ac- ceptable in real operational practices for a transformer with similar r a ting [13]). 7.3. Voltage Profile Voltage magnitudes at the two substations are compared based on the local and PSO methods as shown in Figure 9. It shows that the substation voltage s based o n the local control method a re maintained at a higher level to ensure that voltage at the last bus of all feed ers is not belo w the statutory limit (-5%). Ho wever, the s ubstation volta ge in the PSO method is on lower average. This is beca use the PSO optimizes all available reactive sources in the net- work and help support voltage at different buses. More- over the reactive current will be reduced due to the op- timal reactive and voltage support. Therefore it reduces the current magnitudes in most feeders and thereby re- duces the total power losses. Figure 7. Power losses for a daily operation based on dif- ferent control strategies. Table 2. Cost comparison. Method Energy losses (kWh) Energy Cost (RM/kWh) Cost of energy losses (RM/d ay) Cost saving (%) local_noD G 21047.10 0.3 6314.13 3.06 pso_noDG 20402.21 6120.66 local_withDG 20428.17 6128.45 2.94 pso_withDG 19826.97 5948.09 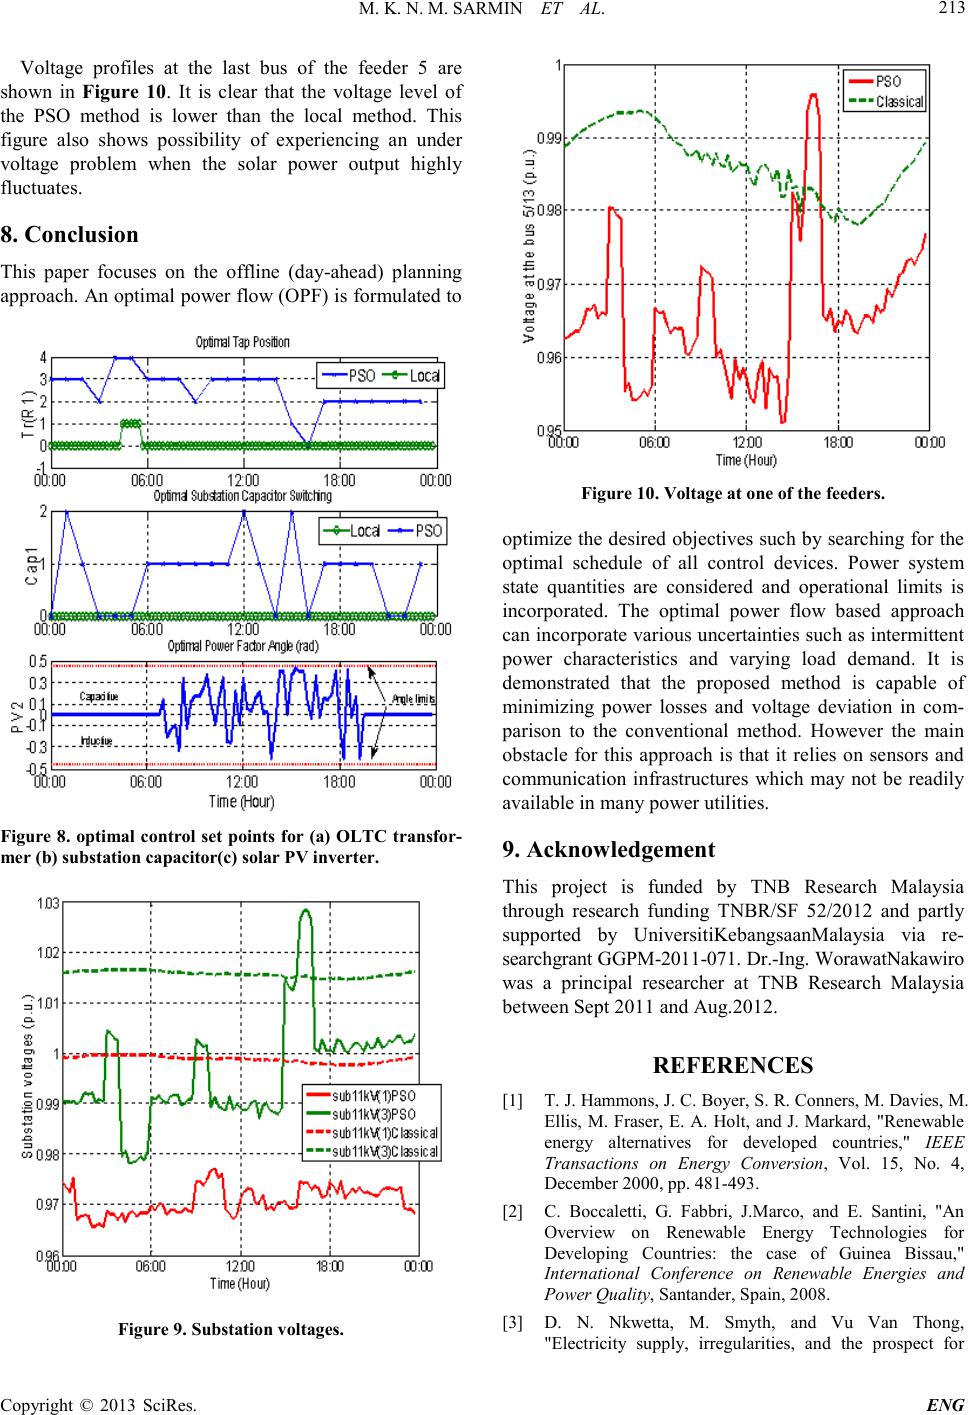 M. K. N. M. SARMIN ET AL. Copyright © 2013 SciRes. ENG 213 Voltage profiles at the last bus of the feeder 5 are shown in Figure 10. It is clear that the voltage level of the PSO method is lower than the local method. This figure also shows possibility of experiencing an under voltage problem when the solar power output highly fluctuates. 8. Conclusion This paper focuses on the offline (day-ahead) planning approach. An optimal power flow (OPF) is formulated to Figure 8. optimal control set points f or (a) OLTC transfor- mer (b) substatio n capacitor(c) solar PV inverter. Figure 9. S ubstation voltage s. Figure 10. Voltage at one of the feeders. optimize the desired objectives such by searching for the optimal schedule of all control devices. Power system state quantities are considered and operational limits is incorporated. The optimal power flow based approach can incorporate various uncertainties suc h as intermitte nt power characteristics and varying load demand. It is demonstrated that the proposed method is capable of minimizing power losses and voltage deviation in com- parison to the conventional method. However the main obstacle for this approach is that it relies on sensors and communication infrastructures which may not be readily available in many power util ities. 9. Acknowledgement This project is funded by TNB Research Malaysia through research funding TNBR/SF 52/2012 and partly supported by UniversitiKebangsaanMalaysia via re- sear ch gra nt G GP M-2011-071. Dr.-Ing. WorawatNakawiro was a principal researcher at TNB Research Malaysia between Sept 2011 and Aug.2012. REFERENCES [1] T. J. Hammons, J. C. Boyer, S. R. Conners, M. Davies, M. Ellis, M. Fraser, E. A. Holt, and J. Markard, "Renewable energy alternatives for developed countries," IEEE Transactions on Energy Conversion, Vol. 15, No. 4, December 2000, pp. 481-493. [2] C. Boccaletti, G. Fabbri, J.Marco, and E. Santini, "An Overview on Renewable Energy Technologies for Developing Countries: the case of Guinea Bissau," International Conference on Renewable Energies and Power Quality, Santander, Spain, 2008. [3] D. N. Nkwetta, M. Smyth, and Vu Van Thong, "Electricity supply, irregularities, and the prospect for 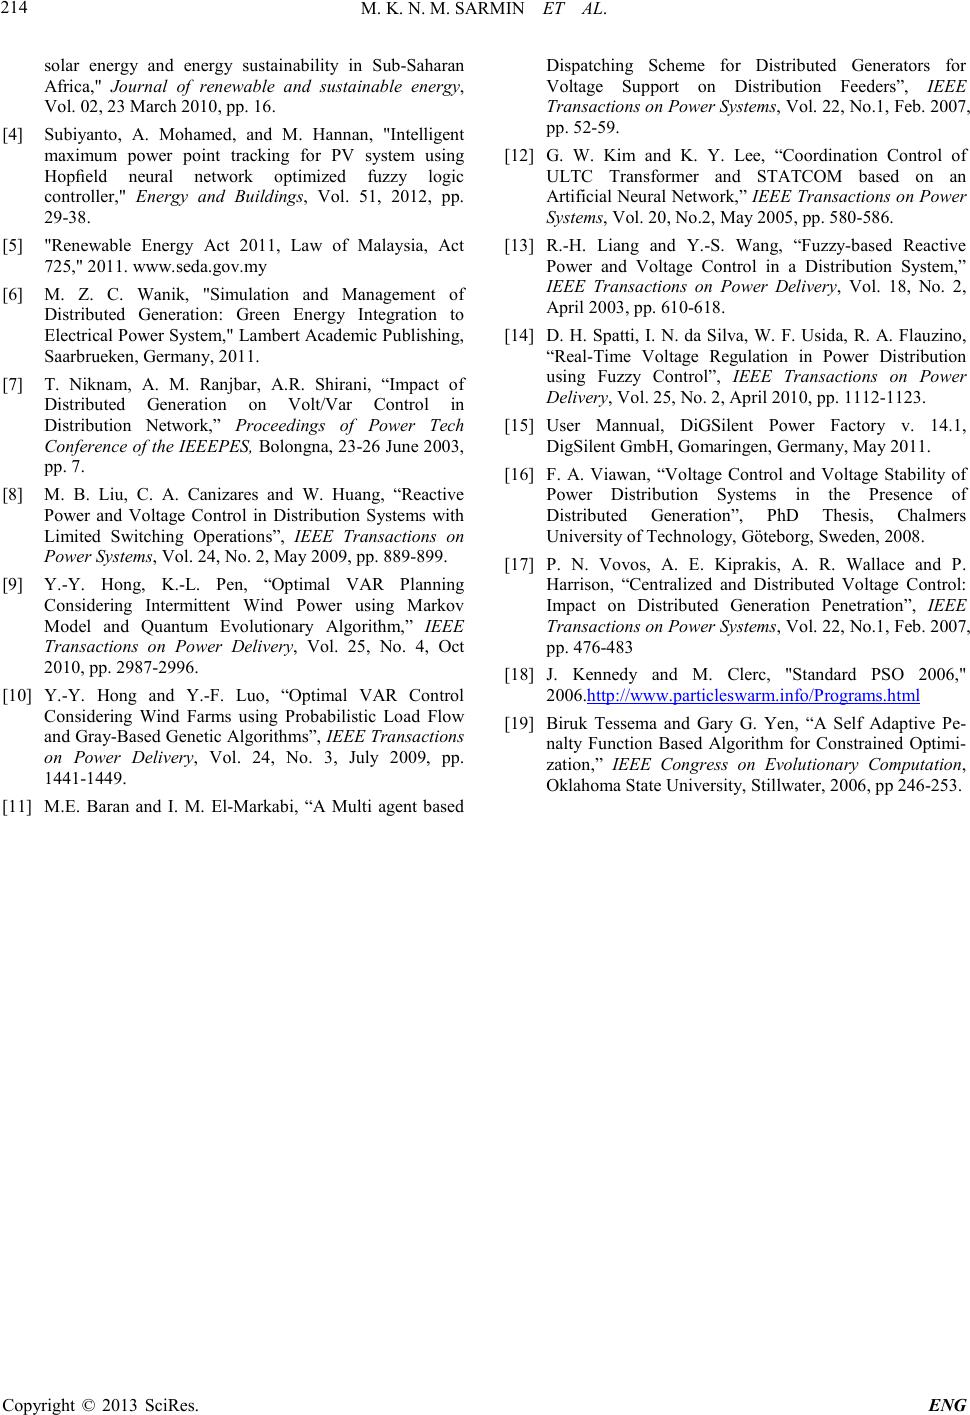 M. K. N. M. SARMIN ET AL. Copyright © 2013 SciRes. ENG 214 solar energy and energy sustainability in Sub-Saharan Africa," Journal of renewable and sustainable energy, Vol. 02, 23 Ma rc h 2010, pp. 16. [4] Subiyanto, A. Mohamed, and M. Hannan, "Intelligent maximum power point tracking for PV system using Hopfield neural network optimized fuzzy logic controller," Energy and Buildings, Vol. 51, 2012, pp. 29-38. [5] "Renewable Energy Act 2011, Law of Malaysia, Act 725," 2011. www.seda.gov.my [6] M. Z. C. Wanik, "Simulation and Management of Distributed Generation: Green Energy Integration to Electri cal Power Syst em," Lambe rt Academic P ublis hing, Saarbrueken, Germany, 2011. [7] T. Niknam, A. M. Ranjbar, A.R. Shirani, “Impact of Distributed Generation on Volt/Var Control in Distribution Network,” Proceedings of Power Tech Conference of the IEEEPES, Bolongna, 23-26 June 2003, pp. 7. [8] M. B. Liu, C. A. Canizares and W. Huang, “Reactive Power and Voltage Control in Distribution Systems with Limited Switching Operations”, IEEE Transactions on Power Systems, Vol. 24, No. 2, May 2009, pp. 889-899. [9] Y.-Y. Hong, K.-L. Pen, “Optimal VAR Planning Considering Intermittent Wind Power using Markov Model and Quantum Evolutionary Algorithm,” IEEE Transactions on Power Delivery, Vol. 25, No. 4, Oct 2010, pp . 2987-2996. [10] Y.-Y. Hong and Y.-F. Luo, “Optimal VAR Control Considering Wind Farms using Probabilistic Load Flow and Gray-Based Genetic Algori thms”, IEEE Transactions on Power Delivery, Vol. 24, No. 3, July 2009, pp. 1441-1449. [11] M.E. Baran and I. M. El-Markabi, “A Multi agent based Dispatching Scheme for Distributed Generators for Voltage Support on Distribution Feeders”, IEEE Transactions on Power Systems, Vol. 22, No.1, Feb. 2007, pp. 52-59. [12] G. W. Kim and K. Y. Lee, “Coordination Control of ULTC Transformer and STATCOM based on an Artificial N eural Net work,” IEEE Transactions on Power Systems, Vol. 20, No.2, May 2005, pp. 580-586. [13] R.-H. Liang and Y.-S. Wang, “Fuzzy-based Reactive Power and Voltage Control in a Distribution System,” IEEE Transactions on Power Delivery, Vol. 18, No. 2, April 2003, pp. 610-618. [14] D. H. Spatti, I. N. da Silva, W. F. Usida, R. A. Flauzino, “Real-Time Voltage Regulation in Power Distribution using Fuzzy Control”, IEEE Transactions on Power Delivery, Vol. 25, No. 2, April 2010, pp. 1112-1123. [15] User Mannual, DiGSilent Power Factory v. 14.1, DigSilent GmbH, Gomaringen, Germany, May 2011. [16] F. A. Viawan, “Voltage Control and Voltage Stability of Power Distribution Systems in the Presence of Distributed Generation”, PhD Thesis, Chalmers University of Technology, Göteborg, Sweden, 2008. [17] P. N. Vovos, A. E. Kiprakis, A. R. Wallace and P. Harrison, “Centralized and Distributed Voltage Control: Impact on Distributed Generation Penetration”, IEEE Transactions on Power Systems, Vol. 22, No.1, Feb. 2007, pp. 476-483 [18] J. Kennedy and M. Clerc, "Standard PSO 2006," 2006.http://www.particleswarm.info/Programs.html [19] Biruk Tessema and Gary G. Yen, “A Self Adaptive Pe- nalty Function Based Algorithm for Constrained Optimi- zation,” IEEE Congress on Evolutionary Computation, Oklahoma State University, Stillwater, 2006, pp 246-253. |