

Paper Menu >>
Journal Menu >>
 Engineering, 2013, 5, 146-151 doi:10.4236/eng.2013.51b027 Published Online January 2013 (http://www.SciRP.org/journal/eng) Copyright © 2013 SciRes. ENG Live Line Mea surin g t h e P aramet ers of 220 kV Transmission Lines with Mutual Inductance in Hainan Power Gri d Zhongzhu Xu1, Zhijian Hu2, Chuanqi Li2 1Hainan Power Technology Research Institute, Hainan Power Grid Corporation, Haikou, China 2Scho ol of Electri cal Engineering, Wuhan University, Wuhan, China Email:[email protected] Received 2013 Abstract A live line measurement method for the zero sequence parameters of transmission lines with mutual inductance is in- troduced. The mathematical models of the meas urement me thod are given. Global Positioning S ystem (GPS) is used as the synchrono us signal for the meas urement carried out at differe nt substations simultaneousl y. The measurement sys- tem and digital si mulation re sult s are give n. Fi nal ly, t he liv e line mea sure me nt re sults of t wo 220 kV t rans mis sio n line s with mutual i nducta nce in Ha inan gri d are given. Re sults from both simulatio n and on-sit e measur ement s how tha t the live line measurement method is feasible, and its measurement accuracy can satisfactorily meet the requirements of en- gineer i n g mea sur e me nt . Keywords: Trans mi s s i on lines; Zero sequence para meter; Mutual inductance ; Live line me a s ure me n t; GPS 1. Introduction Accurate line parameters are the foundation of r ela y p ro- tection setting calculation, fault location, fault analysis, network loss and power flow calculation. With the in- creasme n t of tra nsmission line s on the same towers, zero sequence parameters will affect the fault states and zero sequence currents of lines [1]-[4]. The traditional methods have the formulas calculation met hod [5] and the o utage me asure ment methods [6]-[7]. The zero sequence impedances of lines are affected by many factors, such as line alignment and ground resis- tance. The calculated values are unable to meet the re- quirement of relay protection setting calculation. For example, if we use the calculated values in the setting calculatio n, it will make t he pr otecti on refu sing act ion o r mis-operation. So it is a great threat to the safe and stable operation of power system. Acc ord ing to the r egulat ions, the zero sequence impedances of the overhead lines and cables shoul d be obtained by actual measuremen t [8]. The traditional measurement met hods can only be used under the cases that all lines must be withdrawn from normal operation. Because the transmission lines are distributed components, the line length is over 1000 kilometers and the electromagnetic coupling between lines which cause the measurement of line parameters difficulty. To measure the zero sequence self inductance of a new line, because the new line has electromagnetic coupling with other live lines, the parameters of the new line cannot be measured independently with the tradi- tional methods. We should withdraw all the lines from normal operation before measuring the zero sequence parameters. Obviously, it is not acceptable for power system. So the traditional measuremen t met h o ds cannot satisfy the req ui rement of mode rn power system. A new live line measur ement method based on Global Positioning System (GPS) technology is introduced and has been successfully applied in the live line measure- ment of two 220 kV transmission lines with mutual in- ductance in Hainan power grid. T he measurement results of the live line measurement met h od prove that it can meet the requirement of parameter measur ement of transmission li nes. 2. The Theory of the Live Line Measurement Method The algebra equation sets of n transmission lines with mutual inductance can be described as follows, 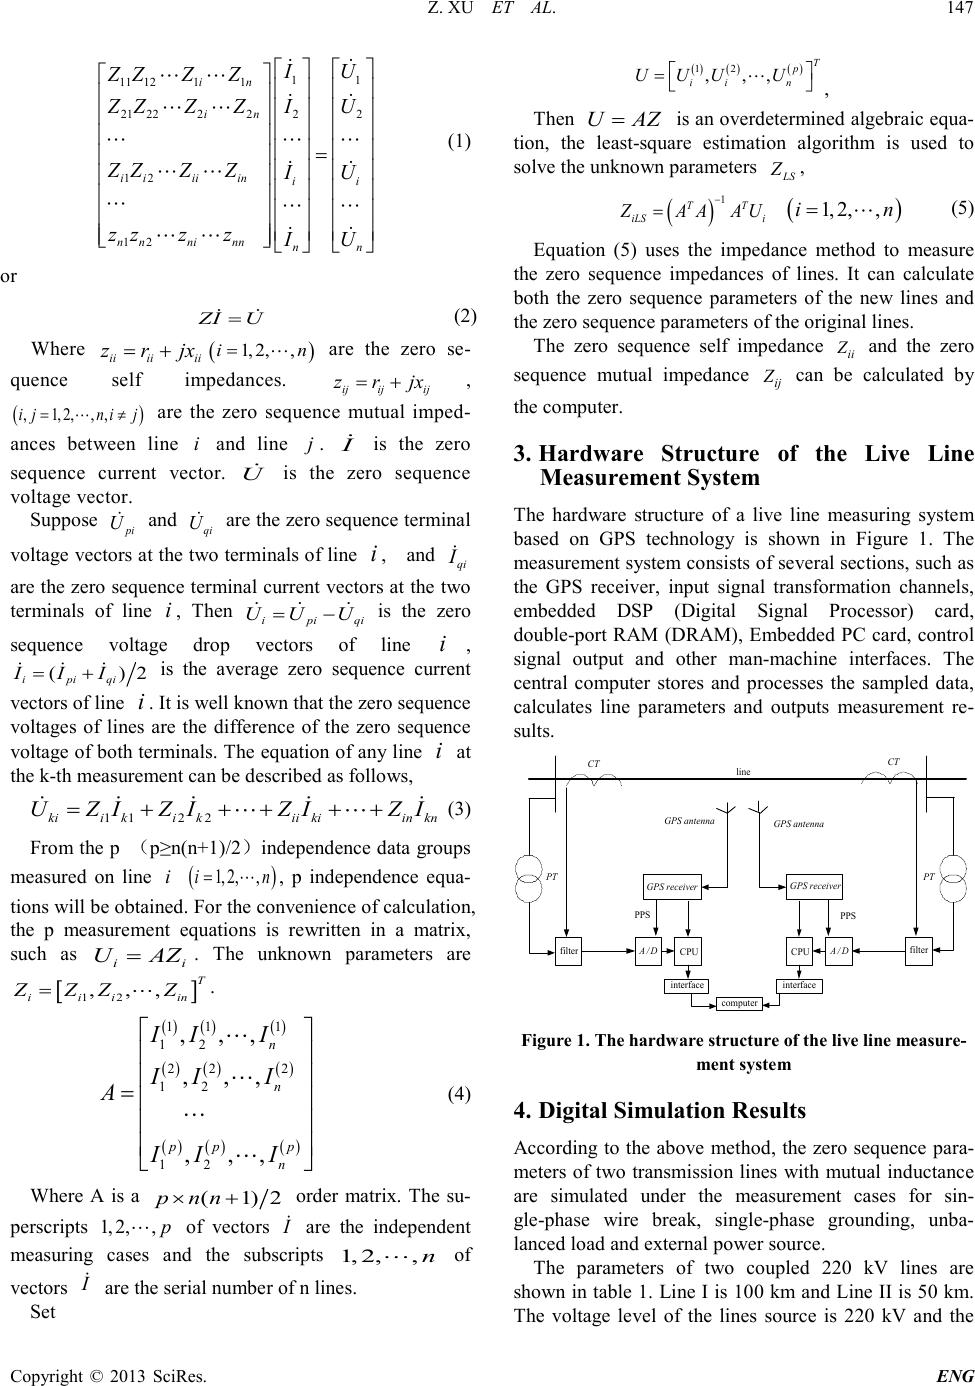 Z. XU ET AL. Copyright © 2013 SciRes. ENG 147 11 11 1211 21 222222 12 12 in in i iiiinii n nninnnn IU ZZZ Z ZZZZI U ZZZ ZIU zzz zIU = (1) or ZI U= (2) Where ii iiii zr jx= + ( ) 1, 2,,in= are the zero se- quence self impedances. ij ijij zr jx= + , ( ) ,1, 2,,,i jnij= ≠ are the zero sequence mutual imped- ances between line i and line j . I is the zero sequence current vector. U is the zero sequence vol ta ge ve cto r. Suppose pi U and qi U are the zero sequence terminal voltage vector s at the two ter minals of li ne i , and qi I are the zero sequence terminal current vectors at the two terminals of line i , Then ipiqi UU U= − is the zero sequence voltage drop vectors of line i , ( )2 ipiqi III= + is the average zero sequence current vectors of line i . It is well known that t he zero sequence voltages of lines are the difference of the zero sequence voltage of bo th terminals. The equat ion o f any l ine i at the k-th measurement can be described as follows, 112 2kiikikii kiin kn UZIZ IZIZI=+++ ++ (3) Fro m t he p (p≥n(n+1)/2)independence data groups measured on line i ( ) 1, 2,,in= , p independence equa- tions will be obta ined. Fo r the co nveni e nc e o f calculation, the p measurement equations is rewritten in a matrix, such as ii U AZ= . The unknown parameters are [ ] 12 , ,, T ii iin Z ZZZ= . ( )( )( ) ( )( )( ) ( )( )( ) 11 1 12 22 2 12 12 , ,, , ,, , ,, n n pp p n II I II I A II I = (4) Where A is a (1) 2p nn×+ order matrix. The su- perscripts 1, 2,,p of vectors I are the independent measuring cases and the subscripts 1, 2,, n of vectors I are the serial number of n lines. Set ( )()() 12 , ,, T p ii n U UUU = , Then U AZ= is an overdetermined algebraic equa- tion, the least-square estimation algorithm is used to solve the unknown parameters LS Z , ( ) 1 TT iLS i ZA AAU − = ( ) 1, 2,,in= (5) Equation (5) uses the impedance method to measure the zero sequence impedances of lines. It can calculate both the zero sequence parameters of the new lines and the zero sequence parameters of the origi nal lines. The zero sequence self impedance ii Z and the zero sequence mutual impedance ij Z can be calculated by the computer. 3. Hardware Structure of the Live Line Measurement System The hardware structure of a live line measuring system based on GPS technology is shown in Figure 1. The measurement system consists of several sections, such as the GPS receiver, input signal transformation channels, embedded DSP (Digital Signal Processor) card, double-port RAM (DRAM), Embedded PC card, control signal output and other man-machine interfaces. The central computer stores and processes the sampled data, calculates line parameters and outputs measurement re- sults. CT PT filter A/D CPU interface GPS receiver CT PT filter A/D CPU interface line computer PPS PPS GPS antennaGPS antenna GPS receiver Figure 1 . The hardware structu re of the live line measure- ment system 4. Digital Simulation Results According to the above method, the zero sequence para- meters of two transmission li nes with mutual inductance are simulated under the measurement cases for sin- gle-phase wire break, single-phase grounding, unba- lanced load and external power source. The parameters of two coupled 220 kV lines are shown in table 1. Line I is 100 km and Line II is 50 km. The voltage level of the lines source is 220 kV and the 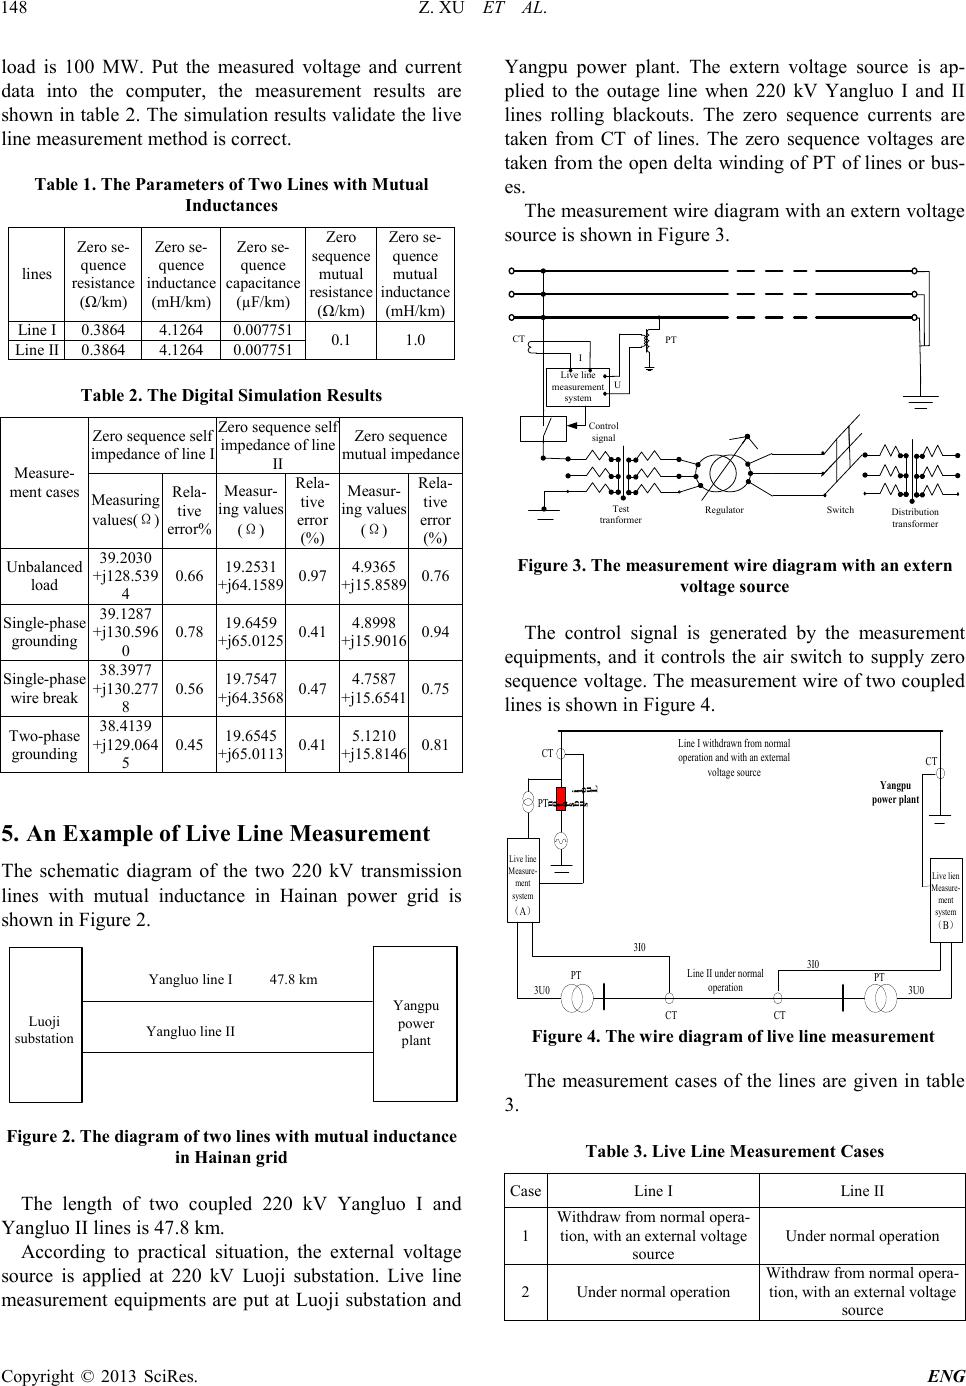 Z. XU ET AL. Copyright © 2013 SciRes. ENG 148 load is 100 MW. Put the measured voltage and current data into the computer, the measurement results are sho wn in t able 2. The simulation result s valid ate the live line measurement method is correct. Table 1. The Parameters of Two Lines wit h Mutual Induc t ances lin es Zero se- quence resistance (Ω/km) Zero se- quence inductance (mH/km) Zero se- quence capacitance (µF/km) Zero sequence mutual resistance (Ω/km) Zero se- quence mutual inductance (mH/km) Line I 0.3864 4.1264 0.007751 0.1 1.0 Line II 0.3864 4.1264 0.007751 Table 2. The Digital Simulation Results Measure- ment cases Zero sequence self impedanc e of line I Zero sequence self impeda n ce of line II Zero sequence mutua l im peda n ce M easuring values(Ω) Rela- tive error% Measur- ing values (Ω) Rela- tive error (%) Measur- ing values (Ω) Rela- tive error (%) Unbalanced load 39.2030 +j128.539 4 0.66 19.2531 +j64.1589 0.97 4.9 365 +j15.8589 0.76 Single- phase grounding 39.1287 +j130.596 0 0.78 19.6459 +j65.0125 0.41 4.8 998 +j15.9016 0.94 Single- phase wire break 38.3977 +j130.277 8 0.56 19.7547 +j64.3568 0.47 4.7 587 +j15.6541 0.75 Two-phase grounding 38.4139 +j129.064 5 0.45 19.6545 +j65.0113 0.41 5.1 210 +j15.8146 0.81 5. An Example of Live Line Measurement The schematic diagram of the two 220 kV transmission lines with mutual inductance in Hainan power grid is sho wn in F i gure 2. Yangpu power plant 47.8 kmYangluo line I Yangluo line II Luoji substation Figure 2. The diagram of two lines with mutual inductance in Haina n gri d The length of two coupled 220 kV Yangluo I and Yangluo II lines is 47.8 km. According to practical situation, the external voltage source is applie d at 220 kV Luoji substation. Live line measurement equip ments are put at Luoji substation a nd Yangpu power plant. The extern voltage source is ap- plied to the outage line when 220 kV Yangluo I and II lines rolling blackouts. The zero sequence currents are taken from CT of lines. The zero sequence voltages are taken from the open delta winding of PT of lines or bus- es. The measure me nt wire d iagra m with a n exte rn vol tage source is shown in F ig ure 3. I U CT Live line measurement system PT Test tranformer RegulatorSwitch Distribution transformer Control signal Figure 3. The measurement wire diagram with an ex t ern voltag e sou r c e The control signal is generated by the measurement equipments, and it controls the air switch to supply zero sequence voltage. The measurement wire of two coupled lines is sho wn in Figure 4. Live lien Measure- ment system (B) Yangpu power plant Live line Measure- ment system (A) PT CT Line II under normal operation CT PT 3I0 3I0 3U0 3I0 3U0 Line I withdrawn from normal operation and with an external voltage source L u o j i s u b s t a t i o n CT CT PT Figure 4. T he wire diagram of live li ne mea s ur eme n t The measurement cases of the lines are given in table 3. Table 3. Live Line Measurement Cases Case Li ne I Line II 1 Withdraw from normal opera- tion, with an ext ernal voltage source Under normal operation 2 Under normal operation Withdraw from norm al opera- tion, with an ext ernal voltage source 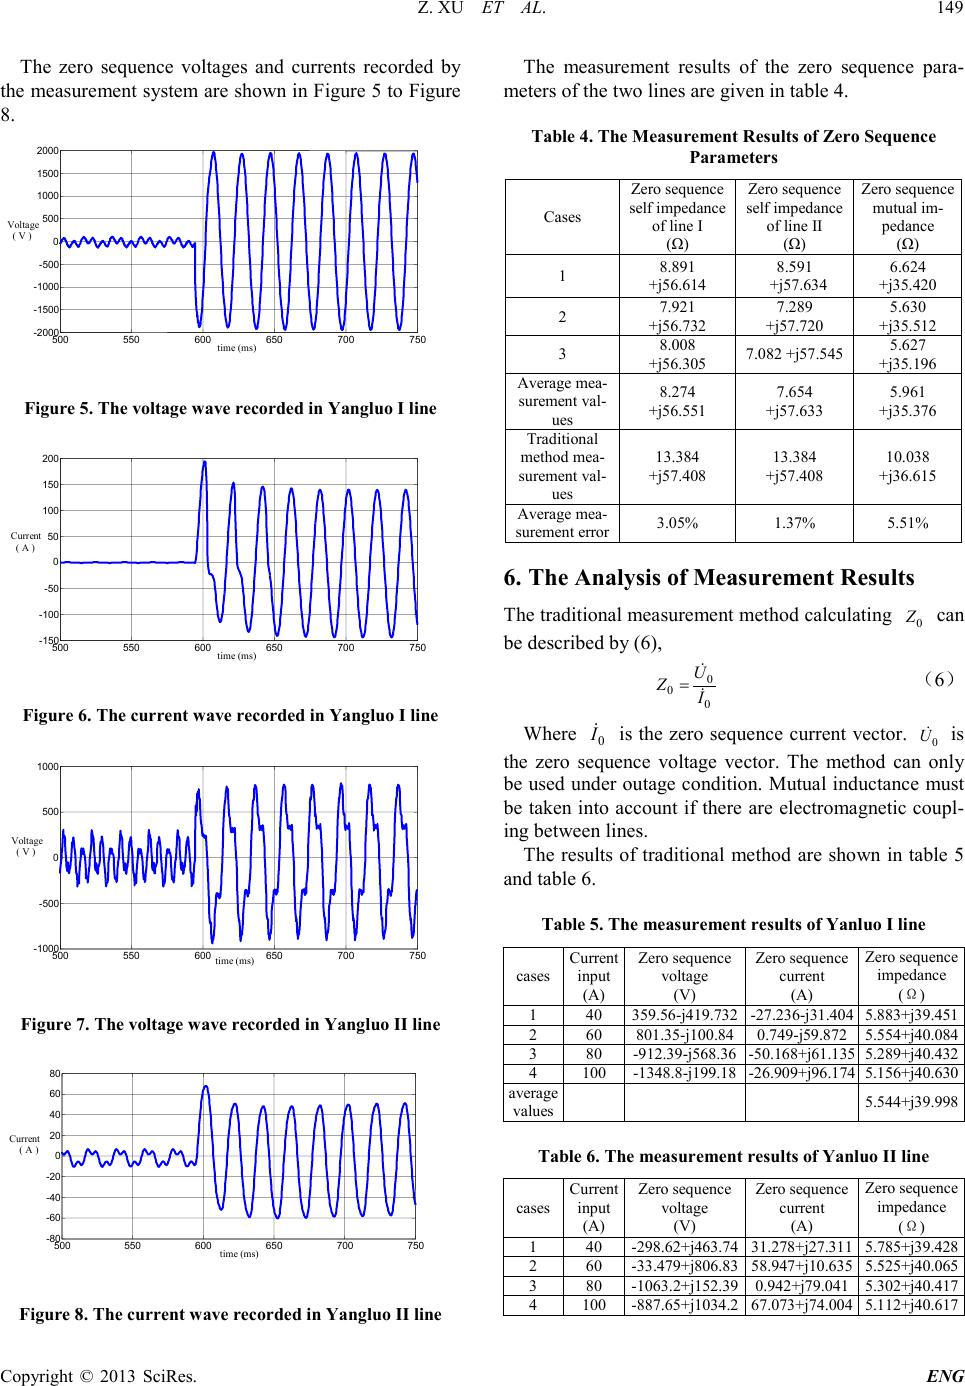 Z. XU ET AL. Copyright © 2013 SciRes. ENG 149 The zero sequence voltages and currents recorded by the measurement syste m are s hown i n Fig ure 5 to Figure 8. Figure 5. The voltage wave recorded i n Yang luo I line Figure 6. The current wave re corded in Ya ngluo I line Figure 7. The voltage wave recorded i n Yang luo I I line Figure 8. The current wave r ecorded in Yangluo II line The measurement results of the zero sequence para- meters of the two lines are given in table 4. Table 4. The Measurement Results of Zero Sequence Parameters Cases Zero sequence self i mpedan ce of line I (Ω) Zero sequence self i mpedan ce of line II (Ω) Zero sequence mutual im- pedance (Ω) 1 8.891 +j56.614 8.591 +j57.634 6.624 +j35.420 2 7.921 +j56.732 7.289 +j57.720 5.630 +j35.512 3 8.008 +j56.305 7.08 2 +j57. 545 5.627 +j35.196 Average mea- surem ent val- ues 8.274 +j56.551 7.654 +j57.633 5.961 +j35.376 Traditional method mea- surem ent val- ues 13.384 +j57.408 13.384 +j57.408 10.038 +j36.615 Average mea- surem ent er ror 3.05% 1.37% 5.51% 6. The Analysis of Measurement Results The trad itional meas ure ment met hod ca lculating 0 Z can be described by (6), 0 00 U ZI = (6) Where 0 I is the zero sequence current vector. 0 U is the zero sequence voltage vector. The method can only be use d under outage condit ion. Mutua l induct ance mu st be taken into account if there are electromagnetic coupl- ing between lines. The results of traditional method are shown in table 5 and table 6. Table 5. The measurement resul ts of Yanl uo I line cases Current input (A) Zero sequence voltage (V) Zero sequence current (A) Zero sequence impedance (Ω) 1 40 359.56-j419.732 -27.236-j31.404 5.883+j39.451 2 60 801.35-j100.84 0.749-j59.872 5.554+j40.084 3 80 -912.39-j568.36 -50.168+j61.135 5.289+j40.432 4 100 -1348.8-j199.18 -26.909+j96.174 5.156+j40.630 average values 5.544+j39.998 Table 6. The measurement resul ts of Yanl uo II line cases Current input (A) Zero sequence voltage (V) Zero sequence current (A) Zero sequence impedance (Ω) 1 40 -298.62+j463.74 31.278+j27.311 5.785+j39.428 2 60 -33.479+j806.83 58.947+j10.635 5.525+j40.065 3 80 -1063.2+j152.39 0.942+j79.041 5.302+j40.417 4 100 -887.65+j1034.2 67.073+j 74.004 5.112+j40.617 500 550 600 650 700 750 -150 -100 -50 0 50 100 150 200 Curr ent ( A ) time (ms) time (ms) 500 550 600 650 700 750 -2000 -1500 -1000 -500 0 500 1000 1500 2000 Volt a ge ( V ) time (ms) 500 550 600 650 700 750 -1000 -500 0 500 1000 Volt a ge ( V ) 500 550 600 650 700 750 -80 -60 -40 -20 0 20 40 60 80 time (ms) Current ( A )  Z. XU ET AL. Copyright © 2013 SciRes. ENG 150 average values 5.431+j40.132 The model of two lines with mutual inductance is sho wn in F i gure 9. U 10 I 10 Z 11 Z 22 Z 12 I 20 Line 1 Line 2 Figure 9. The model of two lines with mutual in ductance The voltammetry characteristic can be written as fol- lows, 10101020120 UIZ IZ=+ (7) So when we measure the zero sequence self imped- ance of the line I, the zero sequence current of line II which influences the zero sequence voltage of line I should be taken into account. The traditional method ignores the influence of line II, so there are theoretical mistakes in (9) . 101010 U IZ= (8) Then, 10 10 10 U ZI = (9) From (7), we can get, 10101220 10 10 10 UUZI ZII − = ≠ (10) In fact, it indicates that when the current of line I reaches 100 A and the current of line II reaches 47 A, 12 20 ZI can’t be ignored. So the error of zero sequence self impedance measured by traditional method is great. In this measurement, the error has reached above 30%. Measure the zero sequence voltages and zero sequence currents of all transmission lines, then calculate (1) and obtain zero sequence self impedance and zero sequence mutual impedance. The live line measurement method not only has high precision, but also is accurate and reli- able. The measurement results of zero sequence parame- ters are shown in table III, it shows that the average measurement error of zero sequence mutual impedance is about 5.5% and zero sequence self impedance is about 2%. It shows that there are still certain difference between theoretical values and measurement values. It is well known that the computation formulate for zero sequence parameters are derived from Carson formula. The tradi- tional method needs the resistance of earth, the equiva- lent depth of wires, the length of lines and the arrange- ment of wires. But it is difficult to get the resistance of earth and the equivalent depth of wires. So the theoreti- cal values are only used as reference, they cannot be used as accurate parameters. In the case of disturbing, in order to obtain the accu- rate parameters of zero sequence self impedance, the zero sequence self impedance and the zero sequence mutual impedance should be measured at the same time. 7. Conclusion The field l ive l ine mea suri ng r esult s ha ve pr ove n tha t th e live line measurement method is correct and the mea- surement system can meet the requirement of measure- ment. In addition, in order to eliminate the interference of lines, using the live line measurement method to cal- culate the zero sequence self impedance parameters and the zero sequence mutual impedance parameters simul- taneously can improve the accuracy of the measurement results. 8. Acknowledgemen ts This work was financially supported by the Ph.D. Pro- grams Foundation of Ministry of Education of China (20110141110032). REFERENCES [1] Z. Fu, “Power System Electrical Equipment Selection and Utility Computing”, Chin a Electric Power Press, Beijing, 2005. [2] J. Li and K. Zhu, “High Voltage Electrical Equipment Test Methods”, China Electric Power Press, Beijing, 2005. [3] Z. Hu, M. Liu, C. Zhang, et al, “Princip les and real izati on of live line measurement to parameters of transmission lines with mutual inductance”, Automation of Electrical Power Systems, Vol. 23, No. 24, 1999, pp. 32-35. [4] Z. Hu, Y. Chen, W. Xu, et al, “Principl es and realizatio n of live line measurement of parameters of transmission lines with mutual inductance based on differential equa- tions”, Proceedings of the CSEE, Vol. 25, No. 2, 2005, pp. 28-33. [5] Z. Hu, Y. Chen, “New method of live lin e measuring th e inductance parameters of transmission lines based on GPS technology”, IEEE Transactions on Power Delivery, Vol. 23, No. 3, 2008, pp. 1288-1295. [6] N. Hu, Z. Hu, G. Zheng, “Live line parameter measure- ment of transmission lines with mutual inductance based  Z. XU ET AL. Copyright © 2013 SciRes. ENG 151 on GPS technology and integral equations”, Power Sys- tem Technology, Vol. 29, No. 8, 2005, pp.76-80. [7] P. Mao, C. Zhang, Y. Wang, “A Capaci tive current com- pensation algorithm on zero-sequence parameters live line measurement of transmission lines”, Automation of Electrical Power Systems, Vol. 34, No. 17, 2010, pp. 55-58, 82. [8] S. Li, X. Chen, G. Qi, et al, “Discussion on live line measurement of the parameters of the transmission lines with four- circu it on a tower”, High Voltage Engineering, Vol. 32, No. 7, 2006, pp. 17-20. [9] Z. Hu , Y. Chen, C. Zhang, “A new meth od o f parameters live line measurement of transmission lines based on GPS technology”, Power System Technology, Vol.23, No.9, 1999, pp. 4-7, 18. [10] L. Fang, Z. Hu, “A new method for live line measure- ment of zero-sequence parameters of transmission line containing T-connection transmission line with mutual inductance and its engineering application”, Power Sys- tem Technology, Vol.34, No.4, 2010, pp.204-208. [11] Z. Liu, M. Lu, Z. Lü , et al, “Power frequency parameter measurement technology for UHV transmission lines and its application”, Power System Technology, Vol. 33, No. 10, 2009, pp. 59-62. [12] M. Lu, Y. Ning, F. Ma, et al, “Measuring and analysing of the power-frequency parameter for power transmission line”, High Voltage Apparatus, Vol.40, No.3, 2004, pp.218-220, 226. |