

Paper Menu >>
Journal Menu >>
 Engineering, 2013, 5, 121-126 doi:10.4236/eng.2013. 51b022 Published Online January 2013 (http://www.SciRP.org/journal/eng) Copyright © 2013 SciRes. ENG The Research about the Trans-provincial Centralized Bidding Trading Market of East China Power Grid --II: Model Analysis Bin Zou 1, Jie Fan1, Xiao-gang Li2, Li-bing Yan g2 1School o f Mechatronic En gineering and Automation, S hangha i Univer s ity, Shanghai, C hina 2East China Power Grid Co., Ltd. Shanghai, China Email: [email protected] Received 2013 Abstract In this paper a novel cost function based on the relationship between operation cost of unit and generation load rate is employed in an agent-based model of Trans-provincial Centralized Bidding Trading Market of East China Grid. Simulation results are compared to real data to prove that the model is correct. Further analysis on simulation results point out the wa y to achieve a n all-win game for power market member s : generation companies impro ve their average load rates of the units by selling their electricity in the market, which makes units' cost drop and settlement price stay lo wer tha n b e nc h mar k p r ice . Consequently electricity-dema nd pr o vinc es save d e xp ens es, and units increase their profits. In co ncl usion, the tra ns-pro vincial electricity market of East China Po wer Grid is a successive case which improves the efficiency of the electricity industry b y market-oriented measures. Keywords: Power Market; Agent-based Simulation; East China Grid; Trans-provincial Centralized Trade; Partial Electricity Compe tition 1. Introduction East China power grid is an interconnected power grid, which contains five provincial power grids, and each province power grid is a control zone. Each provincial power grid company is responsible for their respective provinces electricity and power balance. In order to meet the load demand, about 1% of the total energy needs to be exchanged among the provinces. The Trans-provincial Centralized Bidding Trading Market of East China Power Grid(TPM-ECPG)is designed to take advantages of competition to form energy exchange programs between provinces. About 9 9% of t he gener ating energy is arranged using so-called planned schedule method. In the method, each unit was allocated a certain amou nt of generating energy during the next year according to the installed capacity of the un it, t he uni t type and t he for ecast ing lo ad. T hen, t he po wer system operation sched ules the unit outp ut to meet the actual load and guarantees annual generating energy of the unit equal to the value to be assigned. And Electricity is purchased by the grid company with the benchmark price that is validated by the National Devel opme nt and Refo rm Co mmi s sio n. The TPM-ECPG that was put into operation in Dec. 2008, is the only one power auction. The result of last three-year operatio n indicates that market trading volume increased year after year, and to most degree electricity demand has been satisfied. The trans-provincial transaction platform has become the one of the main ways of the tra ns-provincial transaction in East China Power Grid. In this p a pe r agent-based model is proposed as the tool for the modeling and analysis of the trans-provincial centralized auction transactio n p latfor m of East C hina. In a lot of literatures, the agent-based model not only was employed to estimate market characteristic with different pricing method, namely uniform clearing pricing, mid-point pricing and pay-as-bid pricing[5-7], but also used to discuss the influence on the power market exerted by blocking, collusionbid and emission trading of CO2[11-18]. The method is able to show the basic features that market members bid as the behavior of maximizing their benefits, and its extensibility allows taking more practical market factors into consideration. The important feature of the TPM-ECPG is a part of the electricity competitio n, part of electricity is scheduled using traditional cost-based method, and  B.ZHOU ET AL. Copyright © 2013 SciRes. ENG 122 another is sa le by competition. What is the impact of the non-competitive part on the competitive market? In fact, the market shows some interesting phenomenon. For example, power generation companies are willing to participate in market competition, even if the market price is lower than the benchmark price. This paper is one of the two-part series. This article will use an agent-based simulation method to model the TPM-ECPG. By doing so, it can help to analyze simulated cases based on realistic data of East China trans-provincial centralized power transaction. 2. Introduction of the TPM-ECPG The TPM-ECPG functions as a double-auction market, basic rules are as follows: buyers and sellers initially report their respectively offered quantities of electricity (MWh) a nd bid prices (¥/ MWh). The approach of market clearing applies matchmaking tradeoff model. The highest bid of demand side would match the lowest ask price of supply side. Then the market clearing price is their average value of the two offered prices. The matchmaking procedure goes on by the price sequences of sellers and buyers. The transmission fee and loss compensation fee belongs to demand-side power grid, while the trans-provincial transmission fee and loss compensation fee belongs to the East China Power Grid. The loss compensation fee is 1% of benchmark price, and the transmission fee is the difference between demand price and supply price in principle. But if the sum of transmission fee and loss compensation fee is more than 0.03¥/KWh, then the transmission fee is 0.03¥/KWh. More detailed market rules Re ferences [1]. 3. Agent-based simulation model Unlike the model of the conventional electricity market, the model of the East Chi na po wer mar ket must take into the planned generation. The proposed model in this paper employs the characteristics as followed: 1) Market members in the TPM-ECPG always bid for profit maximization; 2). Generated electricity and price of planned generation is described through a cost function, which can embody the influence exerted on the power auction market. 3). Transaction rules are set up in accordance with practical regulations of the TPM-ECPG. To sum up, the model possesses the most market characteristic s of TPM-ECPG, and is expected to explore the inner mar ket mechanism b y simu lation. 3.1 Cost fun c tion mod e l The generator's cost model presented is divided into two parts of the operating cost and capacity cost. Capacity cost is a constant during the modeling and simulation. The main operation cost is fuel cost, in order to represent the impact of the planned generation, the power generation load rate is employed to calculate the operation cost of the generating u nit in this paper. For any one of the power supplier i , its planned generating quantit y of electric it y is divided into t wo parts: electricity on peak periods and electricity on valley periods, the accepted quantity of electricity is classified into peak and valley part as well. =+ i ip iv ipipp ips ivivp ivs QQ Q QQQ QQQ = + = + (1) Where i Q denotes total generating electricity of Unit i ; ip Q , iv Q denote generating electricity of Unit i on peak period and valley period respectively; ipp Q , ivp Q denote planned generation of Unit i on peak period and valley period respectively; ips Q ,ivs Qdenote accepted bid of Unit i on peak period and valley period respectively. In this paper one month is set up as observation period. The average load rates of Unit i on peak/valley period are as followed: , ,ma x , ,ma x 30 14 30 10 ip i lp i iv i lv i Q rP Q rP = ×× = ×× (2) Where ,i lp r , ,i lv r denote average load rate of Unit i on peak/valley period. ,maxi P is unit’s maximum output. 30×10, 30×14 represent valley-period of 10 hours per da y, peak-period of 14 hours per day. Each month has 30 days on an average. The avera ge output of U nit i on peak/valley perio d is as followed: , ,ma x , ,ma x 30 14 30 10 ip i lp i iv i lv i Q rP Q rP = ×× = ×× (3) Where , ip iv PP denote average output of Unit i on peak/valley pe r iod Coal consumption of Unit i can be calculated by coal consumption curve in Figure.1, which is expressed as quadratic function: 2 = iiiii i raPb Pc×+×+ (4) where ,, iii abc are coefficients for different types of generator units, i P is unit’s output. Reference [19] shows that the way to estimate coal consumption can be accepted. The running cost of power generation companies expressed as the product of the coal consumption,  B.ZHOU ET AL. Copyright © 2013 SciRes. ENG 123 electricity gener ation and coal p r ices , , = = ipi pcip ivi vciv CrQ p CrQ p ×× ×× c c (5) Where ip C , iv C denote operation cost of unit i on period/valley period. C p denotes coal price, ,i pc r , ,i vc r can be obtain from (4). 3.2 Decision - making model The decision-making model of the power supply company is just maximizing profit based on its objective function, and decision variable is the ask price , bid i sell ρ , ( ) , , ,,,,, ,, max+-+ + bid i sell isellibmi planibmi plani peakivalleyicap RpQpQC CC ρ =×× (6) where the planned quantity of generating electricity is scheduled by provincial regulators and its price is benchmark price of the respective provinces. Owning to the proposed model, which is based on load rates, the impacts of generating plans can be involved in decision making smoothly. In terms of electricity-demand provinces, they purchase insufficient power through the trans-provincial auction after implementing generating plans, so insufficient power can also be regarded as a known constant in the model. The power-demand provinces expect to bid to satisfy their demand. Similarly, the decision-making model o f such provinces is maximizi ng profit of their obj ective function, and dec ision variable is the bid pric e , bid i buy ρ : , , ,, , max - bid i buy i buyisi buyi buy ir Rp QpQ ρ =×× (7) Where, ,i buy R , ,ir p , ,i buy p and ,i buy Q denote profit, retail price, closing bid price, accepted quantity of bid of electricit y-demand province i respectively. 3.3 Agent-based simulation Both the power supply company's decision-making model (6) and power-demand province's decision-making model (7) cannot be directly solved by optimization methods, for they are all game procedures. The agent-based simulation is appropriate to deal with the game problems. According to historical data, planned peak/valley period generating electricity, quoted quantity, quoted price, probable quotation set and other arguments can be set up before simulation, reference [7] introduced this method in detail. Simple agent-based simulation procedure is as followed: Step 1: In according to the roulette-like method, which acquires selective prob a b ility, quotations can be pick up for both units and buyers. Step 2: After executing market-clearing, profits of units and buyers can be calculated by ( 6) and (7). Step 3: Units and buyers amend their selective probability of quotation sets based on profit changes. The target is to increase the probabilities of one quotation whic h make s hi ghe r pr o fit. Step 4: Iteration pluses one. If any quotation in the two sets does not converge, go to Step 1. The selective probability learning process, i.e., step 3, using the Roth-Ere algorithm [7][8][9], detailed discussion of the algorithm exceeds the scope of this article, please refer to the literature [7][8][9]. 4. Case Study 4.1 Data setting In order to keep accordance with actual operating data of the trans-provincial centralized bidding transaction Table.1 Data of generators’ units NO. Installed Capacity MW Province Offered Quantity ¥/MWh Planned Generation MWh 1 300 A 6480 179280 2 600 A 12960 358560 3 1000 A 21600 597600 4 600 A 12960 358560 5 300 A 6480 179280 6 1000 A 21600 597600 7 1000 B 21600 597600 8 300 B 6480 179280 9 600 B 12960 358560 10 600 B 12960 358560 11 1000 B 21600 597600 12 300 B 6480 179280 13 600 B 12960 358560 Figure.1 coal consumpt ion curves of 3 ty pes of units  B.ZHOU ET AL. Copyright © 2013 SciRes. ENG 124 platform of East China, the experimental environment for power supply companies and their units in this paper are set up and present in Tab.1. These power companies with the sole unit are a ffiliate d to two di fferent pro vince s of A and B, the electricity-demand provinces are C and D. It is assumed that the coal price of province A is 720 Yuan/ton, and the coal price of B is 750 Yuan/ton. 4.2 Analysis on market equilibrium Based on the data setting, market equilibrium res ults can be obtained by agent-based simulation. Table.2 shows the market clearing results of electricity-demand provinces and units. The average bid prices of C and D in Tab.3 is close to the actual bid of demand provinces in 2010 transactions(422.26¥/MWh vs 421.00¥/MWh), relative error is about 0.3%. In addition the average units’ ask prices(335.82¥/MW h) also approximate to those in 2010(335.82¥/MWh), which leads to a relative error of 4.6%. Table.2 Simulat ion results on the o ffer and bid Market players Quotation ¥/MWh Winning Bid ¥/MWh Accepted Quantity MWh Province C 416 400 79000 Province D 426 389 79000 300MW Unit 368 367 3400 600MW Unit 330 359 12960 1000MW Unit 326 358 21600 Furthe r ana lysi s on the res ults of Table.2 show that the average winning bid prices of units and electricit y-demand provinces compare to their actual transaction data respectively, relative errors are 1.6% and 1.8%(absolute errors are 6.23 ¥/MWh and 6.51 ¥/MWh). All the results and analysis figure out that market equilibriu m of the model in this paper is close to real market operation, and the model can embody most of trans-provincial elec tr ic auction market. According to Table.2, average ask-prices of 300 MW units, 600MW units and 1000MW units are sorted in descending order, which is as same as their operation cost sorted order. It is indicated that generation companies who owe auction units always bid on the basis of units’ cost. The market characteristic makes low-cost units take a dvantages in market auction. The simulated winning bid prices of province C and D(416.00¥/MWh and 426.00¥/MWh) are lower than their benchmark prices(430.00 ¥/MWh and 457.00 ¥/MWh) respectively, that saves expenses for both demand-p rovince C and D. Simultaneou sly the average winning bid price of units in province A and B (359.27 ¥/MWh and 359.42 ¥/MWh) are also lower than their benchmark prices (410.00¥/MWh and 400.00¥/MWh) respectively. To find out why generation companies are willing to bid at a low price, average profit per unit (total profit divide total ge neratio n) a nd average load rate are put into consideration as shown in Table.3. As it presents in Table.3, load rate increases after generation companies participate in auctio n market. T hat makes running cost go down. Moreover, when total generation increases by 3%, the settlement price of incremental part decreases nearly by 10% comparing to benchmark price. Whereas the cost drops, total profit grow by 9% and unit profit also goes up. Table.3 the profi ts a nd load rate of the power s uppliers part icipating or not in i nter-provinvial t r ans ac tio n Total generation MWh Total profit ¥ Profit per unit ¥/M Wh Load rate P V Without auction transaction 4900320 2209618 65 45.09 75% 89% Wit h bid transactions 5058320 2414121 93 47.72 77% 91% In order to further study the characteristics of the TPM-ECPG, in this paper 11 trading scenarios on different market scales, of which total installed is fixed, are set up. Owing to a small wiggle room for buyers’ quoted prices, units’ average winning bid price can mostly indicate market trading status(As shown in Figure.2, where the horizontal axis represents the percentage of maximum offer of electricity in market biding to total installed capacity, namely market scale). As can be seen from the simulation results of Figure.2, When the TPM-ECPG maintain in a small transaction volume, namely the competitive part of electricit y accounted for less than 25%, units average clearing price overall keeps a downward trend. It is pointed that the market within a c e r ta in small siz e has the ability to reduce the generation costs continually, to promote genera tion compa nies to participate in bid ding, and possess es the conditions to expand transaction scale. When the transaction scale goes up, average clearing electricity price rebounded, and presents a substantia l rebound trend constantly. As the market expands to the 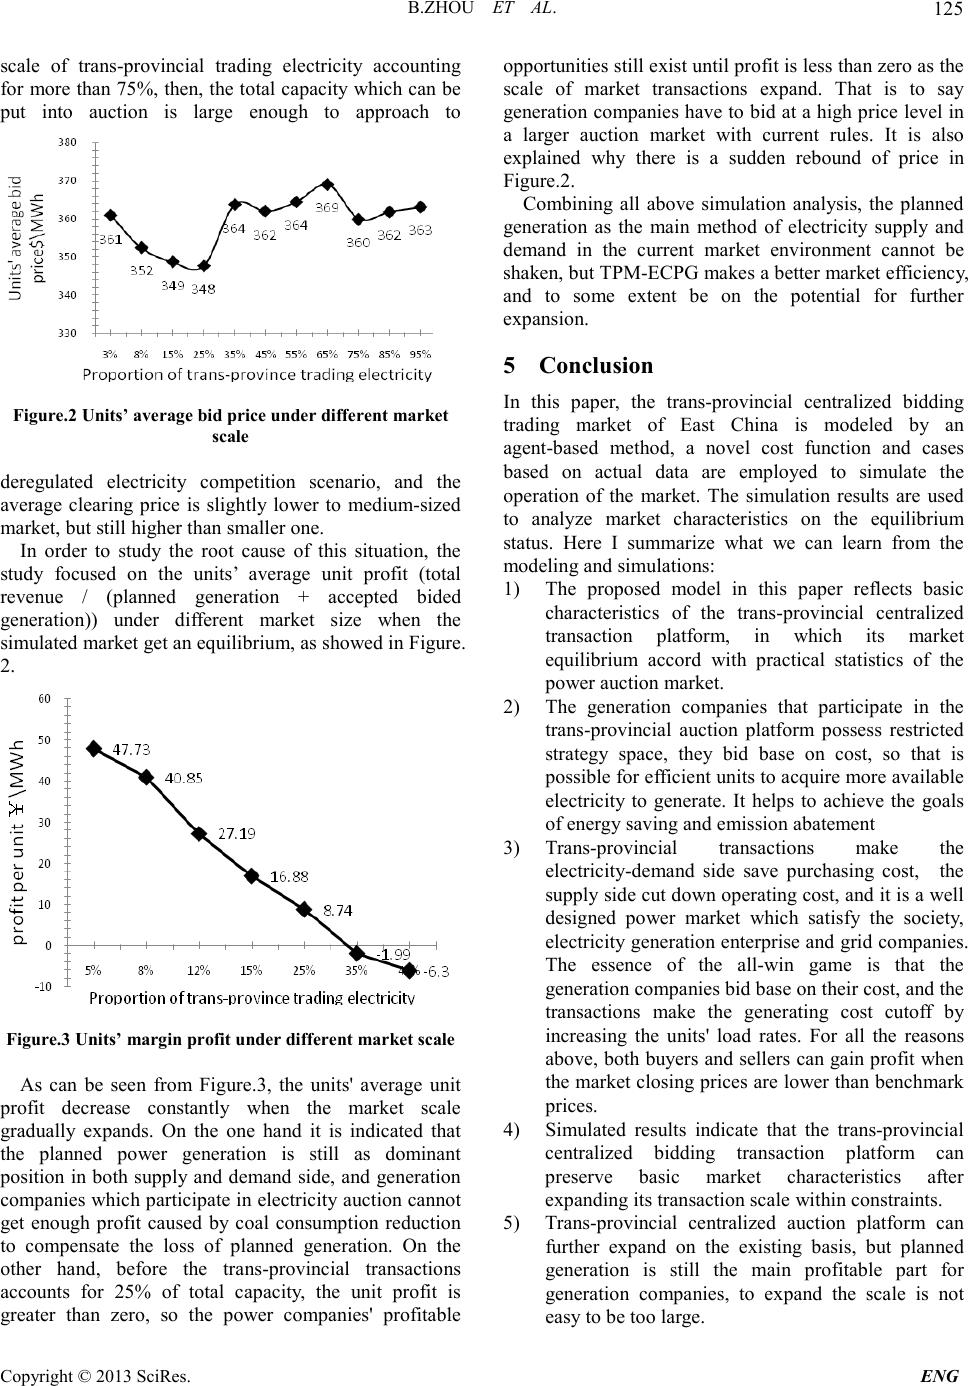 B.ZHOU ET AL. Copyright © 2013 SciRes. ENG 125 scale of trans-provincial trading electricity accounting for more than 75%, then, the total capacity which can be put into auction is large enough to approach to Figure.2 Units’ average bid pri ce under different market scale deregulated electricity competition scenario, and the average clearing price is slightly lower to medium-sized market, but still higher than smaller one. In order to study the root cause of this situation, the study focused on the units’ average unit profit (total revenue / (planned generation + accepted bided generation)) under different market size when the simulated market get an equilibrium, as showed in Figure. 2. Figure.3 Units’ marg in pr of i t under different market scale As can be seen from Figure.3, the units' average unit profit decrease constantly when the market scale gradually expands. On the one hand it is indicated that the planned power generation is still as dominant position in both supply and demand side, and generation companies which participate in electricity auction cannot get enough profit caused by coal consumption reduction to compensate the loss of planned generation. On the other hand, before the trans-provincial transactions accounts for 25% of total capacity, the unit profit is greater than zero, so the power companies' profitable opportunitie s still e xist u ntil p ro fit is less tha n zero as the scale of market transactions expand. That is to say generation companies have to bid at a high price level in a larger auction market with current rules. It is also explained why there is a sudden rebound of price in Figure.2. Combining all above simulation analysis, the planned generation as the main method of electricity supply and demand in the current market environment cannot be shake n, b u t T PM-ECPG mak es a better market efficiency, and to some extent be on the potential for further expansion. 5 Conclusion In this paper, the trans-provincial centralized bidd ing trading market of East China is modeled by an agent-based method, a novel cost function and cases based on actual data are employed to simulate the operation of the market. The simulation results are used to analyze market characteristics on the equilibrium status. Here I summarize what we can learn from the modeling and simulations: 1) The proposed model in this paper reflects basic characteristics of the trans-provincial centralized transaction platform, in which its market equilibrium accord with practical statistics of the power auction market. 2) The generation companies that participate in the trans-provincial auction platform possess restricted strategy space, they bid base on cost, so that is possible for e fficient units to a cquire more available electricity to generate. It helps to achieve the goals of energy saving and emission abatement 3) Trans-pr ovincial tra nsactions make the electricit y-demand side save purchasing cost, the supply side cut down operating cost, and it is a well designed power market which satisfy the society, electricity generation enterprise and grid co mpa nies. The essence of the all-win game is that the generation companies bid base on their cost, and the transactions make the generating cost cutoff by increasing the units' load rates. For all the reasons above, both buyers and sellers can gain profit when the market closing prices are lower than benchmark prices. 4) Simulated results indicate that the trans-provincial centralized bidding transaction platform can preserve basic market characteristics after expanding its tr a nsaction sca le within constraints. 5) Trans-provincial centralized auction platform ca n further expand on the existing basis, but planned generation is still the main profitable part for generation companies, to expand the scale is not easy to be too large. 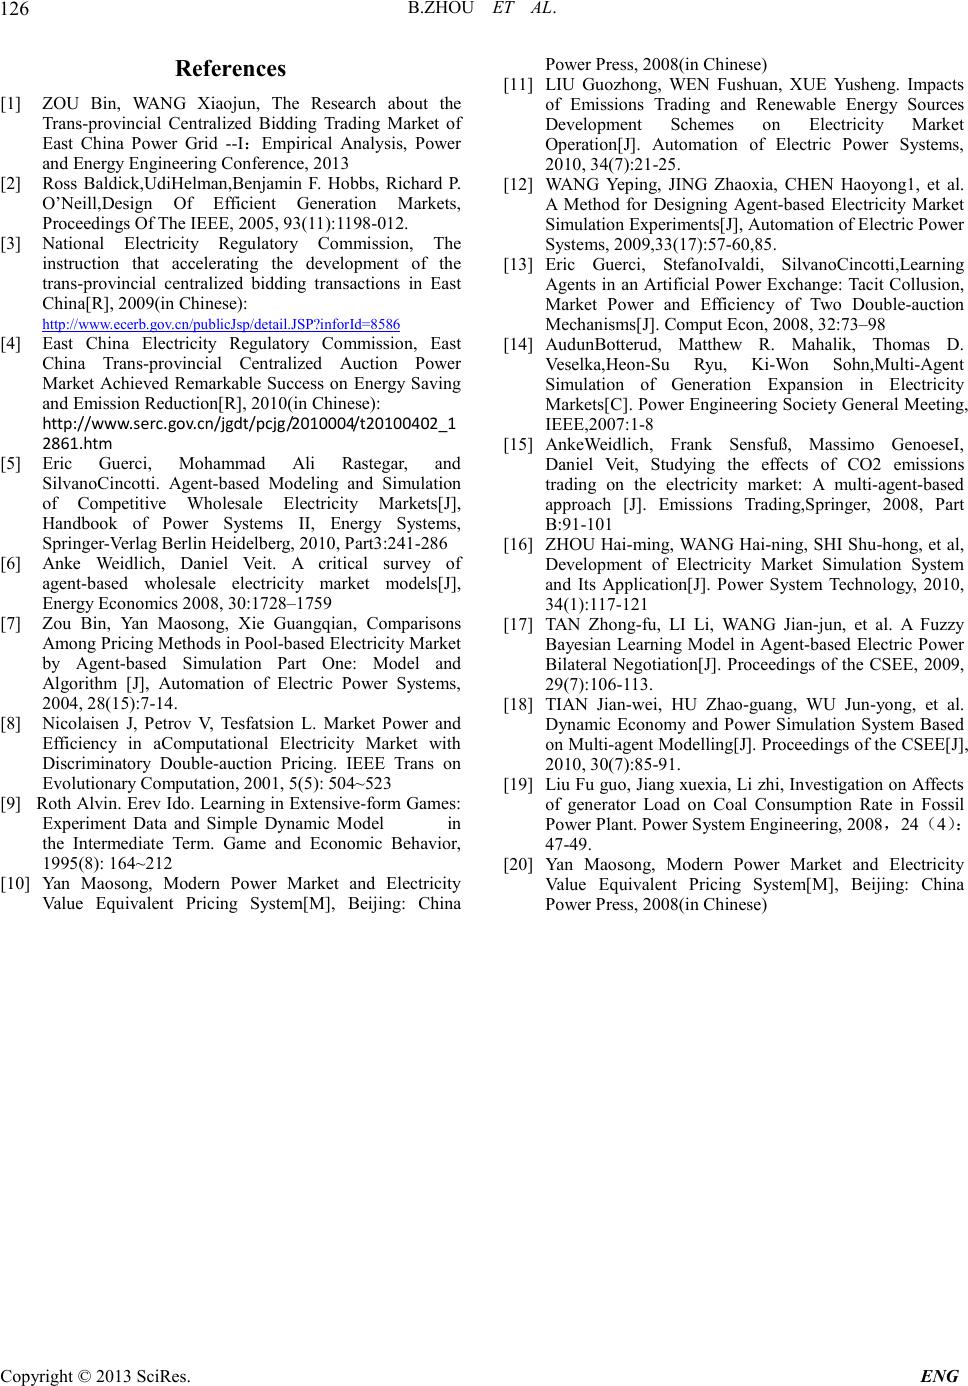 B.ZHOU ET AL. Copyright © 2013 SciRes. ENG 126 Referen ces [1] ZOU Bin, WANG Xiaojun, The Research about the Trans-provincial Centralized Bidding Trading Market of East China Power Grid --I:Empirical Analysis, Power and Energy Engineering Conference, 2013 [2] Ross Baldick,UdiHelman,Benjamin F. Hobbs, Richard P. O’Neill,Design Of Efficient Generation Markets, Proceedings Of The IEEE , 2005, 93(11):1198-012. [3] National Electricity Regulatory Commission, The instruction that accelerating the development of the trans-provincial centralized bidding transactions in East China[R], 2009(in Chine s e ) : http://www.ecerb.gov.cn/publicJsp/detail.JSP?inforId=8586 [4] East China Electricity Regulatory Commission, East China Trans-provincial Centralized Auction Power Market Achieved Remarkable Success on Energy Saving and Emission Reduction[R], 20 10 ( i n Chi ne s e ) : http://www.serc.gov.cn/jgdt/pcjg/2010004/t20100402_1 2861.htm [5] Eric Guerci, Mohammad Ali Rastegar, and SilvanoCincotti. Agent-based Modeling and Simulation of Competitive Wholesale Electricity Markets[J], Handbook of Power Systems II, Energy Systems, Springer-Verlag Ber lin Heidelberg, 2010, Part3:241-286 [6] Anke Weidlich, Daniel Veit. A critical survey of agent-based wholesale electricity market models[J], Energy Economics 2008, 30:1728–1759 [7] Zou Bin, Yan Maosong, Xie Guangqian, Comparisons Among Pricing Methods in Pool-based El ectrici ty Mar ket by Agent-based Simulation Part One: Model and Algorithm [J], Automation of Electric Power Systems, 2004, 28 ( 15 ) :7-14. [8] Nicolaisen J, Petrov V, Tesfatsion L. Market Power and Efficiency in aComputational Electricity Market with Discriminatory Double-auction Pricing. IEEE Trans on Evolutionary Computation, 2001, 5(5): 504~523 [9] Ro th Alvin. Erev Ido . Learni ng in Ext ensive-for m Games: Experiment Data and Simple Dynamic Model in the Intermediate Term. Game and Economic Behavior, 1995(8): 164~212 [10] Yan Maosong, Modern Power Market and Electricity Value Equivalent Pricin g System[M], Beijing: China Power Press, 2008(in Chinese) [11] LIU Guozhong, WEN Fushuan, XUE Yusheng. Impacts of Emissions Trading and Renewable Energy Sources Development Schemes on Electricity Market Operati on[J]. Automation of Electric Power Systems, 2010, 34(7):21-25. [12] WANG Yeping, JING Zhaoxia, CHEN Haoyong1, et al. A Met hod for Designing Agent-based Electricity Market Simulation Experiments[J], Aut omat ion of Electric Power Systems, 2009,33(17):57-60,85. [13] Eric Guerci, StefanoIvaldi, SilvanoCincotti,Learning Agents in an Artificial Power Exchange: Tacit Collusion, Market Power and Efficiency of Two Double-auction Mechan isms[J]. Comput Econ, 2008, 32:73–98 [14] AudunBotterud, Matthew R. Mahalik, Thomas D. Veselka,Heon-Su Ryu, Ki-Won Sohn,Multi-Agent Simulation of Generation Expansion in Electricity Markets[C]. Power Engineering Society General Meeting, IEEE,2007:1-8 [15] AnkeWeidlich, Frank Sensfuß, Massimo GenoeseI, Daniel Veit, Studying the effects of CO2 emissions trading on the electricity market: A multi-agent-based approach [J]. Emissions Trading,Springer, 2008, Part B:91-101 [16] ZHOU Hai-ming, WANG Hai-ning, SHI Shu-hong, et al, Development of Electricity Market Simulation System and Its Application[J]. Power System Technology, 2010, 34(1):117-121 [17] TAN Zhong-fu, LI Li, WANG Jian-jun, et al. A Fuzzy Bayesian Learning Model in Agent-based Electric Po wer Bilateral Negotiation[J]. Proceedings of the CSEE, 2009, 29(7):106-11 3. [18] TIAN Jian-wei, HU Zhao-guang, WU Jun-yong, et al. Dynamic Economy and Power Simulation System Based on Multi-agent Modelling[J]. P roceedin gs of the CSEE[J], 2010, 30 ( 7):85-91. [19] Liu Fu guo, Jiang xuexia, Li zhi, Investigation on Affects of generator Load on Coal Consumption Rate in Fossil Power Plant. Power System Engineering, 2008,24(4): 47-49. [20] Yan Maosong, Modern Power Market and Electricity Value Equivalent Pricin g System[M], Beijing: China Power Press, 2008(in Chinese) |