

Paper Menu >>
Journal Menu >>
 Engineering, 2013, 5, 75-80 doi:10.4236/eng.2013.51b014 Published Online January 2013 (http://www.SciRP.org/journal/eng) Copyright © 2012 SciRes. ENG Construction of a small scale laboratory for solar collectors and solar cells in a developing country Gentile Niko1*, Davidsson Henrik1, Bernardo Ricardo1, Gomes Joao2, Gruffman Christian3, Chea Luis4, Mumba Chabu5, Karlsson Björn6 1 Energy and Building Design, Lund University, Lund, Sweden *Corresponding Author email: [email protected] 2 Solarus Sunpower Sweden AB, Stockholm, Sweden 3 Finsun AB, Älvkarleby, Sweden 4 Universidade Eduardo Mondlane, Maputo, Mozambique 5 University of Zambia, Lusaka, Zambia 6 Division of Energy Engineering, Mälardalen University, Västerås, Sweden Received 2013 Abstract In the field of renewable energy, self-provided research in developing countries is barely present, but most welcomed. The creation of know-how and self-development of technologies should reduce the dependence on industrialized coun- tries for both materials and knowledge. This work presents technological and social issues related to the construction of a low budget solar laboratory in Mozambique. The goal is to demonstrate that scientific level research can be carried out in developing countries by using affordable solutions without sacrificing quality of the results. For this investiga- tion, a solar laboratory was built in 2011 at Universidade Eduardo Mondlane of Maputo. The laboratory enables meas- urements to evaluate solar thermal and photovoltaic-thermal hybrid collectors. Thanks to the flexibility of the sys- tem, students and teaching staff can add/remove equipment and develop customised local research programs. In addi- tion, a course on the principles of solar energy and collector simulation for local students was taught. The needed data acquisition devices usually used in Europe were compared with cheaper and easy-maintenance ones. Calibration and estimation of the uncertainty were successfully performed. Approximately 9% of inaccuracy in the measurement was introduced by the cheaper equipment, but the investment cost was reduced by more than 90%. Other issues, results and future recommendations are shown. Keywords: solar thermal; solar hybrid; small-scale laboratory; scientific research; developing country; Mozambique. 1. Introduction The flow of foreign aid to developing countries during the year 2006 was 103.6 billion USD, while the global amount disbursed in the past 50 years is over 2.3 trillion USD [1]. The resulting benefits are often negligible, even if not detrimental, as revealed by different studies [2, 3]. Nevertheless foreign aid is still an essential condi- tion to stimulate investments and to reduce the gap be- tween industrialized and developing countries [4]. Moreover, the consequences of a drastic reduction in foreign aid can be dramatic for the population (e.g., about half of the Government budget in Mozambique is underpinned by foreign aid [5]). The discussion nowa- days is consequently oriented toward improvements in the efficacy of aid. Williamson argues that the possibility that both donors and recipients do not have adequate knowledge to achieve development goals must be ad- dressed [6]. In this view, long term collaboration be- tween Universidade Eduardo Mondlane (UEM) in Ma- puto (Mozambique), University of Zambia and Lund University (LU) permitted characterization of Mozambi- can primary needs in terms of technology, as well as the weaknesses of previous aid projects. By means of re- sources mostly provided by the Swedish International Development and cooperation Agency (SIDA), a low budget solar laboratory for scientific research was thus built. Several reasons oriented both donor and recipients to this new approach to foreign aid. Firstly, according to the 2012 appraisal, about 1.6 billion people worldwide have no access to electricity, of whom more than a third are living in the African continent [7].  N. GENTILE ET AL. Copyright © 2013 SciRes. ENG 76 Particularly in Sub-Saharan Africa less than a quarter of the population can use electricity [8]. In Mozambique the percentage is as low as 6% [9]). Lack of access to af- fordable electricity is a major determinant of poverty [10], confirmed by barely $500 of GDP/pp in Mozam- bique [11]. In view of the availability of solar radiation in the country [12], recent projects are largely based on the installation by donors of stand-alone photovoltaic systems in remote areas. The effectiveness of interven- tion is strongly related to both local expertise and the availability of material and spare parts, which are often disregarded [13]. Furthermore, the systems themselves are directly produced and imported from industrialized countries, which is the cause of the continued depend- ence status of the developing countries for further rural electrification projects. The absence of domestic production of photovoltaic and solar thermal systems can be related, not only to lack of economic resources but also to the lack of local scientific research. Issues for African Universities concerns the availability of funds and difficulties in receiving instru- ments from industrialized countries because of bureau- cracy, shipping costs and risks, and a very long waiting time. The proposed solution is to replace expensive in- struments with cheap, locally available and easy-maintenance ones; precision and accuracy should be only sacrificed inside a range of acceptability. By offering knowledge and a basic set of tools, this work is a contribution to the start-up for local scientific research. The installed equipment allows general training for en- gineers even outside the field of solar energy, e.g. data logger programming for developers or improvement of the solar tracking system for mechanical engineers. Na- tional testing agencies for instruments can arise and ex- ploit the laboratory as reference. As a direct conse- quence, an increase in local patents could occur, with general improvement of domestic production. In a virtu- ous circle, economic growth should allow higher invest- ment in research, which is an essential condition for the transition from basic to high level scientific research. Data-loggers, solar radiation, temperature and angle sensors are part of the laboratory equipment. The system was set up in the furtherance of easy customizations for increased local researches in the future. At the present time a prototype of concentrating Photovoltaic/Thermal (PV/T) hybrid collector is being tested [14]. UEM can perform reliable testing and get acquainted with the tools, while LU can afford tests in very different climatic conditions. In the first section of this paper the methodology fol- lowed in choosing instruments and solutions is explained in detail. The second section shows discussions and the results of a comparison of the sensors, including a calcu- lation example and related accuracy. The conclusions highlight the results achieved and underline improvable aspects for further similar projects. 2. Methods 2.1. Project schedule The preliminary schedule of work was drawn up in LU during the beginning of year 2010. The early design phase of the project concerned the definition of several key-words: “Involving”. Recipients must be completely involved in the job achievement. Courses to local students were given, an MSc student participated in the meas- urement phase and the presence of personnel from UEM was always requested during the building and testing process. A local member was also assigned as responsible for the facilities after the end of the pro- ject. “Customizable”. Recipients must be allowed to run their own researches, also in other fields. Easy adaptability of the lab to different acquisition devices is fundamental. Adaptable data logger and sensor were chosen. “Cheap”, “Simple” and “Efficient”. The choice of devices stressed the importance of affordable prices, easy understanding and installation, without exces- sively sacrificing the quality of measurements. “Low maintenance” and “Locally available”. Sensors and devices are not always available in Africa. Long life and easy obtainable replacements are the distin- guishing characteristics of a project with a long term perspective. “Low water usage”. Water is a precious, rare and expensive resource in Africa. Grid water supply is not always guaranteed. A closed water circuit with a 250 l boiler was studied for the solar thermal part. Rather than using fresh water from the grid, water can flow through the system during the night to cool down the storage. During the second part of year 2010, the project passed from the early design stage to a more detailed level. Dif- ferent sensors and devices were tested in Lund and the definitive adopted equipment was eventually chosen. The team from LU reached Maputo in January 2011 and worked for three months. The combination of both de- lays in material delivery and the low availability of spare parts in Mozambique, caused changes to the initial schedule. Though the solar laboratory was successfully built by the end of the visit, some planned works could not be carried out (e.g. tracking system). Sensors were installed to check ageing during the subsequent visit. During the 12 weeks basic courses on solar energy were given to UEM and University of Zambia students. They covered topics such as: solar radiation basics and solar conditions in Mozambique, basics on different collector 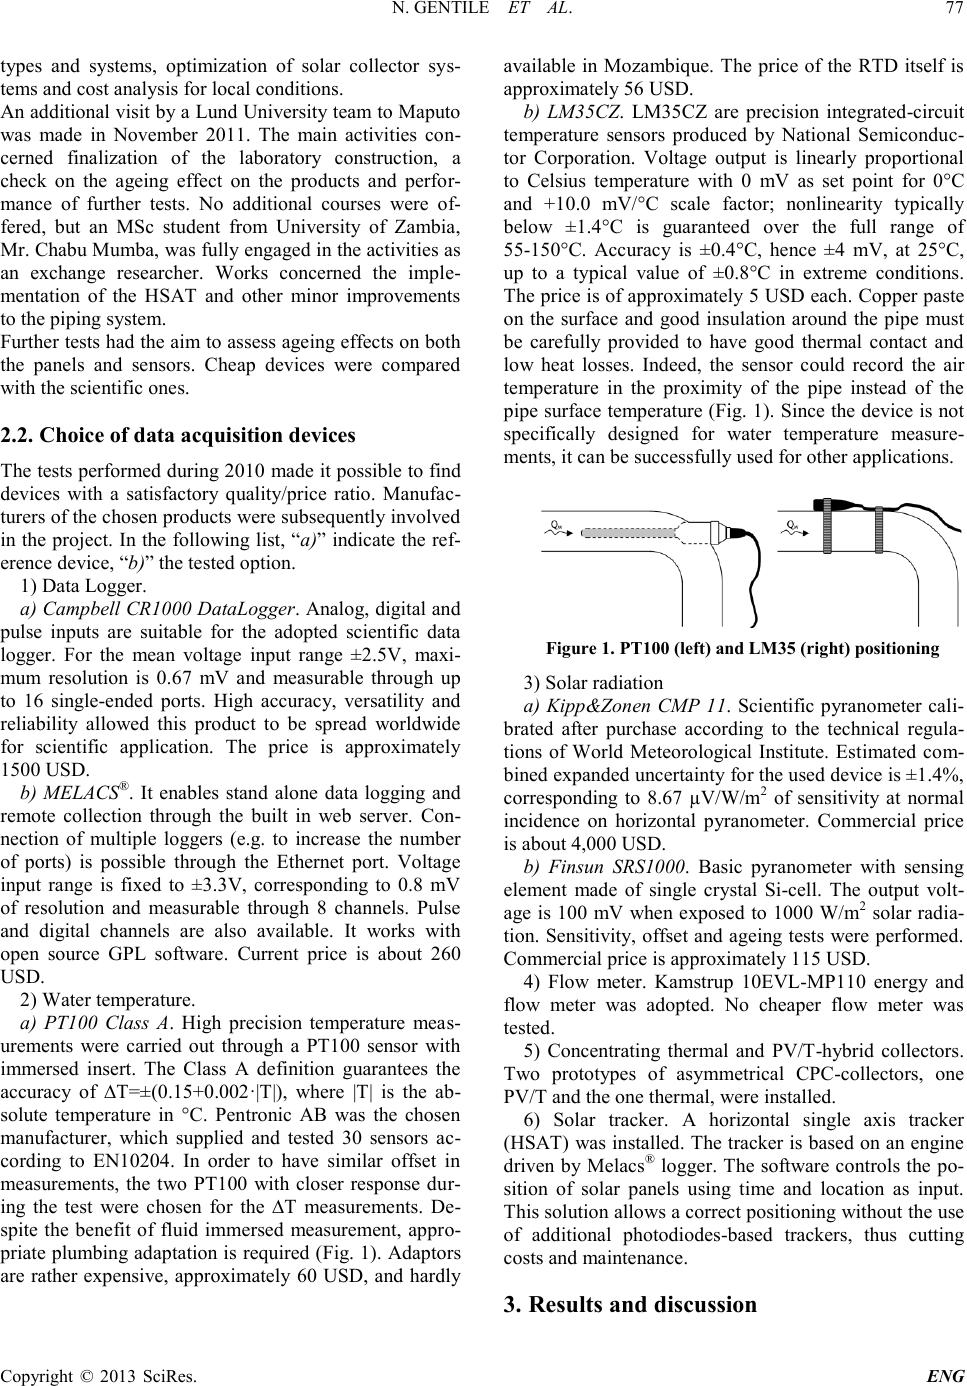 N. GENTILE ET AL. Copyright © 2013 SciRes. ENG 77 types and systems, optimization of solar collector sys- tems and cost analysis for local conditions. An additional visit by a Lund University team to Maputo was made in November 2011. The main activities con- cerned finalization of the laboratory construction, a check on the ageing effect on the products and perfor- mance of further tests. No additional courses were of- fered, but an MSc student from University of Zambia, Mr. Chabu Mumba, was fully engaged in the activities as an exchange researcher. Works concerned the imple- mentation of the HSAT and other minor improvements to the piping system. Further tests had the aim to assess ageing effects on both the panels and sensors. Cheap devices were compared with the scientific ones. 2.2. Choice of data acquisition devices The tests performed during 2010 made it possible to find devices with a satisfactory quality/price ratio. Manufac- turers of the chosen products were subsequently involved in the project. In the following list, “a)” indicate the ref- erence device, “b)” the tested option. 1) Data Logger. a) Campbell CR1000 DataLogger. Analog, digital and pulse inputs are suitable for the adopted scientific data logger. For the mean voltage input range ±2.5V, maxi- mum resolution is 0.67 mV and measurable through up to 16 single-ended ports. High accuracy, versatility and reliability allowed this product to be spread worldwide for scientific application. The price is approximately 1500 USD. b) MELACS®. It enables stand alone data logging and remote collection through the built in web server. Con- nection of multiple loggers (e.g. to increase the number of ports) is possible through the Ethernet port. Voltage input range is fixed to ±3.3V, corresponding to 0.8 mV of resolution and measurable through 8 channels. Pulse and digital channels are also available. It works with open source GPL software. Current price is about 260 USD. 2) Water temperature. a) PT100 Class A. High precision temperature meas- urements were carried out through a PT100 sensor with immersed insert. The Class A definition guarantees the accuracy of ∆T=±(0.15+0.002·|T|), where |T| is the ab- solute temperature in °C. Pentronic AB was the chosen manufacturer, which supplied and tested 30 sensors ac- cording to EN10204. In order to have similar offset in measurements, the two PT100 with closer response dur- ing the test were chosen for the ∆T measurements. De- spite the benefit of fluid immersed measurement, appro- priate plumbing adaptation is required (Fig. 1). Adaptors are rather expensive, approximately 60 USD, and hardly available in Mozambique. The price of the RTD itself is approximately 56 USD. b) LM35CZ. LM35CZ are precision integrated-circuit temperature sensors produced by National Semiconduc- tor Corporation. Voltage output is linearly proportional to Celsius temperature with 0 mV as set point for 0°C and +10.0 mV/°C scale factor; nonlinearity typically below ±1.4°C is guaranteed over the full range of 55-150°C. Accuracy is ±0.4°C, hence ±4 mV, at 25°C, up to a typical value of ±0.8°C in extreme conditions. The price is of approximately 5 USD each. Copper paste on the surface and good insulation around the pipe must be carefully provided to have good thermal contact and low heat losses. Indeed, the sensor could record the air temperature in the proximity of the pipe instead of the pipe surface temperature (Fig. 1). Since the device is not specifically designed for water temperature measure- ments, it can be successfully used for other applications. Figure 1. PT100 (left) and LM35 (right) positioning 3) Solar radiation a) Kipp&Zonen CMP 11. Scientific pyranometer cali- brated after purchase according to the technical regula- tions of World Meteorological Institute. Estimated com- bined expanded uncertainty for the used device is ±1.4%, corresponding to 8.67 µV/W/m2 of sensitivity at normal incidence on horizontal pyranometer. Commercial price is about 4,000 USD. b) Finsun SRS1000. Basic pyranometer with sensing element made of single crystal Si-cell. The output volt- age is 100 mV when exposed to 1000 W/m2 solar radia- tion. Sensitivity, offset and ageing tests were performed. Commercial price is approximately 115 USD. 4) Flow meter. Kamstrup 10EVL-MP110 energy and flow meter was adopted. No cheaper flow meter was tested. 5) Concentrating thermal and PV/T-hybrid collectors. Two prototypes of asymmetrical CPC-collectors, one PV/T and the one thermal, were installed. 6) Solar tracker. A horizontal single axis tracker (HSAT) was installed. The tracker is based on an engine driven by Melacs® logger. The software controls the po- sition of solar panels using time and location as input. This solution allows a correct positioning without the use of additional photodiodes-based trackers, thus cutting costs and maintenance. 3. Results and discussion 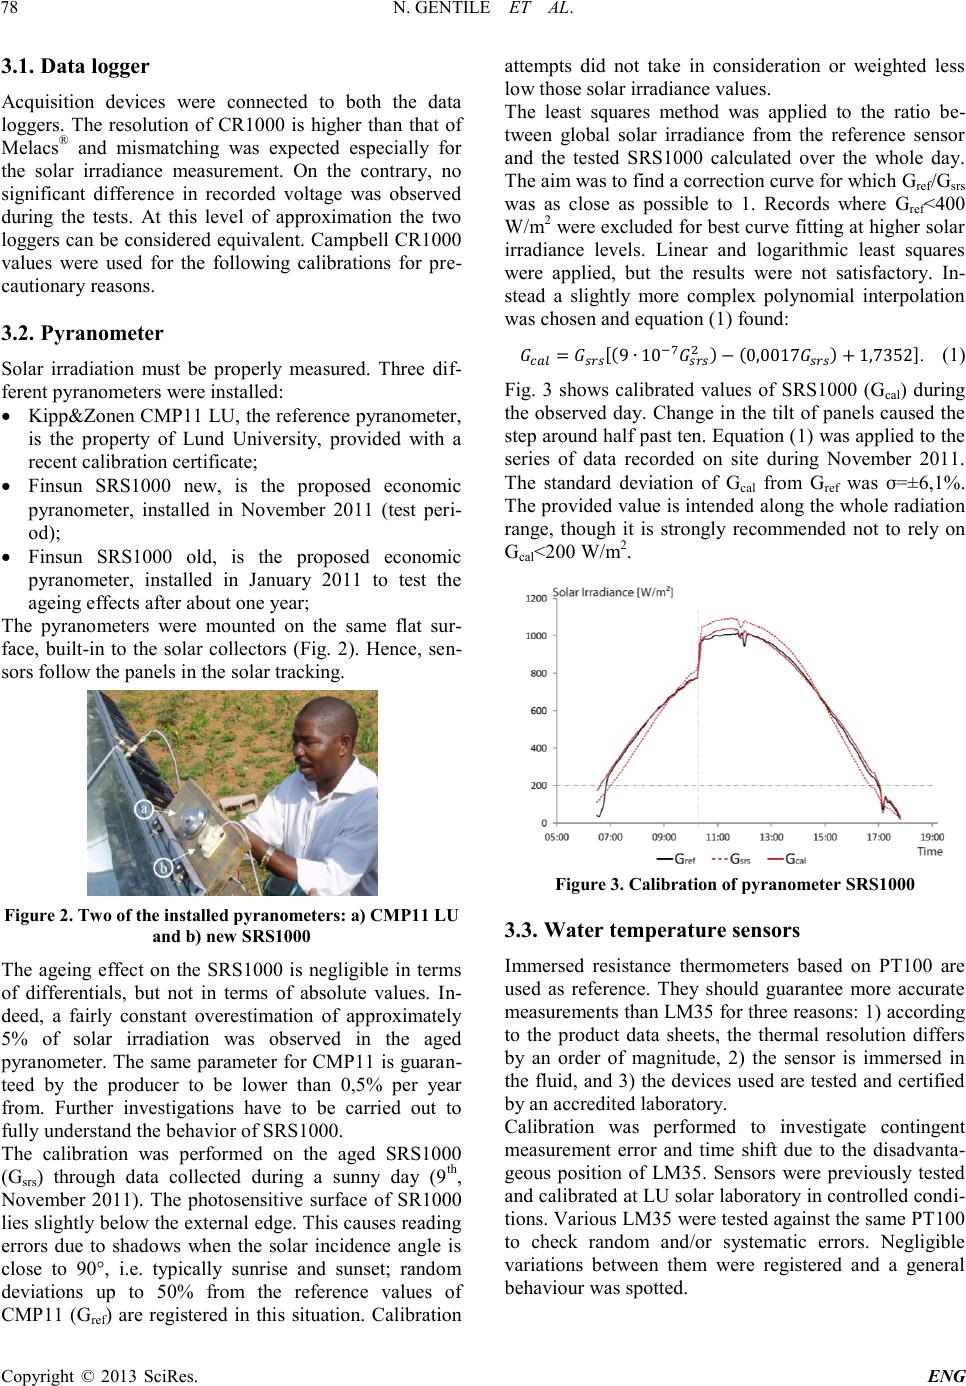 N. GENTILE ET AL. Copyright © 2013 SciRes. ENG 78 3.1. Data logger Acquisition devices were connected to both the data loggers. The resolution of CR1000 is higher than that of Melacs® and mismatching was expected especially for the solar irradiance measurement. On the contrary, no significant difference in recorded voltage was observed during the tests. At this level of approximation the two loggers can be considered equivalent. Campbell CR1000 values were used for the following calibrations for pre- cautionary reasons. 3.2. Pyranometer Solar irradiation must be properly measured. Three dif- ferent pyranometers were installed: Kipp&Zonen CMP11 LU, the reference pyranometer, is the property of Lund University, provided with a recent calibration certificate; Finsun SRS1000 new, is the proposed economic pyranometer, installed in November 2011 (test peri- od); Finsun SRS1000 old, is the proposed economic pyranometer, installed in January 2011 to test the ageing effects after about one year; The pyranometers were mounted on the same flat sur- face, built-in to the solar collectors (Fig. 2). Hence, sen- sors follow the panels in the solar tracking. Figure 2. Two of the installed pyranometers: a) CMP11 LU and b) new SRS1000 The ageing effect on the SRS1000 is negligible in terms of differentials, but not in terms of absolute values. In- deed, a fairly constant overestimation of approximately 5% of solar irradiation was observed in the aged pyranometer. The same parameter for CMP11 is guaran- teed by the producer to be lower than 0,5% per year from. Further investigations have to be carried out to fully understand the behavior of SRS1000. The calibration was performed on the aged SRS1000 (Gsrs) through data collected during a sunny day (9th, November 2011). The photosensitive surface of SR1000 lies slightly below the external edge. This causes reading errors due to shadows when the solar incidence angle is close to 90°, i.e. typically sunrise and sunset; random deviations up to 50% from the reference values of CMP11 (Gref) are registered in this situation. Calibration attempts did not take in consideration or weighted less low those solar irradiance values. The least squares method was applied to the ratio be- tween global solar irradiance from the reference sensor and the tested SRS1000 calculated over the whole day. The aim was to find a correction curve for which Gref/Gsrs was as close as possible to 1. Records where Gref<400 W/m2 were excluded for best curve fitting at higher solar irradiance levels. Linear and logarithmic least squares were applied, but the results were not satisfactory. In- stead a slightly more complex polynomial interpolation was chosen and equation (1) found: . (1) Fig. 3 shows calibrated values of SRS1000 (Gcal) during the observed day. Change in the tilt of panels caused the step around half past ten. Equation (1) was applied to the series of data recorded on site during November 2011. The standard deviation of Gcal from Gref was σ=±6,1%. The provided value is intended along the whole radiation range, though it is strongly recommended not to rely on Gcal<200 W/m2. Figure 3. Calibration of pyranometer SRS1000 3.3. Water temperature sensors Immersed resistance thermometers based on PT100 are used as reference. They should guarantee more accurate measurements than LM35 for three reasons: 1) according to the product data sheets, the thermal resolution differs by an order of magnitude, 2) the sensor is immersed in the fluid, and 3) the devices used are tested and certified by an accredited laboratory. Calibration was performed to investigate contingent measurement error and time shift due to the disadvanta- geous position of LM35. Sensors were previously tested and calibrated at LU solar laboratory in controlled condi- tions. Various LM35 were tested against the same PT100 to check random and/or systematic errors. Negligible variations between them were registered and a general behaviour was spotted. 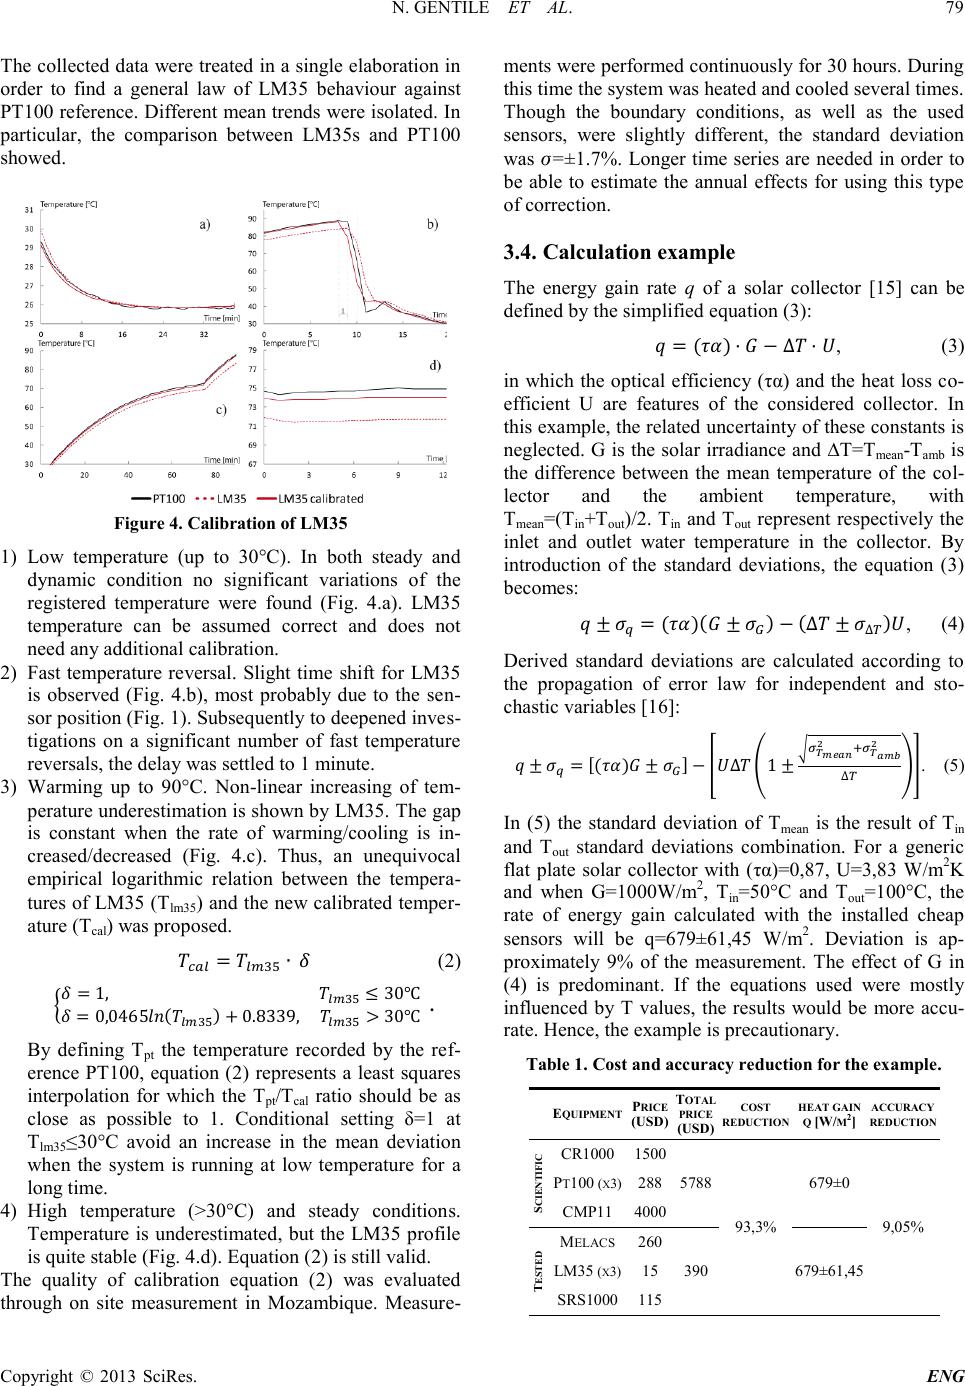 N. GENTILE ET AL. Copyright © 2013 SciRes. ENG 79 The collected data were treated in a single elaboration in order to find a general law of LM35 behaviour against PT100 reference. Different mean trends were isolated. In particular, the comparison between LM35s and PT100 showed. Figure 4. Calibration of LM35 1) Low temperature (up to 30°C). In both steady and dynamic condition no significant variations of the registered temperature were found (Fig. 4.a). LM35 temperature can be assumed correct and does not need any additional calibration. 2) Fast temperature reversal. Slight time shift for LM35 is observed (Fig. 4.b), most probably due to the sen- sor position (Fig. 1). Subsequently to deepened inves- tigations on a significant number of fast temperature reversals, the delay was settled to 1 minute. 3) Warming up to 90°C. Non-linear increasing of tem- perature underestimation is shown by LM35. The gap is constant when the rate of warming/cooling is in- creased/decreased (Fig. 4.c). Thus, an unequivocal empirical logarithmic relation between the tempera- tures of LM35 (Tlm35) and the new calibrated temper- ature (Tcal) was proposed. (2) . By defining Tpt the temperature recorded by the ref- erence PT100, equation (2) represents a least squares interpolation for which the Tpt/Tcal ratio should be as close as possible to 1. Conditional setting δ=1 at Tlm35≤30°C avoid an increase in the mean deviation when the system is running at low temperature for a long time. 4) High temperature (>30°C) and steady conditions. Temperature is underestimated, but the LM35 profile is quite stable (Fig. 4.d). Equation (2) is still valid. The quality of calibration equation (2) was evaluated through on site measurement in Mozambique. Measure- ments were performed continuously for 30 hours. During this time the system was heated and cooled several times. Though the boundary conditions, as well as the used sensors, were slightly different, the standard deviation was σ=±1.7%. Longer time series are needed in order to be able to estimate the annual effects for using this type of correction. 3.4. Calculation example The energy gain rate q of a solar collector [15] can be defined by the simplified equation (3): , (3) in which the optical efficiency (τα) and the heat loss co- efficient U are features of the considered collector. In this example, the related uncertainty of these constants is neglected. G is the solar irradiance and ∆T=Tmean-Tamb is the difference between the mean temperature of the col- lector and the ambient temperature, with Tmean=(Tin+Tout)/2. Tin and Tout represent respectively the inlet and outlet water temperature in the collector. By introduction of the standard deviations, the equation (3) becomes: , (4) Derived standard deviations are calculated according to the propagation of error law for independent and sto- chastic variables [16]: . (5) In (5) the standard deviation of Tmean is the result of Tin and Tout standard deviations combination. For a generic flat plate solar collector with (τα)=0,87, U=3,83 W/m2K and when G=1000W/m2, Tin=50°C and Tout=100°C, the rate of energy gain calculated with the installed cheap sensors will be q=679±61,45 W/m2. Deviation is ap- proximately 9% of the measurement. The effect of G in (4) is predominant. If the equations used were mostly influenced by T values, the results would be more accu- rate. Hence, the example is precautionary. Table 1. Cost and accuracy reduction for the example. EQUIPMENT PRICE (USD) TOTAL PRICE (USD) COST REDUCTION HEAT GAIN Q [W/M2] ACCURACY REDUCTION SCIENTIFIC CR1000 1500 5788 93,3% 679±0 9,05% PT100 (X3) 288 CMP11 4000 TESTED MELACS 260 390 679±61,45 LM35 (X3) 15 SRS1000 115  N. GENTILE ET AL. Copyright © 2013 SciRes. ENG 80 Presuming that the reference sensors give correct values without uncertainty, the proposed calculation can be combined with the equipment cost (tab. 1). 4. Conclusion Scientific research requires investments in materials and resources. Universities of developing countries interested in starting research cannot usually rely on adequate funding. In the majority of the cases they are obliged to give up and the knowledge gap constantly increases. This study concludes that: Scientific research in solar energy can be initialized with fairly low costs. The equipment cost can be cut by up to 95% through using alternative sensors with a drop in accuracy of measurement of about 9%. Ap- proximations in the results obtained with the pro- posed instruments should be always estimated and underlined in report and publications; A large part of the approximation is due to uncertain- ty in solar irradiance measurement. Even if the man- ufacturer could improve the design of only the sensor, its performance could be easily improved. For future solar laboratory, the choice should consider the aims and the needs of the research. Thus, the decision could consist in finding the best fitting invest- ment/accuracy ratio for each case. For the example discussed in this article a pyranometer more accurate than the SRS1000 is recommended. It is strongly recommended to involve local members from the early stages. It is very important to instill a sense of belonging and to state clearly the hoped-for long term aim. By investing in local research, the weak points of the previous form of foreign aid, e.g. pre-packed stand alone photovoltaic systems in rural areas, could be overcome; The executed program in Mozambique is intended to be a suggestion for future similar projects. Different sensors and building solutions have to be tested in order to find the best cost-efficient solution. At the present time, the results and experiences gained are working as inputs for the design of modular solar la- boratories to be built in universities and research in- stitutes of several developing countries; In order to make the information available and reduce the knowledge gap, donors and recipients are en- couraged to publish their work and results in open access journals. 5. Acknowledgements The authors are grateful to the Swedish International Development Cooperation Agency for sponsoring the project. REFERENCES [1] W. Easterly, “The white man’s burden: Why the west’s effort to aid the rest have done so much ill and so little good,” Penguin Books, New York, 2006. [2] P.T. Bauer, “From subsistence to exchange and other essays,” Princeton University Press, Princeton, 2000. [3] W. Easterly, “The elusive quest for growth: Economists’ adventures and misadventures in the tropics,” The MIT press, Cambridge, 2002. [4] J.D. Sachs, “The end of poverty: economic possibilities for our time”, New York, Penguin Books, 2005. [5] P. Mulder, J. Tembe, “Rural electrification in an imper- fect world: A case study from Mozambique,” Energy Policy, Vol. 36, Issue 8, 2008, pp. 2788-2794, doi: 10.1016/j.enpol.2008.05.018 [6] C. R. Williamson, “Exploring the failure of foreign aid: The role of incentives and information,” The review of Austrian economics, Vol. 23, No. 1, 2010, pp. 17-33, doi: 10.1007/s11138-009-0091-7 [7] Alliance for Rural Electrification (ARE), “Energy access in the world: facts and scenarios,” http://www.ruralelec.org/9.0.html [8] A. Eberhard et al., “Unpowered: The State of the Power Sector in Sub-Saharan Africa,” The World Bank, Wash- ington, 2009. [9] The World Bank Group, “World Development Report 2010,” The World Bank, Washington, 2010. [10] U. Deichmann, C. Meisner, S. Murray, D. Wheeler, “The economics of renewable energy expansion in rural Sub-Saharan Africa,” Energy Policy, Vol. 39, Issue 1, 2011, pp. 215-227, doi: 10.1016/j.enpol.2010.09.034 [11] The World Bank Group, “Data. GDP per capita,” 2011. http://data.worldbank.org/indicator/NY.GDP.PCAP.CD [12] M. Suri M., T. Cebecauer, T. Huld, E.D. Dunlop, L. Wald, M. Albuisson, “Photovoltaic Solar Electricity Po- tential in the Mediterranean Basin, Africa, and Southwest Asia,” 2008. http://re.jrc.ec.europa.eu/ [13] O. S. Ismail, O. O. Ajide, F. Akingbesote, “Performance Assessment of Installed Solar PV System: A Case Study of Oke-Agunla in Nigeri,” Engineering, Vol. 4, No. 8, 2012, pp. 453-458, doi: 10.4236/eng.2012.48059 [14] Bernardo R. et al., “Measurements of the Electrical Inci- dence Angle Modifiers of an Asymmetrical Photovolta- ic/Thermal Compound Parabolic Concentrat- ing-Collector,” Power and Energy Engineering Confer- ence and Engineering, Sanya, China, Dec 31, 2012 - Jan 2, 2013, unpublished. [15] A. Ucar, M. Inalli, “A thermo-economical optimization of a domestic solar heating plant with seasonal storage,” Applied Thermal Engineering, Vol. 27, Issue 2-3, 2007, pp. 450-456, doi: 10.1016/j.applthermaleng.2006.06.010 [16] J.R. Taylor, “An introduction to Error Analysis: The Study of Uncertainities in Physical Measurements”, 2nd Edition, University Science Books, 1997 |