

Paper Menu >>
Journal Menu >>
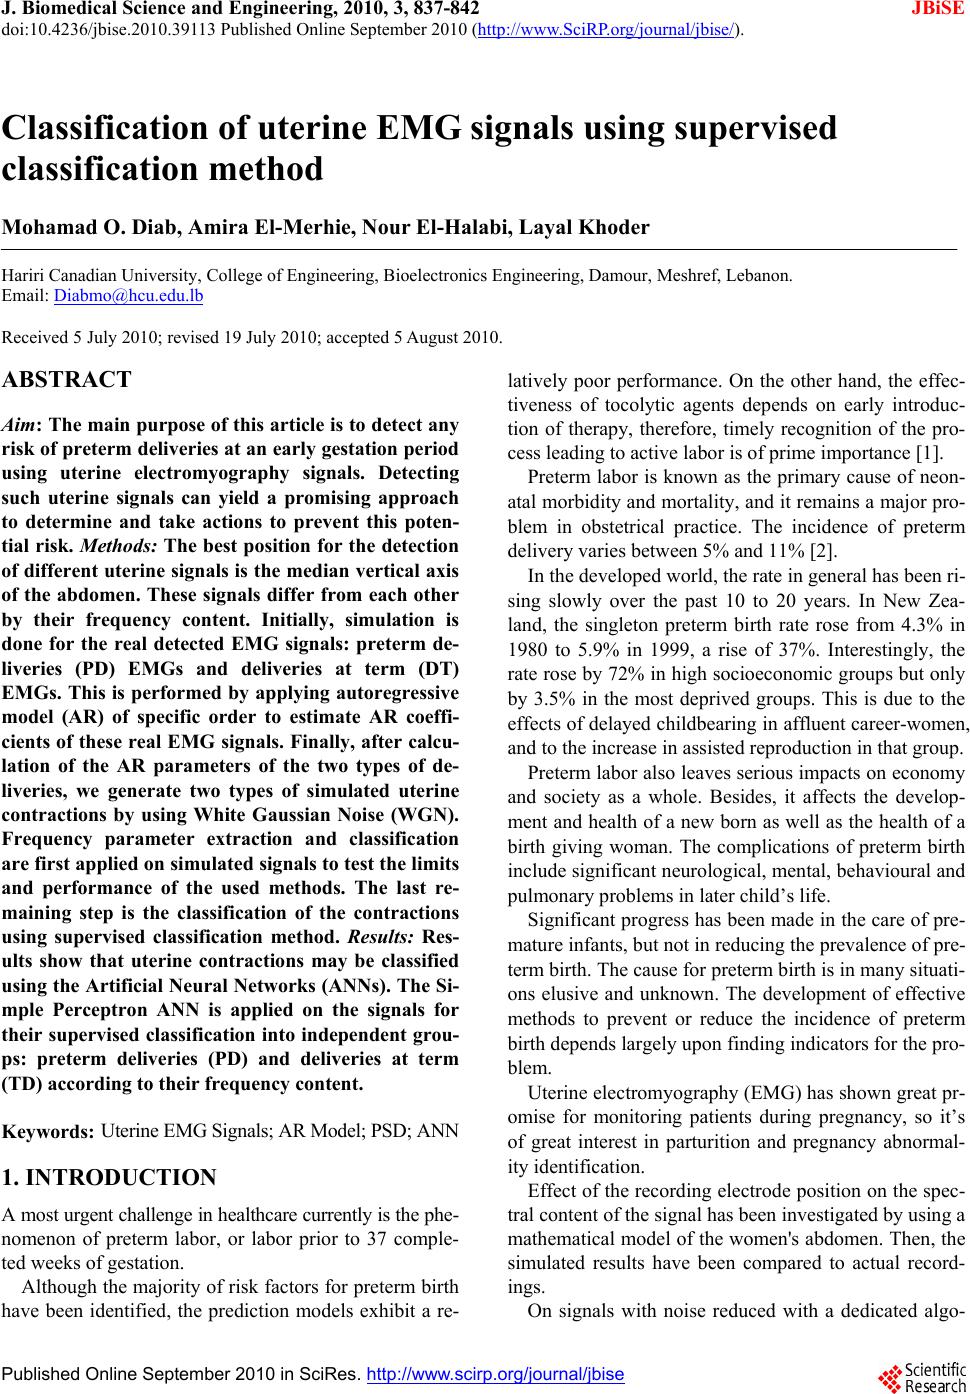 J. Biomedical Science and Engineering, 2010, 3, 837-842 doi:10.4236/jbise.2010.39113 Published Online September 2010 (http://www.SciRP.org/journal/jbise/ JBiSE ). Published Online September 2010 in SciRes. http:// www.scirp.org/journal/jbise Classification of uterine EMG signals using supervised classification method Mohamad O. Diab, Amira El-Merhie, Nour El-Halabi, Layal Khoder Hariri Canadian University, College of Engineering, Bioelectronics Engineering, Damour, Meshref, Lebanon. Email: [email protected] Received 5 July 2010; revised 19 July 2010; accepted 5 August 2010. ABSTRACT Aim: The main purpose of this ar ticle is to det ect any risk of preterm deliveries at an early gestation period using uterine electromyography signals. Detecting such uterine signals can yield a promising approach to determine and take actions to prevent this poten- tial risk. Methods: The best position for the detection of different uterine signals is the median vertical axis of the abdomen. These signals differ from each other by their frequency content. Initially, simulation is done for the real detected EMG signals: preterm de- liveries (PD) EMGs and deliveries at term (DT) EMGs. This is performed by applying autoregressive model (AR) of specific order to estimate AR coeffi- cients of these real EMG signals. Finally, after calcu- lation of the AR parameters of the two types of de- liveries, we generate two types of simulated uterine contractions by using White Gaussian Noise (WGN). Frequency parameter extraction and classification are first applied on simulated signals to test the limits and performance of the used methods. The last re- maining step is the classification of the contractions using supervised classification method. Results: Res- ults show that uterine contractions may be classified using the Artificial Neural Networks (ANNs). The Si- mple Perceptron ANN is applied on the signals for their supervised classification into independent grou- ps: preterm deliveries (PD) and deliveries at term (TD) according to their frequency content. Keywords: Uterine EMG Signals; AR Model; PSD; ANN 1. INTRODUCTION A most urgent challenge in healthcare currently is the phe- nomenon of preterm labor, or labor prior to 37 comple- ted weeks of gestation. Although the majority of risk factors for preterm birth have been identified, the prediction models exhibit a re- latively poor performance. On the other hand, the effec- tiveness of tocolytic agents depends on early introduc- tion of therapy, therefore, timely recognition of the pro- cess leading to active labor is of prime importance [1]. Preterm labor is known as the primary cause of neon- atal morbidity and mortality, and it remains a major pro- blem in obstetrical practice. The incidence of preterm delivery varies between 5% and 11% [2]. In the developed world, the rate in general has been ri- sing slowly over the past 10 to 20 years. In New Zea- land, the singleton preterm birth rate rose from 4.3% in 1980 to 5.9% in 1999, a rise of 37%. Interestingly, the rate rose by 72% in high socioeconomic groups but only by 3.5% in the most deprived groups. This is due to the effects of delayed childbearing in affluent career-women, and to the increase in assisted reproduction in that group. Preterm labor also leaves serious impacts on economy and society as a whole. Besides, it affects the develop- ment and health of a new born as well as the health of a birth giving woman. The complications of preterm birth include significant neurological, mental, behavioural and pulmonary problems in later child’s life. Significant progress has been made in the care of pre- mature infants, but not in reducing the prevalence of pre- term birth. The cause for preterm birth is in many situati- ons elusive and unknown. The development of effective methods to prevent or reduce the incidence of preterm birth depends largely upon finding indicators for the pro- blem. Uterine electromyography (EMG) has shown great pr- omise for monitoring patients during pregnancy, so it’s of great interest in parturition and pregnancy abnormal- ity identification. Effect of the recording electrode position on the spec- tral content of the signal has been investigated by using a mathematical model of the women's abdomen. Then, the simulated results have been compared to actual record- ings. On signals with noise reduced with a dedicated algo- 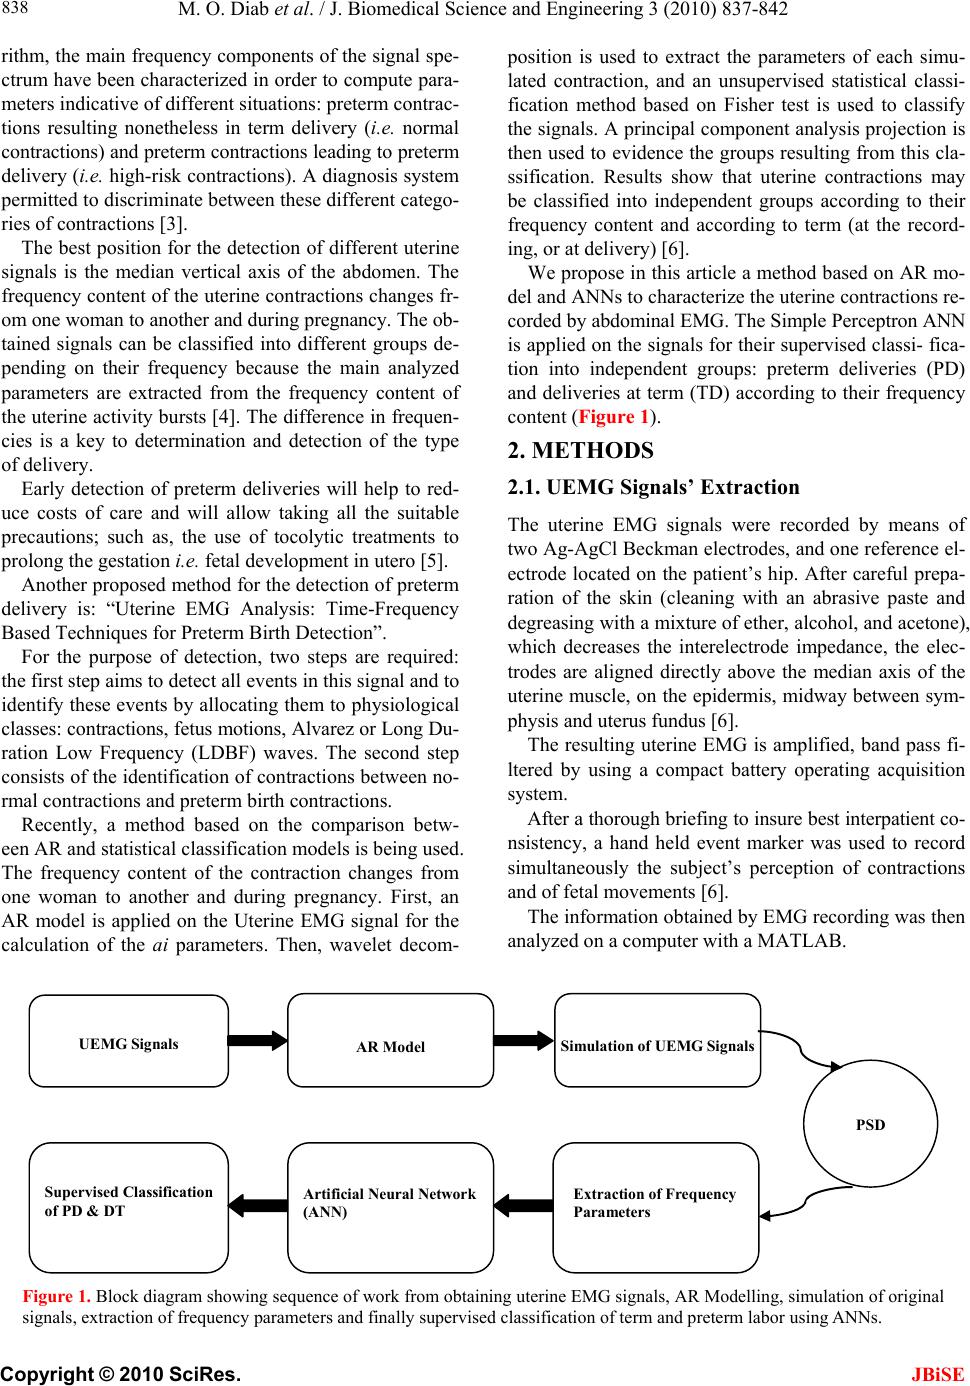 M. O. Diab et al. / J. Biomedical Science and Engineering 3 (2010) 837-842 Copyright © 2010 SciRes. JBiSE 838 rithm, the main frequency components of the signal spe- ctrum have been characterized in order to compute para- meters indicative of different situations: preterm contrac- tions resulting nonetheless in term delivery (i.e. normal contractions) and preterm contractions leading to preterm delivery (i.e. high-risk contractions). A diagnosis system permitted to discriminate between these different catego- ries of contractions [3]. The best position for the detection of different uterine signals is the median vertical axis of the abdomen. The frequency content of the uterine contractions changes fr- om one woman to another and during pregnancy. The ob- tained signals can be classified into different groups de- pending on their frequency because the main analyzed parameters are extracted from the frequency content of the uterine activity bursts [4]. The difference in frequen- cies is a key to determination and detection of the type of delivery. Early detection of preterm deliveries will help to red- uce costs of care and will allow taking all the suitable precautions; such as, the use of tocolytic treatments to prolong the gestation i.e. fetal development in utero [5]. Another proposed method for the detection of preterm delivery is: “Uterine EMG Analysis: Time-Frequency Based Techniques for Preterm Birth Detection”. For the purpose of detection, two steps are required: the first step aims to detect all events in this signal and to identify these events by allocating them to physiological classes: contractions, fetus motions, Alvarez or Long Du- ration Low Frequency (LDBF) waves. The second step consists of the identification of contractions between no- rmal contractions and preterm birth contractions. Recently, a method based on the comparison betw- een AR and statistical classification models is being used. The frequency content of the contraction changes from one woman to another and during pregnancy. First, an AR model is applied on the Uterine EMG signal for the calculation of the ai parameters. Then, wavelet decom- position is used to extract the parameters of each simu- lated contraction, and an unsupervised statistical classi- fication method based on Fisher test is used to classify the signals. A principal component analysis projection is then used to evidence the groups resulting from this cla- ssification. Results show that uterine contractions may be classified into independent groups according to their frequency content and according to term (at the record- ing, or at delivery) [6]. We propose in this article a method based on AR mo- del and ANNs to characterize the uterine contractions re- corded by abdominal EMG. The Simple Perceptron ANN is applied on the signals for their supervised classi- fica- tion into independent groups: preterm deliveries (PD) and deliveries at term (TD) according to their frequency content (Figure 1). 2. METHODS 2.1. UEMG Signals’ Extraction The uterine EMG signals were recorded by means of two Ag-AgCl Beckman electrodes, and one reference el- ectrode located on the patient’s hip. After careful prepa- ration of the skin (cleaning with an abrasive paste and degreasing with a mixture of ether, alcohol, and acetone), which decreases the interelectrode impedance, the elec- trodes are aligned directly above the median axis of the uterine muscle, on the epidermis, midway between sym- physis and uterus fundus [6]. The resulting uterine EMG is amplified, band pass fi- ltered by using a compact battery operating acquisition system. After a thorough briefing to insure best interpatient co- nsistency, a hand held event marker was used to record simultaneously the subject’s perception of contractions and of fetal movements [6]. The information obtained by EMG recording was then analyzed on a computer with a MATLAB. UEMG Signals AR Model Simulation of UEMG Si g nals PSD Extraction of Fre q uenc y Parameters Artificial Ne ural Network (ANN) Supervised Classification of PD & DT Figure 1. Block diagram showing sequence of work from obtaining uterine EMG signals, AR Modelling, simulation of original signals, extraction of frequency parameters and finally supervised classification of term and preterm labor using ANNs. 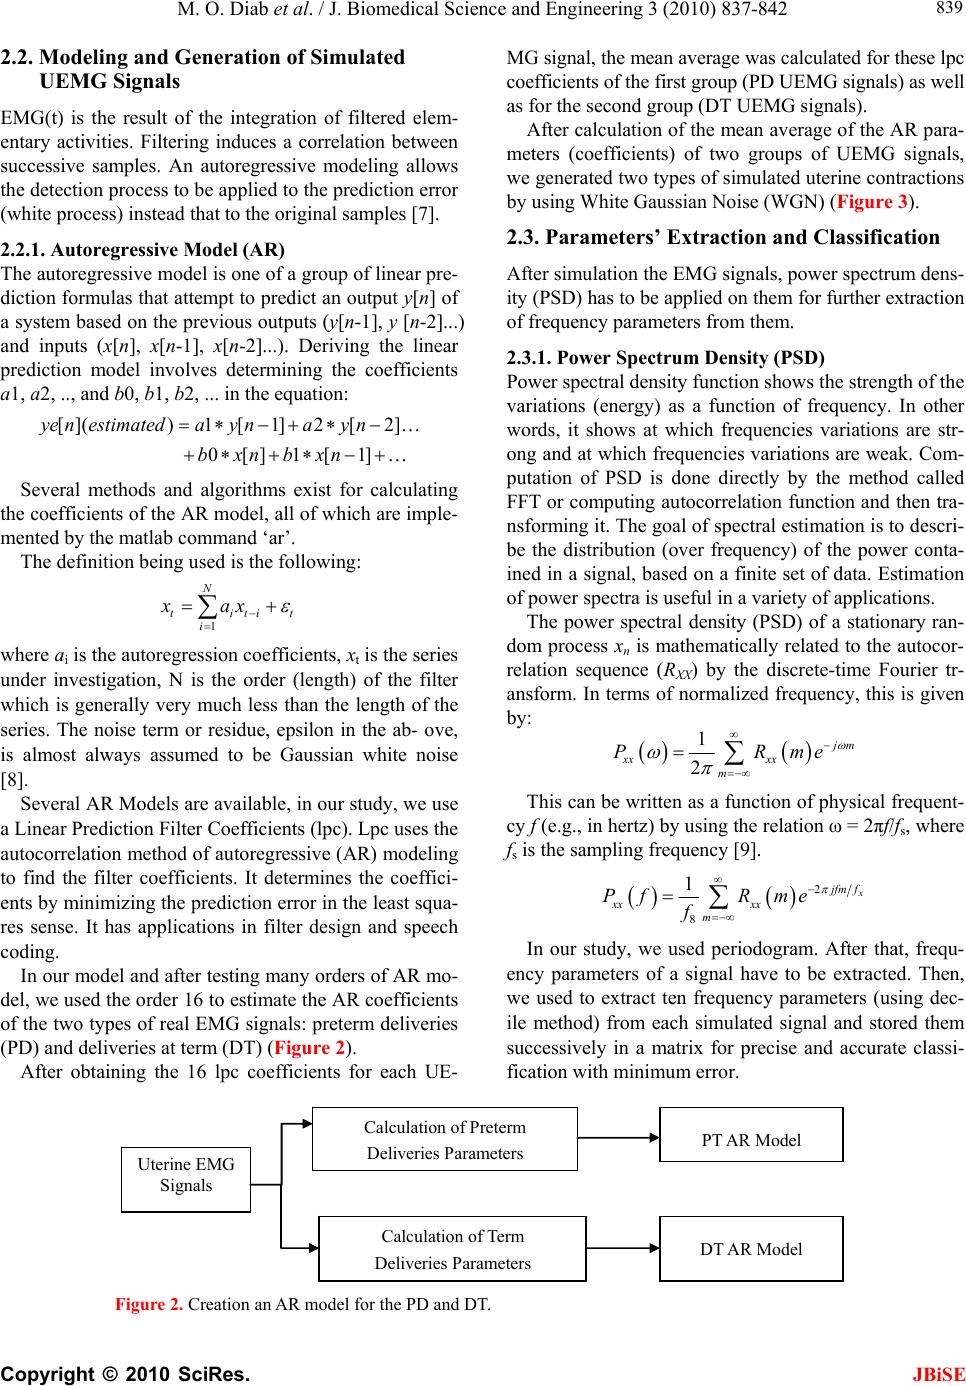 M. O. Diab et al. / J. Biomedical Science and Engineering 3 (2010) 837-842 Copyright © 2010 SciRes. JBiSE 839 t 2.2. Modeling and Generation of Simulated UEMG Signals EMG(t) is the result of the integration of filtered elem- entary activities. Filtering induces a correlation between successive samples. An autoregressive modeling allows the detection process to be applied to the prediction error (white process) instead that to the original samples [7]. 2.2.1. Autoregress ive Model (AR) The autoregressive model is one of a group of linear pre- diction formulas that attempt to predict an output y[n] of a system based on the previous outputs (y[n-1], y [n-2]...) and inputs (x[n], x[n-1], x[n-2]...). Deriving the linear prediction model involves determining the coefficients a1, a2, .., and b0, b1, b2, ... in the equation: []()1 [1]2[2] 0[]1[ 1] yenestimateday nay n bxnbxn Several methods and algorithms exist for calculating the coefficients of the AR model, all of which are imple- mented by the matlab command ‘ar’. The definition being used is the following: 1 N titi i xax where ai is the autoregression coefficients, xt is the series under investigation, N is the order (length) of the filter which is generally very much less than the length of the series. The noise term or residue, epsilon in the ab- ove, is almost always assumed to be Gaussian white noise [8]. Several AR Models are available, in our study, we use a Linear Prediction Filter Coefficients (lpc). Lpc uses the autocorrelation method of autoregressive (AR) modeling to find the filter coefficients. It determines the coeffici- ents by minimizing the prediction error in the least squa- res sense. It has applications in filter design and speech coding. In our model and after testing many orders of AR mo- del, we used the order 16 to estimate the AR coefficients of the two types of real EMG signals: preterm deliveries (PD) and deliveries at term (DT) (Figure 2). After obtaining the 16 lpc coefficients for each UE- MG signal, the mean average was calculated for these lpc coefficients of the first group (PD UEMG signals) as well as for the second group (DT UEMG signals). After calculation of the mean average of the AR para- meters (coefficients) of two groups of UEMG signals, we generated two types of simulated uterine contractions by using White Gaussian Noise (WGN) (Figure 3). 2.3. Parameters’ Extraction and Classification After simulation the EMG signals, power spectrum dens- ity (PSD) has to be applied on them for further extraction of frequency parameters from them. 2.3.1. Power Spectrum Density (PS D) Power spectral density function shows the strength of the variations (energy) as a function of frequency. In other words, it shows at which frequencies variations are str- ong and at which frequencies variations are weak. Com- putation of PSD is done directly by the method called FFT or computing autocorrelation function and then tra- nsforming it. The goal of spectral estimation is to descri- be the distribution (over frequency) of the power conta- ined in a signal, based on a finite set of data. Estimation of power spectra is useful in a variety of applications. The power spectral density (PSD) of a stationary ran- dom process xn is mathematically related to the autocor- relation sequence (RXX) by the discrete-time Fourier tr- ansform. In terms of normalized frequency, this is given by: 1 2 j m xx xx m PRm e This can be written as a function of physical frequent- cy f (e.g., in hertz) by using the relation ω = 2πf/fs, where fs is the sampling frequency [9]. 2 8 1x j fm f xx xx m Pf Rme f In our study, we used periodogram. After that, frequ- ency parameters of a signal have to be extracted. Then, we used to extract ten frequency parameters (using dec- ile method) from each simulated signal and stored them successively in a matrix for precise and accurate classi- fication with minimum error. Uterine EMG Signals Calculation of Preterm Deliveries Parameters Calculation of Term Deliveries Parameters PT AR Model DT AR Model Figure 2. Creation an AR model for the PD and DT. 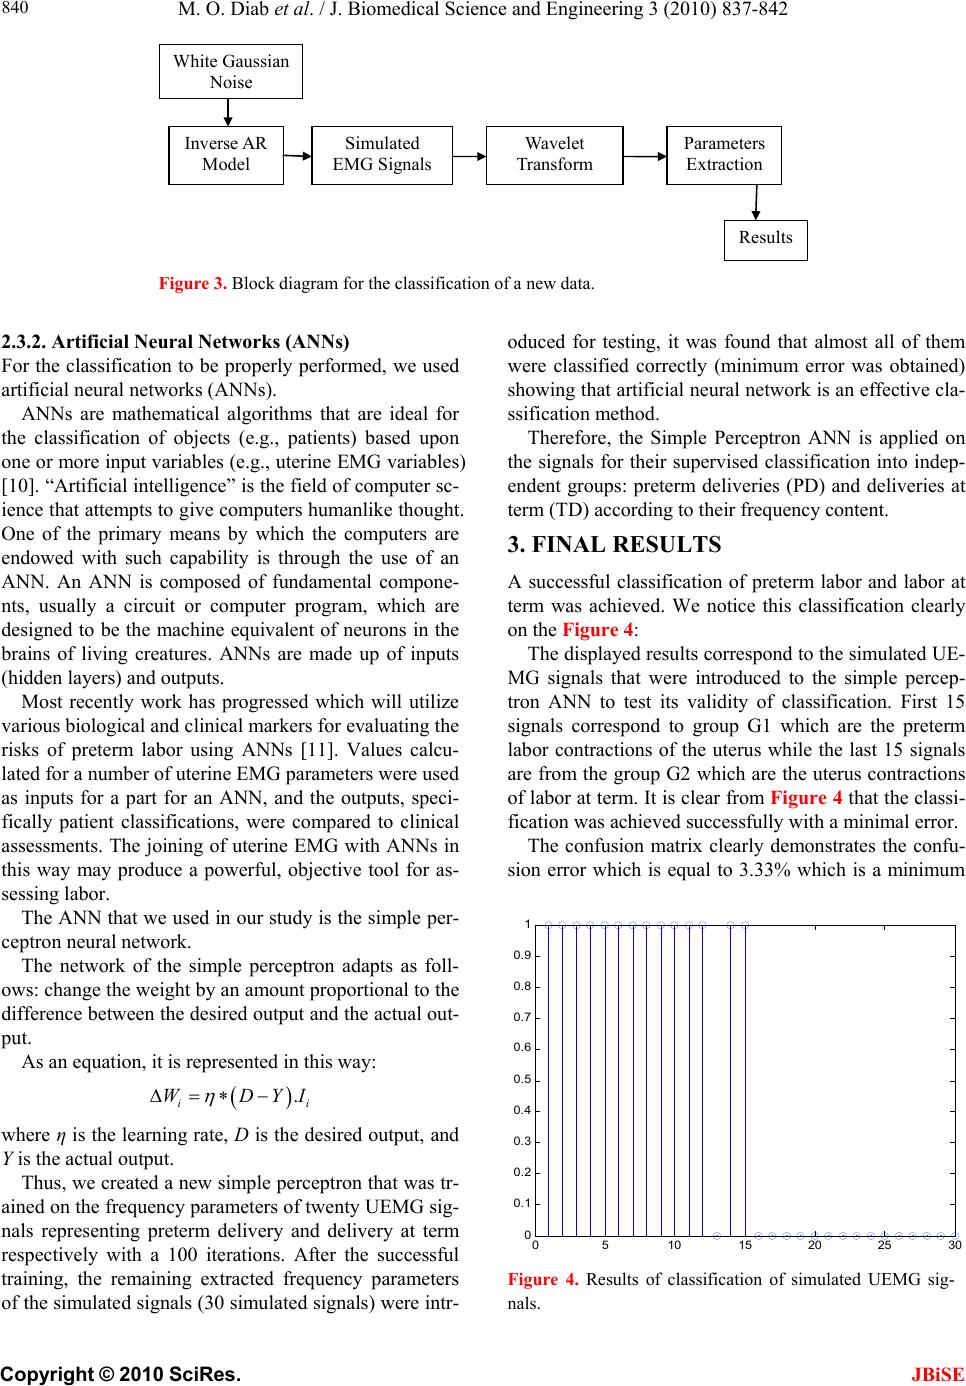 M. O. Diab et al. / J. Biomedical Science and Engineering 3 (2010) 837-842 Copyright © 2010 SciRes. JBiSE 840 Wavelet Transform Parameters Extraction Results Inverse AR Model White Gaussian Noise Simulated EMG Signals Figure 3. Block diagram for the classification of a new data. 2.3.2. Artificial Neural Networks (ANNs) For the classification to be properly performed, we used artificial neural networks (ANNs). ANNs are mathematical algorithms that are ideal for the classification of objects (e.g., patients) based upon one or more input variables (e.g., uterine EMG variables) [10]. “Artificial intelligence” is the field of computer sc- ience that attempts to give computers humanlike thought. One of the primary means by which the computers are endowed with such capability is through the use of an ANN. An ANN is composed of fundamental compone- nts, usually a circuit or computer program, which are designed to be the machine equivalent of neurons in the brains of living creatures. ANNs are made up of inputs (hidden layers) and outputs. Most recently work has progressed which will utilize various biological and clinical markers for evaluating the risks of preterm labor using ANNs [11]. Values calcu- lated for a number of uterine EMG parameters were used as inputs for a part for an ANN, and the outputs, speci- fically patient classifications, were compared to clinical assessments. The joining of uterine EMG with ANNs in this way may produce a powerful, objective tool for as- sessing labor. The ANN that we used in our study is the simple per- ceptron neural network. The network of the simple perceptron adapts as foll- ows: change the weight by an amount proportional to the difference between the desired output and the actual out- put. As an equation, it is represented in this way: . ii WDY I where η is the learning rate, D is the desired output, and Y is the actual output. Thus, we created a new simple perceptron that was tr- ained on the frequency parameters of twenty UEMG sig- nals representing preterm delivery and delivery at term respectively with a 100 iterations. After the successful training, the remaining extracted frequency parameters of the simulated signals (30 simulated signals) were intr- oduced for testing, it was found that almost all of them were classified correctly (minimum error was obtained) showing that artificial neural network is an effective cla- ssification method. Therefore, the Simple Perceptron ANN is applied on the signals for their supervised classification into indep- endent groups: preterm deliveries (PD) and deliveries at term (TD) according to their frequency content. 3. FINAL RESULTS A successful classification of preterm labor and labor at term was achieved. We notice this classification clearly on the Figure 4: The displayed results correspond to the simulated UE- MG signals that were introduced to the simple percep- tron ANN to test its validity of classification. First 15 signals correspond to group G1 which are the preterm labor contractions of the uterus while the last 15 signals are from the group G2 which are the uterus contractions of labor at term. It is clear from Figure 4 that the classi- fication was achieved successfully with a minimal error. The confusion matrix clearly demonstrates the confu- sion error which is equal to 3.33% which is a minimum 05 1015 20 2530 0 0.1 0.2 0.3 0.4 0.5 0.6 0.7 0.8 0.9 1 Figure 4. Results of classification of simulated UEMG sig- nals. 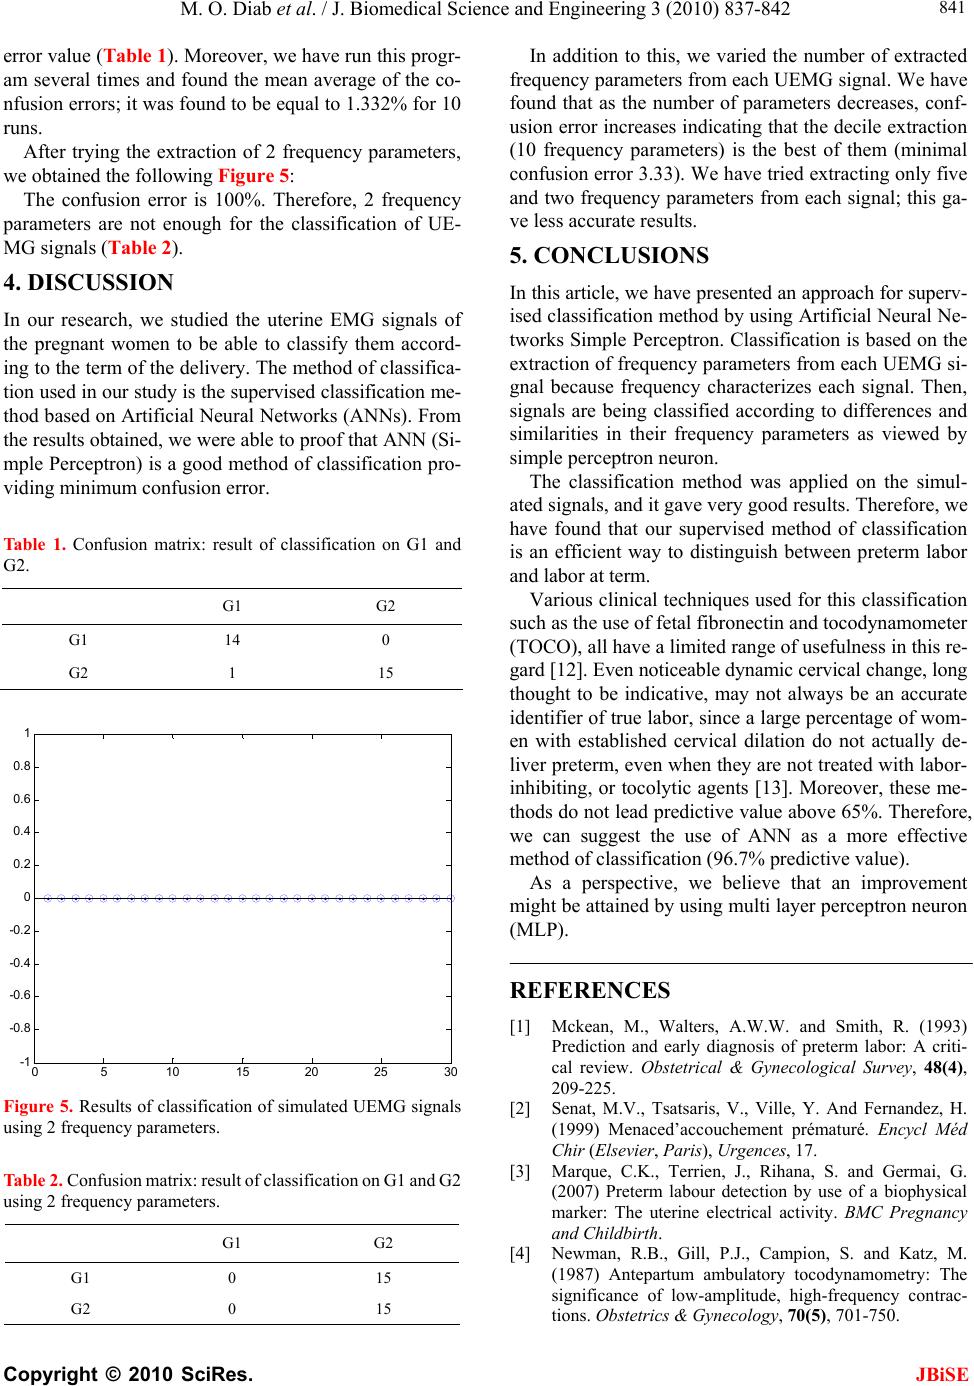 M. O. Diab et al. / J. Biomedical Science and Engineering 3 (2010) 837-842 Copyright © 2010 SciRes. JBiSE 841 error value (Tabl e 1). Moreover, we have run this progr- am several times and found the mean average of the co- nfusion errors; it was found to be equal to 1.332% for 10 runs. After trying the extraction of 2 frequency parameters, we obtained the following Figure 5: The confusion error is 100%. Therefore, 2 frequency parameters are not enough for the classification of UE- MG signals (Table 2). 4. DISCUSSION In our research, we studied the uterine EMG signals of the pregnant women to be able to classify them accord- ing to the term of the delivery. The method of classifica- tion used in our study is the supervised classification me- thod based on Artificial Neural Networks (ANNs). From the results obtained, we were able to proof that ANN (Si- mple Perceptron) is a good method of classification pro- viding minimum confusion error. Table 1. Confusion matrix: result of classification on G1 and G2. G1 G2 G1 14 0 G2 1 15 05 10 15 20 25 30 -1 -0.8 -0.6 -0.4 -0.2 0 0.2 0.4 0.6 0.8 1 Figure 5. Results of classification of simulated UEMG signals using 2 frequency parameters. Table 2. Confusion matrix: result of classification on G1 and G2 using 2 frequency parameters. G1 G2 G1 0 15 G2 0 15 In addition to this, we varied the number of extracted frequency parameters from each UEMG signal. We have found that as the number of parameters decreases, conf- usion error increases indicating that the decile extraction (10 frequency parameters) is the best of them (minimal confusion error 3.33). We have tried extracting only five and two frequency parameters from each signal; this ga- ve less accurate results. 5. CONCLUSIONS In this article, we have presented an approach for superv- ised classification method by using Artificial Neural Ne- tworks Simple Perceptron. Classification is based on the extraction of frequency parameters from each UEMG si- gnal because frequency characterizes each signal. Then, signals are being classified according to differences and similarities in their frequency parameters as viewed by simple perceptron neuron. The classification method was applied on the simul- ated signals, and it gave very good results. Therefore, we have found that our supervised method of classification is an efficient way to distinguish between preterm labor and labor at term. Various clinical techniques used for this classification such as the use of fetal fibronectin and tocodynamometer (TOCO), all have a limited range of usefulness in this re- gard [12]. Even noticeable dynamic cervical change, long thought to be indicative, may not always be an accurate identifier of true labor, since a large percentage of wom- en with established cervical dilation do not actually de- liver preterm, even when they are not treated with labor- inhibiting, or tocolytic agents [13]. Moreover, these me- thods do not lead predictive value above 65%. Therefore, we can suggest the use of ANN as a more effective method of classification (96.7% predictive value). As a perspective, we believe that an improvement might be attained by using multi layer perceptron neuron (MLP). REFERENCES [1] Mckean, M., Walters, A.W.W. and Smith, R. (1993) Prediction and early diagnosis of preterm labor: A criti- cal review. Obstetrical & Gynecological Survey, 48(4), 209-225. [2] Senat, M.V., Tsatsaris, V., Ville, Y. And Fernandez, H. (1999) Menaced’accouchement prématuré. Encycl Méd Chir (Elsevier, Paris), Urgences, 17. [3] Marque, C.K., Terrien, J., Rihana, S. and Germai, G. (2007) Preterm labour detection by use of a biophysical marker: The uterine electrical activity. BMC Pregnancy and Childbirth. [4] Newman, R.B., Gill, P.J., Campion, S. and Katz, M. (1987) Antepartum ambulatory tocodynamometry: The significance of low-amplitude, high-frequency contrac- tions. Obstetrics & Gynecology, 70(5), 701-750.  M. O. Diab et al. / J. Biomedical Science and Engineering 3 (2010) 837-842 Copyright © 2010 SciRes. 842 JBiSE [5] Marque, C., Duchêne, J., Leclercq, S., et al. (1986) Uter- ine EHG processing for obstetrical monitoring. IEEE Transactions on Biomedical Engineering, 33(12), 1182- 1187. [6] Diab, M.O., Marque, C. and Khalil, M.A. (2007) Classi- fication for uterine EMG signals: Comparison between AR model and statistical classification method. Interna- tional Journal of computational cognition, 5(1), 8-14. [7] Khalil, M. and Duchene, J. (1999) Detection and classi- fication of multiple events in piecewise stationary signals: Comparison between autoregressive and multiscale ap- proaches. Signals processing, 75(3), 239-251. [8] Hayes, M. (1996) Statistical digital signal processing and modelling. John Wiley & Sons, Georgia Institute of Technology. [9] Kay, S. (1988) Modern spectral estimation theory and application. Englewood Cliffs, Prentice-Hall, New Jersey. [10] Gurney, K. (1997) An introduction to neural networks, University College London Press. [11] Lockwood, C.J. and Kuczynski, E. (2001) Risk stratifica- tion and pathological mechanisms in preterm delivery. Paediatric and Perinatal Epidemiology, 15(Suppl 2), 78-89. [12] Iams, J.D. (2003) Prediction and early detection of pre- term labor. American Journal of Obstetrics & Gynecol- ogy, 101(2), 402-412. [13] Linhart, J., Olson, G., Goodrum, L., Rowe, T., Saade, G. and Hankins, G. (1990) Preterm labor at 32 to 34 weeks gestation: Effect of a policy of expectant management on length of gestation. American Journal of Obstetrics & Gynecology, 178-179. |