

Paper Menu >>
Journal Menu >>
 Vol.5, No.1, 8-13 (2013) Health http://dx.doi.org/10.4236/health.2013.51002 Inventory control techniques in medical stores of a tertiary care neuropsychiatry hospital in Delhi Sarbjeet Khurana1, Neelam Chhillar2, Vinod Kumar Singh Gautam3 1Department of Epidemiology, Institute of Human Behaviour & Allied Scien ces, Delhi, India; [email protected] 2Department of Neurochemistry, Institute of Human Behaviour & Allied Sciences, Delhi, India; [email protected] 3Department of Neurosurgery, Institute of Human Behaviour & Allied Scien ces, Delhi, India; [email protected] Received 22 December 2011; revised 28 January 2013; accepted 1 February 2013 ABSTRACT Approximately 35.0% of annual hospitals budget is spent on buying materials and supplies, in- cluding medicines. We can bring about substan- tial improvement in the hospital inventory and expenditures by the inventory control techniques. Objective: To identify the categories of drugs which need stringent management control. Ma- terial and Method: The ABC and VED analysis of the medical store of a Neuropsychiatry hospital at Delhi, India was conducted for the year 2008- 2009 to identify the categories of items needing stringent management control. Results: The to- tal number of the drugs at the medical store was 145 drugs. The total annual drug expenditure (ADE) on these drug items was Rs. 19219594.79. ABC analysis revealed 3.45%, 6.9% and 89.65% items as A, B and C category items, respectiv ely, accounting for 70.5%, 19.68% and 9.83% of ADE of the medical store. VED analysis showed 32.41%, 61.38% and 6.2% items as V, E, and D category items, respectively, accounting for 70.9%, 28.72% and 0.38% of ADE of the medical store. On ABC-VED matrix analysis, 33.8%, 60% and 6.2% items were found to be Category I, II and III items, respectively, accounting for 92.33%, 7.29% and 0.38% of ADE of the medical store. Conclusion: It is sugg ested by the study that the management of Category I drugs should be done by the top management resulting in stringent control on the annual expenses. The Category II should be managed by the middle management level and Category III at lower managerial level. Keyw ords: ABC; VED Analysis; Inventory Control; Inventory Management 1. INTRODUCTION Approximately 35.0% of annual hospitals budget is spent on buying materials and supplies, including medi- cines [1]. This requires effective and efficient manage- ment of the medical stores. Efficient priority setting, de- cision making in purchase and distribution of specific drugs, close supervision on drugs belonging to important categories, and prevention of pilferage depend on the drug and inventory management. Quality of care in tertiary care hospitals is also sensi- tive to the timely availability of facilities in cluding drugs. Huge budget and key element in the provision of care make drugs as an important component of hospital care. The medical store is one of the most extensively used facilities of the hospital and on e of the few areas where a large amount of money is spent on purchases on a recur- ring basis. This emphasizes the need for planning, de- signing and organizing the medical stores in a manner that results in efficient clinical and administrative ser- vices [2]. The goal of the hospital supply system is to ensure that there is adequate stock of the required items so that an uninterrupted supply of all essential items is maintained. A study conducted by the Department of Personnel and Administrative Reforms in India has re- vealed that not only does the quantity of medicines re- ceived fall short of the requirement but also the su pply is often erratic. Even common medicines are out of stock and remain so for a considerable period [3]. Of the vari- ous explanations for non-availability of even simple medicines in the third world countries, a large number are related to materials management. A study from a 1500-bedded state-funded hospital has claimed that re- view and control measures for expensive drugs brought about 20% savings [4]. Drug inventory management aims at cost containment and improved efficiency [5]. Inventory control is very essential in a developing coun try like India [6]. India is a country of scarce resources and it is the primary respon- sibility of each hospital to ensure optimum utilization of available resources to provide good service or quality patient care. Usually, the hospital management is faced with choosing the alternative of eith er lowering the qual- Copyright © 2013 SciRes. OPEN ACCESS  S. Khurana et al. / Health 5 (2013) 8-13 9 ity of care or adopting ways and means to reduce the cost of inventories. Therefore, the need of the hour is that we follow the principles of rational drug use and inventory management techniques so that in the existing budget we can cater to more number of patients. It is essential that health managers use scientific meth- ods to maximize their returns from investment at a mini- mal cost [6-9]. Inventory analysis seeks to achieve maxi- mal output with minimal investment input, based on the economic principle of stretching the limited means to meet unlimited ends. Each item may be considered criti- cal and there is a perceived need to supply very high lev- els of service [10]. There is no denying that stocking hospital pharmaceu- ticals and supplies can be expensive and tie up a lot of capital, and bringing efficiencies to such important cost drivers—often 30% - 40% of a hospital’s budget—can present meaningful savings [11]. Thus, a hospital materi- als manager must establish efficient inventory system policies for normal operating conditions that also ensure the hospital’s ability to meet emergency demand condi- tions [12]. The study of use pattern helps in designing appropriate corrective measures. ABC analysis is an im- portant tool used worldwide, identifying items that need greater attention for control [6-9,13]. The limitation of ABC analysis is that it is based only on monetary value and rate of consumption of the items. Sometimes, par- ticularly in a hospital an item o f low monetary value and consumption may be very vital or even life saving. Their importance cannot be overlooked simply because they do not appear in category A of inventory. Therefore, another parameter of the materials is their criticality. This could be in item of the therapeutic value of a drug or intrinsic value of the material in achieving the objectives of the hospital system. We undertook this analysis of inventory control of drugs to identify areas for further improvement as well as to find corrective in terventions to achieve this end resu lt, we did the analysis of inventory control of drugs of the tertiary care Hospital providing the Neuropsychiatric care in Delhi, India for the last completed financial year, 2008-2009. We attempted to narrow down the areas, where man- agement supervision and control measures are needed for optimal utilization of the available resources. 2. AIMS & OBJECTIVES General objective: To identify the categories of drugs which need strin- gent management control. Specific objectives of this study were to: To analyze the annual consumption of items of medi- cal store and expenditure incurred on them for the year 2008-2009; To evolve a priority system based on ABC and VED and ABC-VED matrix analysis; To identify the item categories requiring greater su- pervisory monitor ing. 3. MATERIAL AND METHODS The study was conducted at one of the largest super specialties tertiary care centers in Delhi, dedicated exclu- sively to neuropsychiatric and behavioral illnesses. It is an apex tertiary care institution of psychiatry, neurology and behavioral sciences utilizing a multidisciplinary ap- proach. The data of annual consumption and expenditure incurred on each item of the medical store for the finan- cial year 2008-2009 were collected and then transcribed and analyzed in MS Excel. 3.1. ABC Analysis The annual consumption of all the drugs was calcu- lated after multiplying unit cost by annual consumption and the resulting annual expenditure of individual items was arranged in descending order. Next step was to cal- culate the items cumulative cost of all the items, as well as the cumulative percentage of expenditure and the cu- mulative percentage of number of items. The drugs were then classified into three categories: A, B and C, based on the cumulative cost percentage of 70%, 20% and 10%, respectively. 3.2. VED Analysis Criticality analysis of all the d rugs in th e medical stor e was conducted and then these drugs were classified bas ed into three group s. Those drugs which are critical ly ne ed ed as the life saving drugs and those that must be available at all times were included in the V category. The items having lesser criticality needs as well as those that may be available in the ho spital were included in the E group. The items with lowest criticality, or those whose short- age may not pose a threat to the health of the patients, were included in the D group. 3.3. ABC-VED Matrix Analysis The data was coupled into an ABC-VED matrix by cross-tabulating the ABC and VED analysis. This re- sulted in categorization of drugs into (I, II and III). Category I comprised of items belonging to AV, AE, AD, BV and CV subcategories. The BE, CE and BD sub- categories were included in categor y II, and the category III was represented by items in the CD subcategory. The first alphabet of these subcategories represent its po sition in the ABC analysis, whereas the second alphabet repre- sents its place in the VED analysis. Copyright © 2013 SciRes. OPEN ACCESS 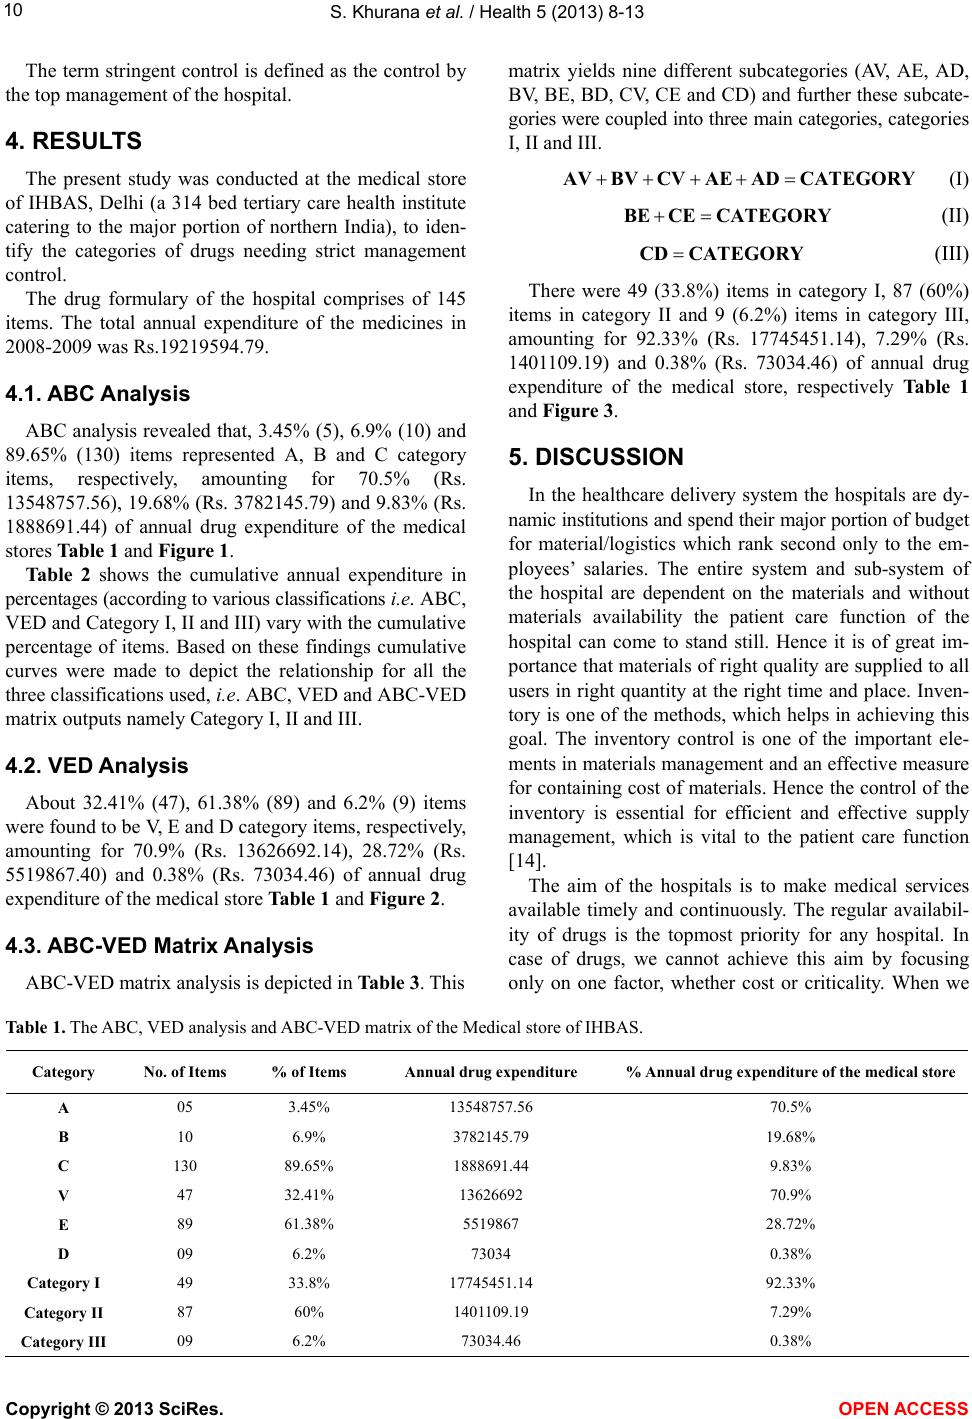 S. Khurana et al. / Health 5 (2013) 8-13 Copyright © 2013 SciRes. 10 matrix yields nine different subcategories (AV, AE, AD, BV, BE, BD, CV, CE and CD) and further these subcate- gories were cou pled into three main categori es, ca teg or ie s I, II and III. The term stringent control is defined as the control by the top management of the hospital. 4. RESULTS AVBVCVAEADCATEGORY (I) The present study was conducted at the medical store of IHBAS, Delhi (a 314 bed tertiary care health institute catering to the major portion of northern India), to iden- tify the categories of drugs needing strict management control. BECECATEGORY (II) CDCATEGORY (III) There were 49 (33.8%) items in category I, 87 (60%) items in category II and 9 (6.2%) items in category III, amounting for 92.33% (Rs. 17745451.14), 7.29% (Rs. 1401109.19) and 0.38% (Rs. 73034.46) of annual drug expenditure of the medical store, respectively Table 1 and Figure 3. The drug formulary of the hospital comprises of 145 items. The total annual expenditure of the medicines in 2008-2009 was Rs.19219594.79. 4.1. ABC Analysis ABC analysis revealed that, 3.45% (5), 6.9% (10) and 89.65% (130) items represented A, B and C category items, respectively, amounting for 70.5% (Rs. 13548757.56), 1 9.68% (Rs. 3782145.79 ) and 9.83% (Rs. 1888691.44) of annual drug expenditure of the medical stores Table 1 and Figure 1. 5. DISCUSSION In the healthcare delivery system the hospitals are dy- namic institutions and spend their major portion of b udg et for material/logistics which rank second only to the em- ployees’ salaries. The entire system and sub-system of the hospital are dependent on the materials and without materials availability the patient care function of the hospital can come to stand still. Hence it is of great im- portance that materials of right quality are supplied to all users in right quantity at the right time and place. Inven- tory is one of the methods, which helps in achieving this goal. The inventory control is one of the important ele- ments in materials management and an effective measure for containing cost of materials. Hence the control of the inventory is essential for efficient and effective supply management, which is vital to the patient care function [14]. Table 2 shows the cumulative annual expenditure in percentages (according to various classifications i.e. ABC, VED and Category I, II and III) vary with the cumulative percentage of items. Based on these findings cumulative curves were made to depict the relationship for all the three classifications used, i.e. ABC, VED and ABC-VED matrix outputs namely Category I, II and III. 4.2. VED Analysis About 32.41% (47), 61.38% (89) and 6.2% (9) items were found to be V, E and D category items, respectively, amounting for 70.9% (Rs. 13626692.14), 28.72% (Rs. 5519867.40) and 0.38% (Rs. 73034.46) of annual drug expenditure of the medical store Table 1 and Figure 2. The aim of the hospitals is to make medical services available timely and continuously. The regular availabil- ity of drugs is the topmost priority for any hospital. In case of drugs, we cannot achieve this aim by focusing only on one factor, whether cost or criticality. When we 4.3. ABC-VED Matrix Analysis ABC-VED matrix analysis is depicted in Table 3. This Table 1. The ABC, VED analysis and ABC-VED matrix of the Medical store of IHBAS. Category No. of Items % of Items Annual drug expenditure % Annual drug expenditure of the medical store A 05 3.45% 13548757.56 70.5% B 10 6.9% 3782145.79 19.68% C 130 89.65% 1888691.44 9.83% V 47 32.41% 13626692 70.9% E 89 61.38% 5519867 28.72% D 09 6.2% 73034 0.38% Category I 49 33.8% 17745451.14 92.33% Category II 87 60% 1401109.19 7.29% Category III 09 6.2% 73034.46 0.38% OPEN ACCESS 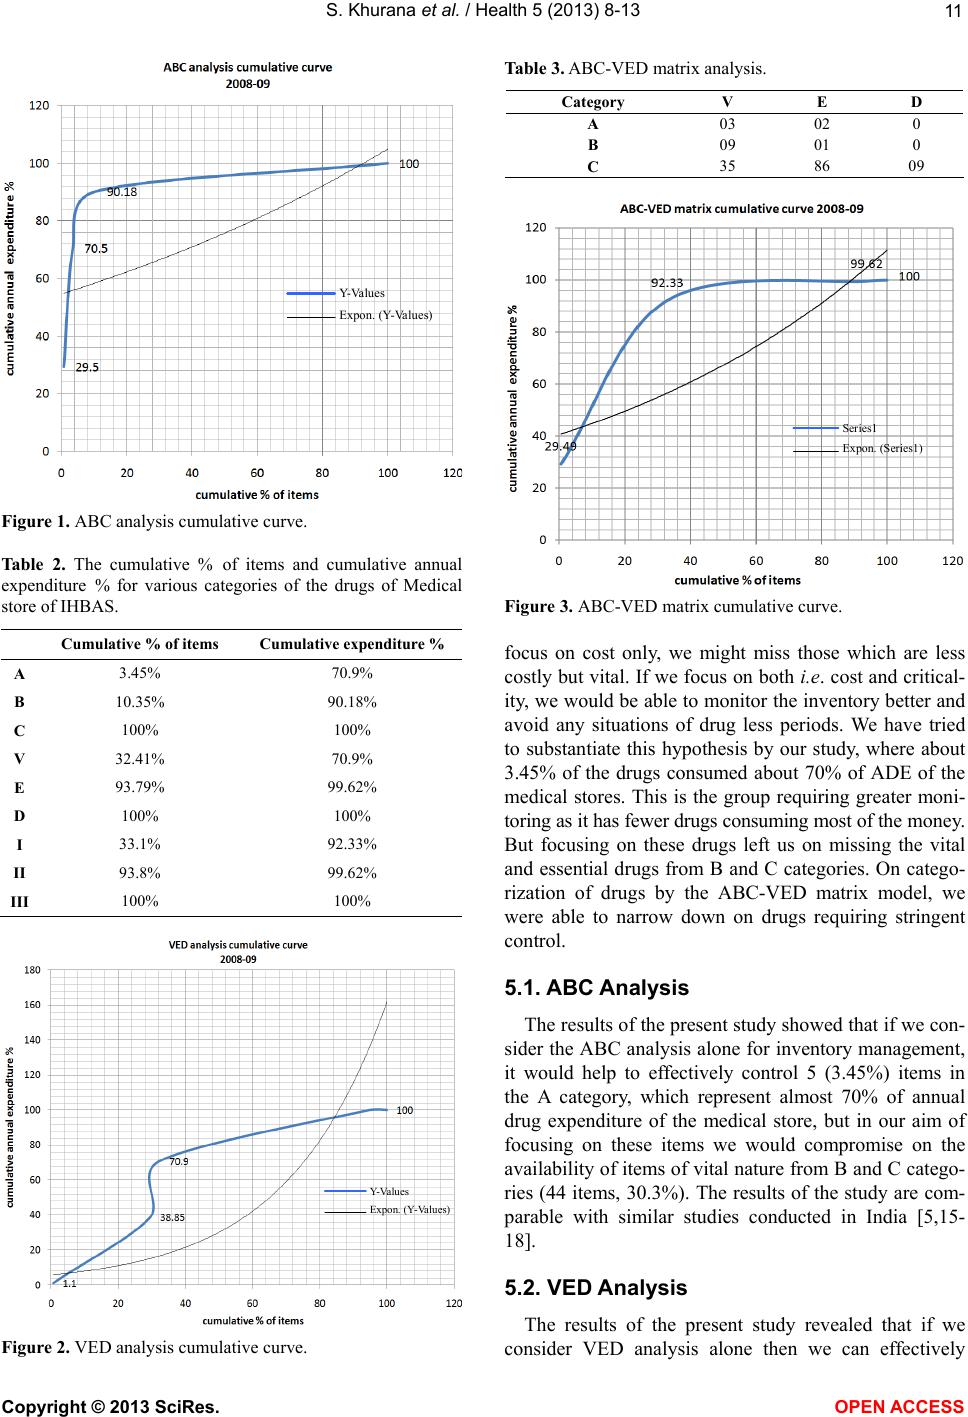 S. Khurana et al. / Health 5 (2013) 8-13 11 Y-Values Expon. (Y-Values) Figure 1. ABC analysis cumulative curve. Table 2. The cumulative % of items and cumulative annual expenditure % for various categories of the drugs of Medical store of IHBAS. Cumulative % of items Cumulative expenditure % A 3.45% 70.9% B 10.35% 90.18% C 100% 100% V 32.41% 70.9% E 93.79% 99.62% D 100% 100% I 33.1% 92.33% II 93.8% 99.62% III 100% 100% Y-Values Expon. (Y-Values) Figure 2. VED analysis cumulative curve. Table 3. ABC-VED matrix analysis. Category V E D A 03 02 0 B 09 01 0 C 35 86 09 Series1 Expon. (Series1) Figure 3. ABC-VED matrix cumulative curve. focus on cost only, we might miss those which are less costly but vital. If we focus on both i.e. cost and critical- ity, we would be able to monitor the inventory better and avoid any situations of drug less periods. We have tried to substantiate this hypothesis by our study, where about 3.45% of the drugs consumed about 70% of ADE of the medical stores. This is the group requiring greater moni- toring as it has fewer drugs consuming most of the money. But focusing on these drugs left us on missing the vital and essential drugs from B and C categories. On catego- rization of drugs by the ABC-VED matrix model, we were able to narrow down on drugs requiring stringent control. 5.1. ABC Analysis The results of the present study showed th at if we con- sider the ABC analysis alone for inventory management, it would help to effectively control 5 (3.45%) items in the A category, which represent almost 70% of annual drug expenditure of the medical store, but in our aim of focusing on these items we would compromise on the availability of items of vital nature from B and C catego- ries (44 items, 30.3%). The results of the study are com- parable with similar studies conducted in India [5,15- 18]. 5.2. VED Analysis The results of the present study revealed that if we consider VED analysis alone then we can effectively Copyright © 2013 SciRes. OPEN ACCESS 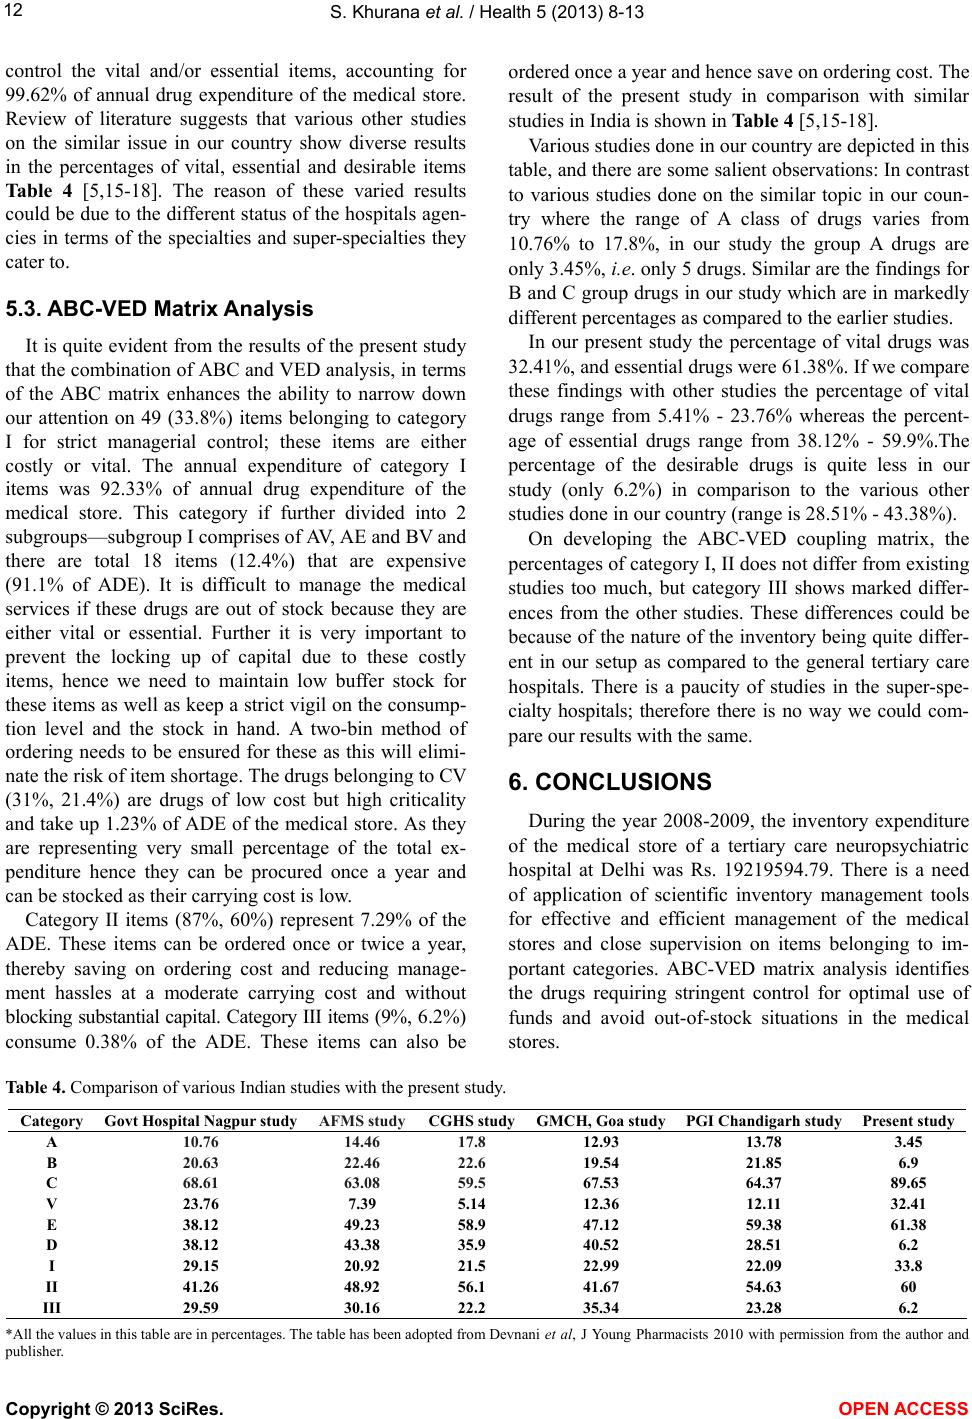 S. Khurana et al. / Health 5 (2013) 8-13 12 control the vital and/or essential items, accounting for 99.62% of annual drug expenditure of the medical store. Review of literature suggests that various other studies on the similar issue in our country show diverse results in the percentages of vital, essential and desirable items Table 4 [5,15-18]. The reason of these varied results could be due to the different status of the hospitals agen- cies in terms of the specialties and super-specialties they cater to. 5.3. ABC-VED Matrix Analysis It is quite evident fro m the results of the pr esent study that the combination of ABC and VED analysis, in terms of the ABC matrix enhances the ability to narrow down our attention on 49 (33.8%) items belonging to category I for strict managerial control; these items are either costly or vital. The annual expenditure of category I items was 92.33% of annual drug expenditure of the medical store. This category if further divided into 2 subgroups—subgroup I comprises of AV, AE and BV and there are total 18 items (12.4%) that are expensive (91.1% of ADE). It is difficult to manage the medical services if these drugs are out of stock because they are either vital or essential. Further it is very important to prevent the locking up of capital due to these costly items, hence we need to maintain low buffer stock for these items as well as keep a strict vigil on the consump- tion level and the stock in hand. A two-bin method of ordering needs to be ensured for these as this will elimi- nate the risk of item shortage. The drugs belonging to CV (31%, 21.4%) are drugs of low cost but high criticality and take up 1 .23% of ADE of the medical store. As they are representing very small percentage of the total ex- penditure hence they can be procured once a year and can be stocked as their carrying cost is low. Category II items (87%, 60%) represent 7.29% of the ADE. These items can be ordered once or twice a year, thereby saving on ordering cost and reducing manage- ment hassles at a moderate carrying cost and without blocking substantial capital. Category III items (9%, 6 .2% ) consume 0.38% of the ADE. These items can also be ordered once a year and hence save on ordering cost. The result of the present study in comparison with similar studies in India is shown in Table 4 [5,15-18]. Various studies done in our country are depicted in this table, and there are some salient observations: In contrast to various studies done on the similar topic in our coun- try where the range of A class of drugs varies from 10.76% to 17.8%, in our study the group A drugs are only 3.45%, i.e. only 5 drugs. Similar are the findings for B and C group drugs in our study which are in markedly different percentages as compared to the earlier studies. In our present study the percentage of vital drugs was 32.41%, and essential drugs were 61.38%. If we compare these findings with other studies the percentage of vital drugs range from 5.41% - 23.76% whereas the percent- age of essential drugs range from 38.12% - 59.9%.The percentage of the desirable drugs is quite less in our study (only 6.2%) in comparison to the various other studies done in our country (range is 28.51% - 43.38%). On developing the ABC-VED coupling matrix, the percentages of category I, II does not differ from existing studies too much, but category III shows marked differ- ences from the other studies. These differences could be because of the nature of the inventory being quite differ- ent in our setup as compared to the general tertiary care hospitals. There is a paucity of studies in the super-spe- cialty hospitals; therefore there is no way we could com- pare our results with the same. 6. CONCLUSIONS During the year 2008-2009, the inventory expenditure of the medical store of a tertiary care neuropsychiatric hospital at Delhi was Rs. 19219594.79. There is a need of application of scientific inventory management tools for effective and efficient management of the medical stores and close supervision on items belonging to im- portant categories. ABC-VED matrix analysis identifies the drugs requiring stringent control for optimal use of funds and avoid out-of-stock situations in the medical stores. Table 4. Comparison of various Indian studies with the present study. Category Govt Hospital Nagpur study AFMS studyCGHS studyGMCH, Goa studyPGI Chandigarh study Present study A 10.76 14.46 17.8 12.93 13.78 3.45 B 20.63 22.46 22.6 19.54 21.85 6.9 C 68.61 63.08 59.5 67.53 64.37 89.65 V 23.76 7.39 5.14 12.36 12.11 32.41 E 38.12 49.23 58.9 47.12 59.38 61.38 D 38.12 43.38 35.9 40.52 28.51 6.2 I 29.15 20.92 21.5 22.99 22.09 33.8 II 41.26 48.92 56.1 41.67 54.63 60 III 29.59 30.16 22.2 35.34 23.28 6.2 *All the values in this table are in percentages. The table has been adopted from Devnani et al, J Young Pharmacists 2010 with permission from the author and publisher. Copyright © 2013 SciRes. OPEN ACCESS 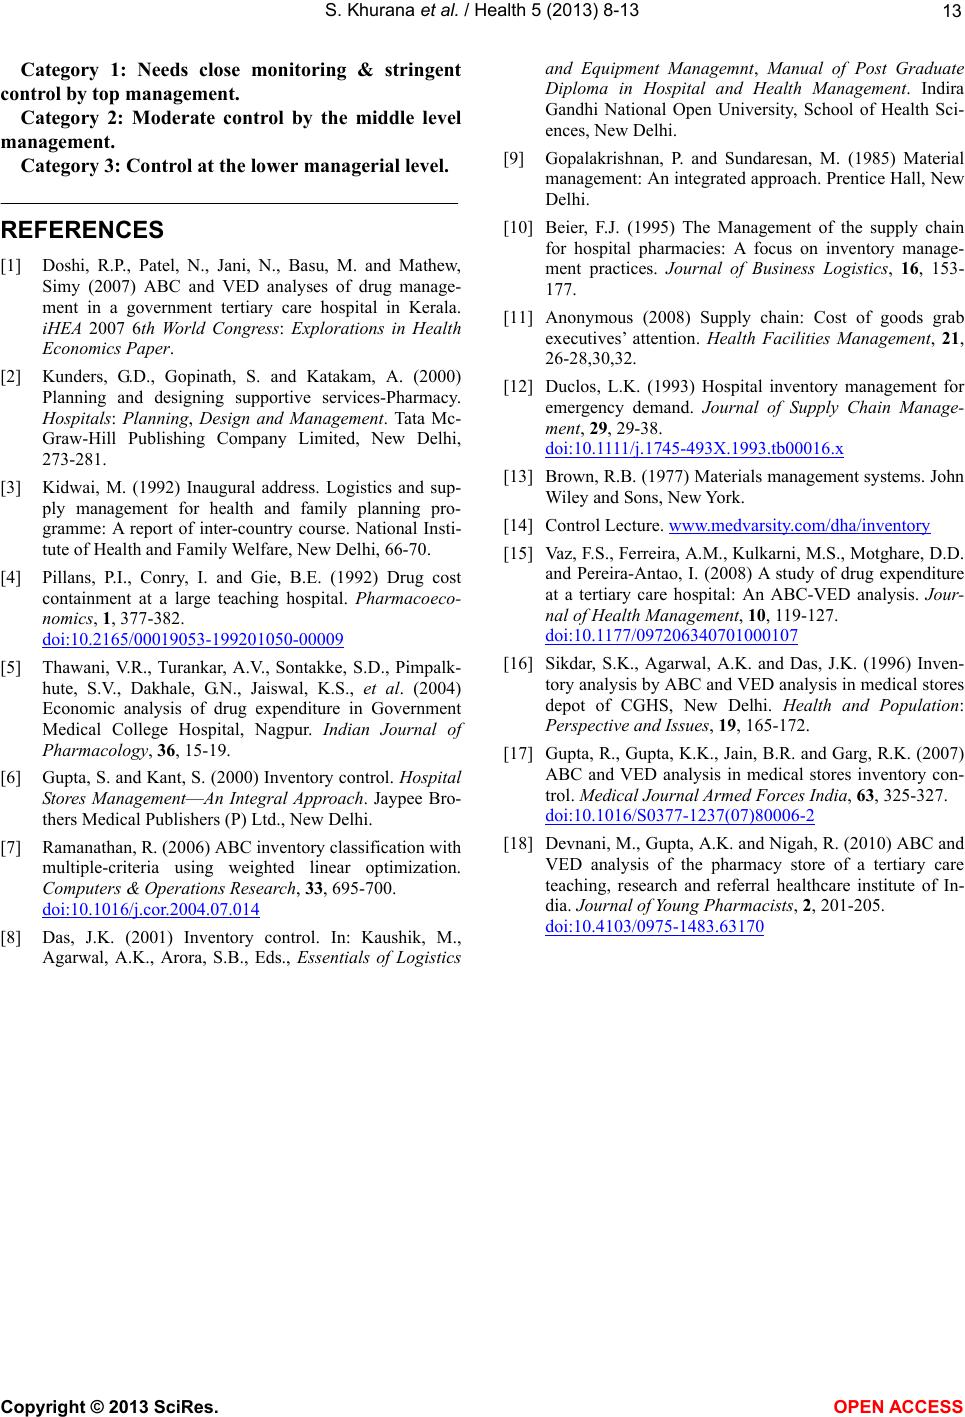 S. Khurana et al. / Health 5 (2013) 8-13 13 Category 1: Needs close monitoring & stringent control by top management. Category 2: Moderate control by the middle level management. Category 3: Control at the lower managerial level. REFERENCES [1] Doshi, R.P., Patel, N., Jani, N., Basu, M. and Mathew, Simy (2007) ABC and VED analyses of drug manage- ment in a government tertiary care hospital in Kerala. iHEA 2007 6th World Congress: Explorations in Health Economics Paper. [2] Kunders, G.D., Gopinath, S. and Katakam, A. (2000) Planning and designing supportive services-Pharmacy. Hospitals: Planning, Design and Management. Tata Mc- Graw-Hill Publishing Company Limited, New Delhi, 273-281. [3] Kidwai, M. (1992) Inaugural address. Logistics and sup- ply management for health and family planning pro- gramme: A report of inter-country course. National Insti- tute of Health and Family Welfare, New Delhi, 66-70. [4] Pillans, P.I., Conry, I. and Gie, B.E. (1992) Drug cost containment at a large teaching hospital. Pharmacoeco- nomics, 1, 377-382. doi:10.2165/00019053-199201050-00009 [5] Thawani, V.R., Turankar, A.V., Sontakke, S.D., Pimpalk- hute, S.V., Dakhale, G.N., Jaiswal, K.S., et al. (2004) Economic analysis of drug expenditure in Government Medical College Hospital, Nagpur. Indian Journal of Pharmacology, 36, 15-19. [6] Gupta, S. and Kant, S. (2000) Inventory control. Hospital Stores Management—An Integral Approach. Jaypee Bro- thers Medical Publishers (P) Ltd., New Delhi. [7] Ramanathan, R. (2006) ABC inventory classification with multiple-criteria using weighted linear optimization. Computers & Operations Research, 33, 695-700. doi:10.1016/j.cor.2004.07.014 [8] Das, J.K. (2001) Inventory control. In: Kaushik, M., Agarwal, A.K., Arora, S.B., Eds., Essentials of Logistics and Equipment Managemnt, Manual of Post Graduate Diploma in Hospital and Health Management. Indira Gandhi National Open University, School of Health Sci- ences, New Delhi. [9] Gopalakrishnan, P. and Sundaresan, M. (1985) Material management: An i ntegrated approach. Prentice Hall, New Delhi. [10] Beier, F.J. (1995) The Management of the supply chain for hospital pharmacies: A focus on inventory manage- ment practices. Journal of Business Logistics, 16, 153- 177. [11] Anonymous (2008) Supply chain: Cost of goods grab executives’ attention. Health Facilities Management, 21, 26-28,30,32. [12] Duclos, L.K. (1993) Hospital inventory management for emergency demand. Journal of Supply Chain Manage- ment, 29, 29-38. d oi: 10 .1111 /j .1 745 -493X.1993.tb00016.x [13] Brown, R.B. (1977) Materials management systems. John Wiley and Sons, New York. [14] Control Lecture. www.medvarsity.com/dha/inventory [15] Va z, F.S., Ferreira , A.M., Kulkarni , M.S., Motgha re, D.D. and Pereira-Antao, I. (2008) A study of drug expenditure at a tertiary care hospital: An ABC-VED analysis. Jour- nal of Health Management, 10, 119-127. doi:10.1177/097206340701000107 [16] Sikdar, S.K., Agarwal, A.K. and Das, J.K. (1996) Inven- tory analysis by ABC and VED analysis in medical stores depot of CGHS, New Delhi. Health and Population: Perspective and Issues, 19, 165-172. [17] Gupta, R., Gupta, K.K., Jain, B.R. and Garg, R.K. (2007) ABC and VED analysis in medical stores inventory con- trol. Medical Journal Armed Forces India, 63, 325-327. doi:10.1016/S0377-1237(07)80006-2 [18] Devnani, M., Gupta, A.K. and Nigah, R. (2010) ABC and VED analysis of the pharmacy store of a tertiary care teaching, research and referral healthcare institute of In- dia. Journal of Young Pharmacists, 2, 201-205. doi:10.4103/0975-1483.63170 Copyright © 2013 SciRes. OPEN ACCESS |