

Paper Menu >>
Journal Menu >>
 Psychology 2013. Vol.4, No.1, 33-37 Published Online January 2013 in SciRes (http://www.scirp.org/journal/psych) http://dx.doi.org/10.4236/psych.2013.41004 Copyright © 2013 SciRes. 33 Body Mass Index Does Not Affect Grooved Pegboard Performance in Healthy South African Adults Charles H. van Wijk Private Practice, Simon’s Town, South Africa Email: [email protected] Received October 26th, 2012; revised November 25th, 2012; accepted December 22nd, 2012 Obesity has been associated with poorer performance on the Grooved Pegboard (GP) among healthy older adults. The GP is widely used in South Africa, among others for the assessment of HIV Associated Neu- rocognitive Disorders. Obesity is growing among the younger adult population in South Africa, which is the group also most at risk for HIV. It is not clear what the interaction between body mass and GP per- formance would be among a group of healthy younger adults. This study investigated whether body mass might affect fine psychomotor skills. A sample of 850 healthy adults (20 - 49 years) completed the GP and had their Body Mass Index (BMI) calculated. The relationship between GP and BMI was examined using ANOVA and correlation coefficients. The expected gender differences in GP performance found elsewhere were demonstrated in this sample. No significant interactions between BMI categories and GP times were found, and no significant correlations between BMI continuous scores and GP times were found either. In spite of the presence of a wide weight spectrum among the participants and the absence of any history of known medical disease, the lack of significant BMI-GP interactions suggest that the effect of BMI may generally be discounted when interpreting GP results. Keywords: Body Mass Index; BMI; Gender Differences; Grooved Pegboard; Psychomotor Performance; HIV Introduction The Grooved Pegboard (GP) is a manipulative dexterity task that can be used for neuropsychological assessment (Lezak, Howieson, & Loring, 2004). The HIV epidemic has stimulated renewed interest in the GP because of its potential to identify HIV associated neurocognitive disorders (HAND). It is a com- mon neuropsychological instrument used in HAND (Grant, 2008), which can differentiate between the HIV statuses of asymptomatic patients in Sub-Saharan Africa (Moshani, 2009; Sacktor et al., 2005). In particular the GP non-dominant hand score is sensitive for HIV-associated neuropsychological im- pairment (Carey et al., 2004; Davis, Skolasky, Selnes, Burgess, & McArthur, 2002), and the GP non-dominant hand test has been established to detect signs of HIV dementia (cf. Sacktor et al., 2005). Completion time has been related to stage of HIV disease (Heaton, Grant, Butters, White, Kirson, & Atkinson, 1995), while declining times have been linked to future pro- gression to HIV dementia (Selnes, Galai, McArthur, & Cohen, 1997). The GP is also sensitive to improvement in neuropsy- chological performance in HIV+ individuals receiving HAART (Joska, Gouse, Paul, Stein, & Flisher, 2010). A large percentage of asymptomatic HIV infected persons show mild neurocognitive difficulties (Heaton et al., 1995), and recent South African (SA) figures indicated that 17% - 23.5% of HIV patients display cognitive impairment (Ganasen, Fin- cham, Smit, Seedat, & Stein, 2008; Joska et al., 2010). HIV prevalence for SA adults (15 - 49) was estimated at 16.9% in 2008. SA is home to the world’s largest population of people living with HIV (5.7 million) (UNAIDS, 2009). To meaningfully use the GP non-dominant hand test to screen for HAND, performance of HIV individuals need to be compared to age and education adjusted peer means (Sactor et al., 2005). There are many factors that could influence GP per- formance in healthy adults. Obesity is one example of this, and is a growing concern for SA healthcare. SA studies found that between 24% and 27% of women are overweight, with a further 30% to 54% obese, while figures for men indicate that between 15% and 22% are overweight, with a further 7% to 19% obese (Malhotra et al., 2008; Puoane et al., 2002). Recent studies indicate that obesity seems to start at an increasingly young age, with about 10% of women obese by the age of 24 years (Puoane et al., 2002, Reddy, Panday, Swart, Jinabhai, Amosun, & James, 2003). Body Mass Index (BMI) is calculated from a person’s weight and height, and is an effective method for population assess- ment of overweight and obesity (Centers for Disease Control and Prevention, 2010). Its main importance lies in the relation- ship between body weight and disease and death (World Health Organisation, 1995), with overweight and obese individuals at increased risk for many diseases and health conditions (Na- tional Institutes of Health, 1998). The negative health cones- quences associated with increased BMI in SA have been well described (Joubert, Norman, Bradshaw, Goedecke, Steyn, & Puoane, 2007). BMI serves two functions, firstly, to indicate risk for various diseases, and secondly as a general indication of body fatness. Obesity has been associated with poorer cognitive function in several studies (Elias, Elias, Sullivan, Wolf, & D’Agostino, 2003, 2005; Kilander, Nyman, Boberg, & Lithell, 1997; Wald- stein & Katzel, 2006). Obesity is associated with lower memory and executive function in late middle-aged and elderly men (but  C. H. VAN WIJK not women), independent of other common cardiovascular dis- ease (CVD) risk factors (Elias et al., 2003, 2005), and further related to diminished performance on tests of motor speed and manual dexterity, independent of other components of the metabolic syndrome and several other potential confounding factors, among healthy older adults (Waldstein & Katzel, 2006). Interactions between BMI and Grooved Pegboard (GP) scores in older adults were significant, with individuals with greater BMI performing most poorly on the GP (Waldstein & Katzel, 2006). The mechanism for this is not well understood. Waldstein & Katzel (2006) hypothesised that central obesity has been asso- ciated with various neuroendocrine disturbances (Bjorntorp & Rosmond, 2000) that have also been associated with enhanced sympathetic nervous system activity (Bjorntorp & Rosmond, 2000; Ren, 2004) and that may promote structural brain abnor- malities including silent cerebrovascular disease and stroke (Everson, Lynch, Kaplan, Lakka, Sivenius, & Salonen, 2001; Waldstein, Siegel, Lefkowitz, Maier, Pelletier-Brown, & Obu- chowski, 2004). Obesity has also been associated with en- hanced pro-inflammatory factors (Toni, Malaguti, Castorina, Roti, & Lechan, 2004), which have been shown to exert nega- tive effects on cognitive function (Yaffe, Lindquist, Penninx, Simonsick, Pahor, & Kritchevsky, 2003). With the interaction of BMI and neurocognitive performance in healthy older adults established, it is not clear whether the same patterns will hold for healthy younger adults. It could be hypothesised that shorter exposure to the neurotoxic effects of CVD factors, hormonal abnormalities, or inflammatory factors may leave younger brains less affected by the disease related aspects of obesity. However, in an environment of reduced neurotoxic risk (i.e. youth), BMI might still influence GP per- formance through, for example, clumsy fingers, and thus con- found the results of this psychomotor task. In SA the effect of BMI on GP performance is of interest because of its potential to identify HAND. The demographic curve of HIV is skewed towards younger people, creating a younger risk group for HAND, which is the same demographic group increasingly at risk for obesity. While obesity is not usu- ally associated with HIV positive status, it is widespread within the general population. Thus, in order to use the GP non- dominant hand test with HIV positive persons, the effect of BMI on GP performance among healthy individuals needs to be clarified first, in order to determine the usefulness of peer norms. If BMI does affect GP performance, accurate peer norms for HIV positive persons may need to control for the confounding effects of BMI. This study thus set out to explore whether excessive body mass might affect fine motor skills, in particular GP perform- ance, among healthy younger adults. This could potentially have implications for the interpretation of neuropsychological scores, in particular for the screening of HIV associated neuro- cognitive decline. Methods Sample This study used a convenience sample, recruiting participants through an occupational health surveillance program. This al- lowed for the measurement of BMI without inconveniencing participants. Individuals were excluded from the study if they had a history of neurological, psychiatric or cardio-vascular disorders, were HIV positive, had any physical impediments that could affect motor performance, or were not adequately proficient in English to understand the GP instructions or an- swer the health questionnaire. Due to the recruitment channel, all participants were employed at the time. As the general HIV prevalence figures are available for the ages up to 49, the same maximum age limit was used for this study. In SA, both BMI profiles (Malhotra et al., 2008) and GP performance (Van Wijk, 2012) differs across gender, and women completed the GP faster than men. Further, the associa- tion of BMI and GP performance also differed along gender lines among older people, and it was thus decided to treat the data for women and men separately. Eight hundred and fifty volunteers between the ages of 20 and 49 years (mean age = 32 ± 8) completed the GP on an indi- vidual basis. All participants had at least 8 years of formal edu- cation (mean years = 12 ± 1). The sample comprised 307 women (36.1%) and 543 men (63.9%), and was drawn from all SA language groups and provinces of origin. The female group had a mean age of 28 years (±7), and a mean of 12 years (±1) of education. Of the women, 67% were between 19 and 29 years, 27% were between 30 and 39 years, and 6% were between 40 and 49 years, while 61% were Black, 20% were Coloured, 3% were Indian, and 16% were White. The male group had a mean age of 35 years (±8), and a mean of 12 (±1) years of education. Of the men, 33% were between 19 and 29 years, 36% were between 30 and 39 years, and 31% were between 40 and 49 years, while 41% were Black, 33% were Coloured, 5% were Indian, and 21% were White. The women were significantly younger than the men (p < 0.01). Instruments 1) Grooved Pegboard. The GP is a manipulative dexterity test (Lafayette Instrument Company, 1989), which measures psychomotor speed, fine motor control, and rapid visual-motor coordination (Mitrushina, Boone, Razan, & D’Elia, 2005). Performance is highly dependent on psychomotor speed (Lezak et al., 2004). Scores represe nt time in seconds required to com- plete the matrix with each hand, with higher scores reflecting a lower level of performance. The non-dominant hand is often considered more sensitive for psychomotor slowing. The task was administered according to the standard instruction set, as described in the manual (Lafayette Instrument Company, 1989). One trial each was allowed with first the dominant hand (GPd), and then the non-dominant hand (GPn). 2) Anthropometric measurement. Participants were measured while wearing light clothes without shoes or jackets. Measure- ments were done on a Secca scale, and took place under the supervision of a dietician. The scale’s automatic BMI calcula- tion feature was used; height had to be entered manually, and was rounded to the nearest centimetre for this purpose. BMI was computed as weight (in kilograms) divided by the square of the height (in meters). The following WHO (1995) categories were used: underweight (BMI < 18.5), healthy weight (BMI 18.5 to 24.9), overweight (BMI 25.0 to 29.9), and obese (BMI > 30). 3) Health questionnaire. Participants completed a self-report health questionnaire, developed for this study, inquiring about neurological or psychiatric history, and history of cardiovascu- lar disease. Copyright © 2013 SciRes. 34 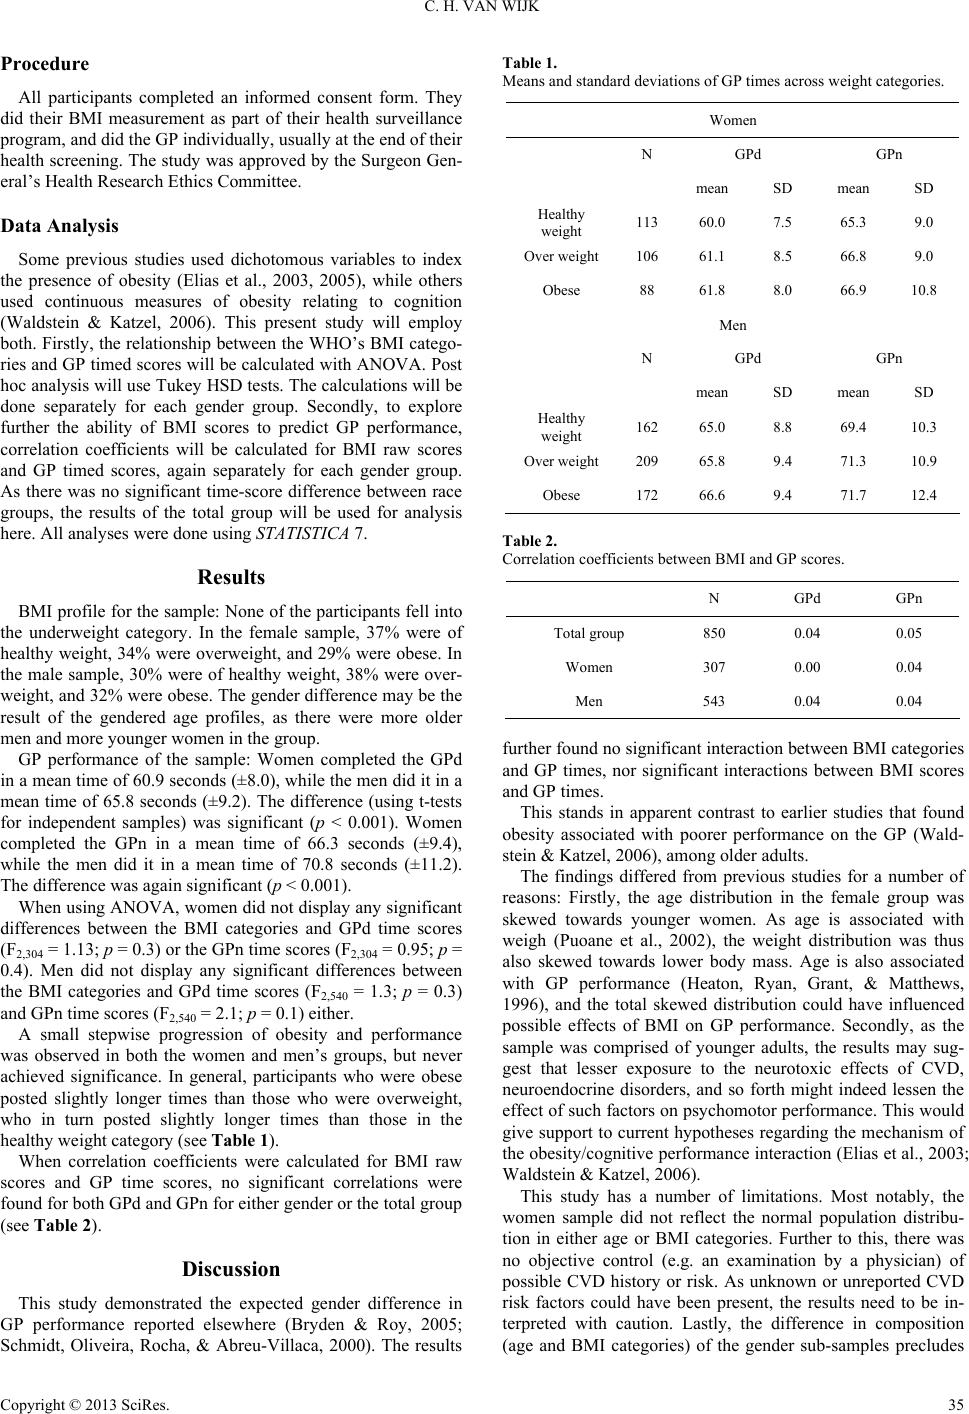 C. H. VAN WIJK Procedure All participants completed an informed consent form. They did their BMI measurement as part of their health surveillance program, and did the GP individually, usually at the end of their health screening. The study was approved by the Surgeon Gen- eral’s Health Research Ethics Committee. Data Analysis Some previous studies used dichotomous variables to index the presence of obesity (Elias et al., 2003, 2005), while others used continuous measures of obesity relating to cognition (Waldstein & Katzel, 2006). This present study will employ both. Firstly, the relationship between the WHO’s BMI catego- ries and GP timed scores will be calculated with ANOVA. Post hoc analysis will use Tukey HSD tests. The calculations will be done separately for each gender group. Secondly, to explore further the ability of BMI scores to predict GP performance, correlation coefficients will be calculated for BMI raw scores and GP timed scores, again separately for each gender group. As there was no significant time-score difference between race groups, the results of the total group will be used for analysis here. All analyses were done using STATISTICA 7. Results BMI profile for the sample: None of the participants fell into the underweight category. In the female sample, 37% were of healthy weight, 34% were overweight, and 29% were obese. In the male sample, 30% were of healthy weight, 38% were over- weight, and 32% were obese. The gender difference may be the result of the gendered age profiles, as there were more older men and more younger women in the group. GP performance of the sample: Women completed the GPd in a mean time of 60.9 seconds (±8.0), while the men did it in a mean time of 65.8 seconds (±9.2). The difference (using t-tests for independent samples) was significant (p < 0.001). Women completed the GPn in a mean time of 66.3 seconds (±9.4), while the men did it in a mean time of 70.8 seconds (±11.2). The difference was again significant (p < 0.001). When using ANOVA, women did not display any significant differences between the BMI categories and GPd time scores (F2,304 = 1.13; p = 0.3) or the GPn time scores (F2,304 = 0.95; p = 0.4). Men did not display any significant differences between the BMI categories and GPd time scores (F2,540 = 1.3; p = 0.3) and GPn time scores (F2,540 = 2.1; p = 0.1) either. A small stepwise progression of obesity and performance was observed in both the women and men’s groups, but never achieved significance. In general, participants who were obese posted slightly longer times than those who were overweight, who in turn posted slightly longer times than those in the healthy weight category (see Table 1). When correlation coefficients were calculated for BMI raw scores and GP time scores, no significant correlations were found for both GPd and GPn for either gender or the total group (see Table 2). Discussion This study demonstrated the expected gender difference in GP performance reported elsewhere (Bryden & Roy, 2005; Schmidt, Oliveira, Rocha, & Abreu-Villaca, 2000). The results Table 1. Means and standard deviations o f GP times across weight categories. Women N GPd GPn mean SD mean SD Healthy weight 113 60.0 7.5 65.3 9.0 Over weight 106 61.1 8.5 66.8 9.0 Obese 88 61.8 8.0 66.9 10.8 Men N GPd GPn mean SD mean SD Healthy weight 162 65.0 8.8 69.4 10.3 Over weight 209 65.8 9.4 71.3 10.9 Obese 172 66.6 9.4 71.7 12.4 Table 2. Correlation coefficients between BMI and GP scores. N GPd GPn Total group 850 0.04 0.05 Women 307 0.00 0.04 Men 543 0.04 0.04 further found no significant interaction between BMI categories and GP times, nor significant interactions between BMI scores and GP times. This stands in apparent contrast to earlier studies that found obesity associated with poorer performance on the GP (Wald- stein & Katzel, 2006), among older adults. The findings differed from previous studies for a number of reasons: Firstly, the age distribution in the female group was skewed towards younger women. As age is associated with weigh (Puoane et al., 2002), the weight distribution was thus also skewed towards lower body mass. Age is also associated with GP performance (Heaton, Ryan, Grant, & Matthews, 1996), and the total skewed distribution could have influenced possible effects of BMI on GP performance. Secondly, as the sample was comprised of younger adults, the results may sug- gest that lesser exposure to the neurotoxic effects of CVD, neuroendocrine disorders, and so forth might indeed lessen the effect of such factors on psychomotor performance. This would give support to current hypotheses regarding the mechanism of the obesity/cognitive performance interaction (Elias et al., 2003; Waldstein & Katzel, 2006). This study has a number of limitations. Most notably, the women sample did not reflect the normal population distribu- tion in either age or BMI categories. Further to this, there was no objective control (e.g. an examination by a physician) of possible CVD history or risk. As unknown or unreported CVD risk factors could have been present, the results need to be in- terpreted with caution. Lastly, the difference in composition (age and BMI categories) of the gender sub-samples precludes Copyright © 2013 SciRes. 35  C. H. VAN WIJK direct comparisons of women and men’s results. Future studies need to include participants that are more re- flective of the general population distribution (with regard to age, gender, employment status, education, and so forth), as well as external (vs self-reported) controls for medical and lifestyle risk factors (e.g. hypertension, diabetes, exercise and nutrition). To conclude: in the presence of a wide weight spectrum among the participants, and the absence of history of known medical risk factors, the lack of significant BMI-GP interaction suggests that there is no real evidence of body mass signifi- cantly affecting GP performance among younger adults. Slowed performance on the GP (in the presence of elevated body mass) would thus probably be due to neurological disease processes, rather than body fat percentage. Thus, the effect of BMI may generally be discounted when interpreting GP results until further corroboration of the inter- action has been reported. Acknowledgements I wish to acknowledge Chesray Hans-Arendse, Sadia Edross, Marilize Willers and Ruby Muller who assisted in the admini- stration of the GP, and Aileen van der Spuy who did the BMI measurements. REFERENCES Bjorntorp, P., & Rosmond, R. (2000). Neuroendocrine abnormalities in visceral obesity. International Journal of Obesity Related Metabolic Disorders, 24, S80-S85. doi:10.1038/sj.ijo.0801285 Bryden, P. J., & Roy, E. A. (2005). A new method of administering the grooved pegboard test: Performance as a function of handedness and sex. Brain and Cognition, 58, 258-268. doi:10.1016/j.bandc.2004.12.004 Carey, C. L., Woo ds, S. P., Rippeth, J. D., Gonzalez, R ., Moore, D. J., Marcotte, T. D. et al. (2004). Initial validation of a screening battery for the detection of HIV-associated cognitive impairment. Clinical Neuropsychology, 18, 234-248. doi:10.1080/13854040490501448 Centers for Disease Control and Prevention (2010). About BMI for adults. URL (last checked 12 October 20 12 ). http://www.cdc.gov/healthyweight/assessing/bmi/adult_BMI/index.h tml Davis, H. F., Skolasky, R. L., Selnes, O. A., Burgess, D. M., & McArthur, J. C. (2002). Assessing HIV-associated dementia: Modi- fied HIV dementia scale versus the grooved pegboard. The AIDS Reader, 12, 29-38. Elias, M. F., Elias, P. K., Sullivan, L. M., Wolf, P. A., & D’Agostino, R. B. (2003). Lower cognitive function in the presence of obesity and hypertension: The Framingham heart study. International Journal of Obesity, 27, 260-268. doi:10.1038/sj.ijo.802225 Elias, M. F., Elias, P. K., Sullivan, L. M., Wolf, P. A., & D’Agostino, R. B. (2005). Obesity, diabetes and cognitive deficit: The Framingham heart study. Neurobiology of Aging, 26, S11-S16. doi:10.1016/j.neurobiolaging.2005.08.019 Everson, S. A., Lynch, J. W., Kaplan, G. A., Lakka, T. A., Sivenius, J., & Salonen, J. (2001). Stress-induced blood pressure reactivity and incident stroke in middle-aged men. Stroke, 32, 1263-1270. doi:10.1161/01.STR.32.6.1263 Ganasen, K. A., Fincham, D., Smit, J., Seedat, S., & Stein, D. (2008). Utility of the HIV dementia scale (HDS) in identifying HIV demen- tia in a South African sample. Journal of the Neurological Sciences, 269, 62-64. doi:10.1016/j.jns.2007.12.027 Grant, I. (2008). Neurocognitive disturbances in HIV. International Review of Psychiatry, 20, 33-47. doi:10.1080/09540260701877894 Heaton, R. K., Grant, I., Butters, N., White, D. A., Kirson, D., & At- kinson, J. H. (1995). The HNRC 500: Neuropsychology of HIV in- fection at different disease stages. Journal of the International Neuropsychological Socie ty , 1, 231-251. doi:10.1017/S1355617700000230 Heaton, R. K., Ryan, L., Grant, I., & Matthews, C. G. (1996). Demo- graphic influences on neuropsychological test performance. In I. Grant, & K. M. Adams (Eds.), Neuropsychological assessment of neuropsychiatric disorders (2nd ed., pp. 141-163). New York: Ox- ford University Press. Joska, J. A., Gouse, H., Paul, R. H., Stein, D. J., & Flisher, A. J. (2010). Does highly active antiretroviral therapy improve neurocognitive function? A systematic review. Neurovirology, 16, 101-114. doi:10.3109/13550281003682513 Joubert, J., Norman, R., Bradshaw, D., Goedecke, J. H., Steyn, N. P., & Puoane, T. (2007). Estimating the burden of disease attributable to excess body weight in South Africa in 2000. South African Medical Journal, 97, 683-690. Kilander, L., Nyman, H., Boberg, M., & Lithell, H. (1997). Cognitive function, vascular risk factors and education: A cross-sectional study based on a cohort of 70-year-old men. Journal of Internal Medicine, 242, 313-321. doi:10.1046/j.1365-2796.1997.00196.x Lafayette Instrument Company (1989). Grooved Pegboard: Owner’s Manual. Lafayette, IN: Lafayette Instrument Company. Lezak, M. D., Howieson, D. B., & Loring, D. W. (2004). Neuropsy- chological Assessm ent (4th ed.). New York: Oxford University Press. Malhotra, R., H oyo , C., Østbye, T., Hughes, G., Schwartz, D., Tsolekile, L. et al. (2008). Determinants of obesity in an urban township of South Africa. South African Journal of Clinical Nutrition, 21, 315- 320. Mitrushina, M. N., Boone, K. B., Razan, J., & D’Elia, L. F. (2005). Handbook of normative data for neuropsyc ho l ogical assessment (2nd ed.). New York: Oxford University Press. Moshani, M. L. (2009). The exploration of neuropsychological disor- ders in HAART-naïve young adults in South Africa. Unpublished Honours Thesis, Cape Town: University of Cape Town. URL (last checked 12 October 2012). http://web.uct.ac.za/depts/psychology/postgraduate/Hons2009Project s/Nomakhawuta.Moshani.pdf National Institutes of Health (1998). Clinical guidelines on the identifi- cation, evaluation, and treatment of overweight and obesity in adults. URL (last checked 12 October 2012) . http://www.nhlbi.nih.gov/guidelines/obesity/ob_home.htm Puoane, T., Steyn, K., Bradshaw, D., Lau bsch er, R., Fou rie, J., La mbert, V. et al. (2002). Obesity in South Africa: The South African demo- graphic and health survey. Obesity Research, 10, 1038-1048. doi:10.1038/oby.2002.141 Reddy, S. P., Panday, S., Swart, D., Jinabhai, C. C., Amosun, S. L., & James, S. (2003). Umthenthe uhlaba usamila—The South African youth risk behaviour survey 2002. Cape Town: South African Medi- cal Research Council. URL (last checked 12 O c t ob e r 2012). http://www.mrc.ac.za/healthpromotion/reports.htm Ren, J. (2004). Leptin and hyperleptinemia: From friend to foe for cardiovascular function. Journal of Endocrinology, 18, 1-10. doi:10.1677/joe.0.1810001 Sacktor, N. C., Wong, M., Nakasujja, N., Skolaskya, R. L., Selnes, O. A., Musisi. S. et al. (2005). The international HIV dementia scale: A new rapid screening test for HIV d ementia. AIDS, 19, 1367-1374. Schmidt, S. L., Oliveira, R. M., Rocha, F. R., & Abreu-Villaca, Y. (2000). Influences of handedness and gender on the grooved peg- board test. Brain a nd Co gn it ion, 44, 445-454. doi:10.1006/brcg.1999.1204 Selnes, O. A., Galai, N., McArthur, J. C., & Cohen, S. (1997). HIV infection and cognition in intravenous drug users: Longterm follow- up. Neurology, 48, 223-230. doi:10.1212/WNL.48.1.223 Toni, R., Malaguti, A., Castorina, S., Roti, E., & Lechan, R. M. (2004). New paradigms in neuroendocrinology: Relationships between obe- sity, systemic inflammation and the neuroendocrine system. Journal of Endocrinologic al Investigation, 27, 182-186. UNAIDS (2009). AIDS epidemic update: November 2009. Geneva: World Health Organisation. Van Wijk, C. H. (2012). Self-reported generalised anxiety and psy- chomotor test performance in healthy South Africans. South African Copyright © 2013 SciRes. 36  C. H. VAN WIJK Copyright © 2013 SciRes. 37 Journal of Psychology, 42, 7-14. Waldstein, S. R., & Katzel, L. I. (2006). Interactive relations of central versus total obesity and blood pressure to cognitive function. Inter- national Journal of Obesity, 30, 201-207. doi:10.1038/sj.ijo.0803114 Waldstein, S. R., Siegel, E. L., Lefkowitz, D., Maier, K. J., Pelletier- Brown, J. R., & Obuchowski, A. M. (2004). Stress-induced blood pressure reactivity and silent cerebrovascular disease. Stroke, 35, 1294-1298. doi:10.1161/01.STR.0000127774.43890.5b World Health Organization (1995). Physical status: The use and inter- pretation of anthropometry. WHO Technical Report Series. Geneva: World Health Organization. Yaffe, K., Lindquist, K., Penninx, B., Simonsick, E., Pahor, M., & Kritchevsky, S. (2003). Inflammatory markers and cognition in well- functioning African-American and white elders. Neurology, 61, 76- 80. doi:10.1212/01.WNL.0000073620.42047.D7 |