

Paper Menu >>
Journal Menu >>
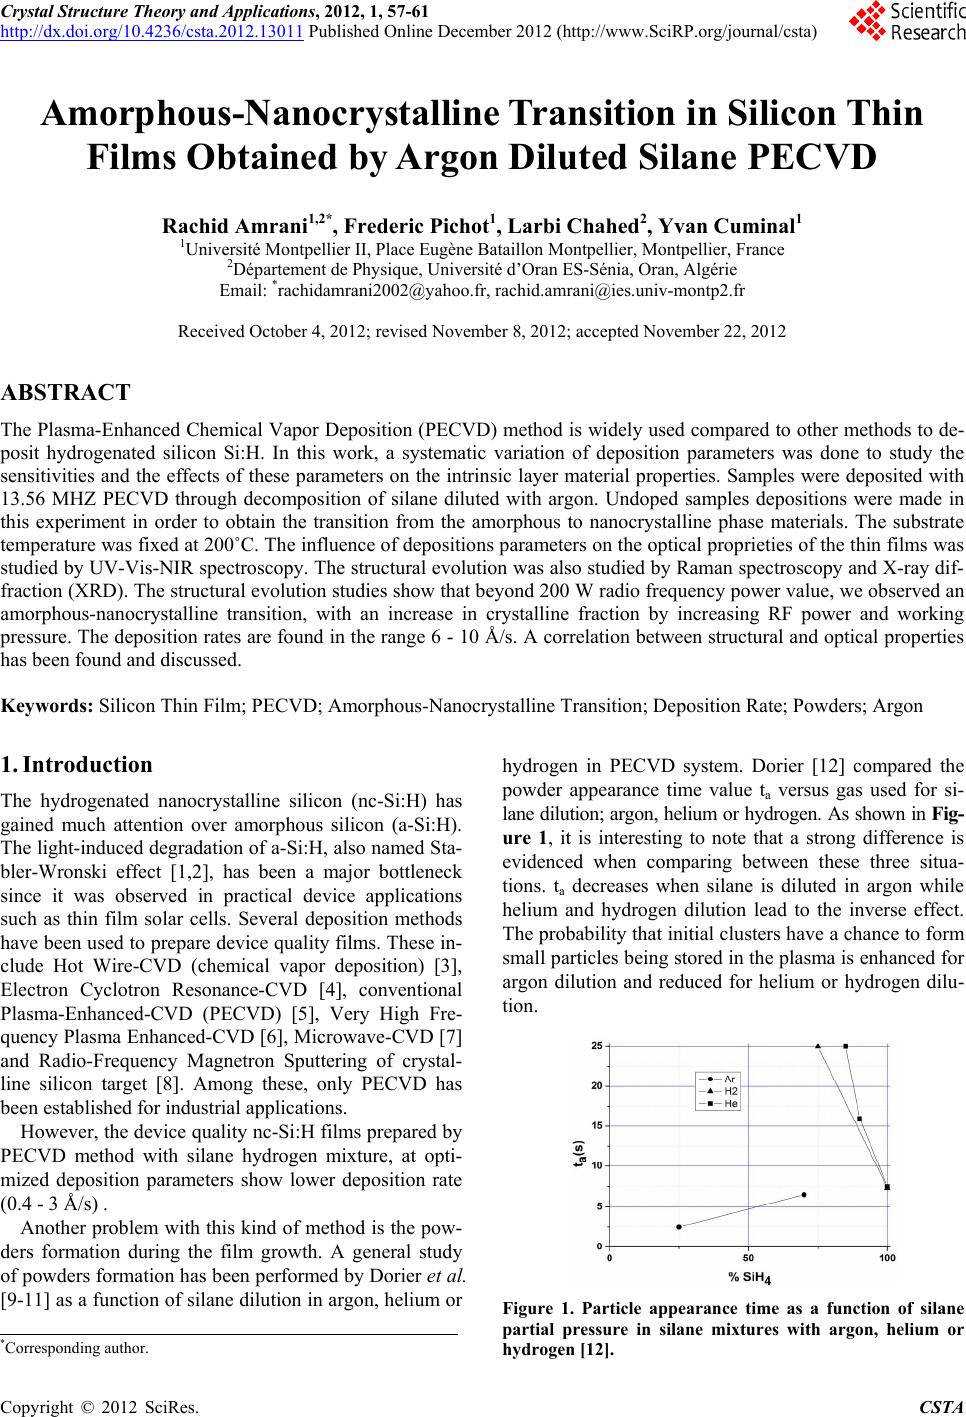 Crystal Structure Theory and Applications, 2012, 1, 57-61 http://dx.doi.org/10.4236/csta.2012.13011 Published Online December 2012 (http://www.SciRP.org/journal/csta) Amorphous-Nanocrystalline Transition in Silicon Thin Films Obtained by Argon Diluted Silane PECVD Rachid Amrani1,2*, Frederic Pichot1, Larbi Chahed2, Yvan Cuminal1 1Université Montpellier II, Place Eugène Bataillon Montpellier, Montpellier, France 2Département de Physique, Université d’Oran ES-Sénia, Oran, Algérie Email: *[email protected], [email protected] Received October 4, 2012; revised November 8, 2012; accepted November 22, 2012 ABSTRACT The Plasma-Enhanced Chemical Vapor Deposition (PECVD) method is widely used compared to other methods to de- posit hydrogenated silicon Si:H. In this work, a systematic variation of deposition parameters was done to study the sensitivities and the effects of these parameters on the intrinsic layer material properties. Samples were deposited with 13.56 MHZ PECVD through decomposition of silane diluted with argon. Undoped samples depositions were made in this experiment in order to obtain the transition from the amorphous to nanocrystalline phase materials. The substrate temperature was fixed at 200˚C. The influence of depositions parameters on the optical proprieties of the thin films was studied by UV-Vis-NIR spectroscopy. The structural evolution was also studied by Raman spectroscopy and X-ray dif- fraction (XRD). The structural evolution studies show that beyond 200 W radio frequency power value, we observed an amorphous-nanocrystalline transition, with an increase in crystalline fraction by increasing RF power and working pressure. The deposition rates are found in the range 6 - 10 Å/s. A correlation between structural and optical properties has been found and discussed. Keywords: Silicon Thin Film; PECVD; Amorphous-Nanocrystalline Transition; Deposition Rate; Powders; Argon 1. Introduction The hydrogenated nanocrystalline silicon (nc-Si:H) has gained much attention over amorphous silicon (a-Si:H). The light-induced degradation of a-Si:H, also named Sta- bler-Wronski effect [1,2], has been a major bottleneck since it was observed in practical device applications such as thin film solar cells. Several deposition methods have been used to prepare device quality films. These in- clude Hot Wire-CVD (chemical vapor deposition) [3], Electron Cyclotron Resonance-CVD [4], conventional Plasma-Enhanced-CVD (PECVD) [5], Very High Fre- quency Plasma Enhanced-CVD [6], Microwave-CVD [7] and Radio-Frequency Magnetron Sputtering of crystal- line silicon target [8]. Among these, only PECVD has been established for industrial applications. However, the device quality nc-Si:H films prepared by PECVD method with silane hydrogen mixture, at opti- mized deposition parameters show lower deposition rate (0.4 - 3 Å/s) . Another problem with this kind of method is the pow- ders formation during the film growth. A general study of powders formation has been performed by Dorier et al. [9-11] as a function of silane dilution in argon, helium or hydrogen in PECVD system. Dorier [12] compared the powder appearance time value ta versus gas used for si- lane dilution; argon, helium or hydrogen. As shown in Fig- ure 1, it is interesting to note that a strong difference is evidenced when comparing between these three situa- tions. ta decreases when silane is diluted in argon while helium and hydrogen dilution lead to the inverse effect. The probability that initial clusters have a chance to form small particles being stored in the plasma is enhanced for argon dilution and reduced for helium or hydrogen dilu- tion. Figure 1. Particle appearance time as a function of silane partial pressure in silane mixtures with argon, helium or hydrogen [12]. *Corresponding author. C opyright © 2012 SciRes. CSTA 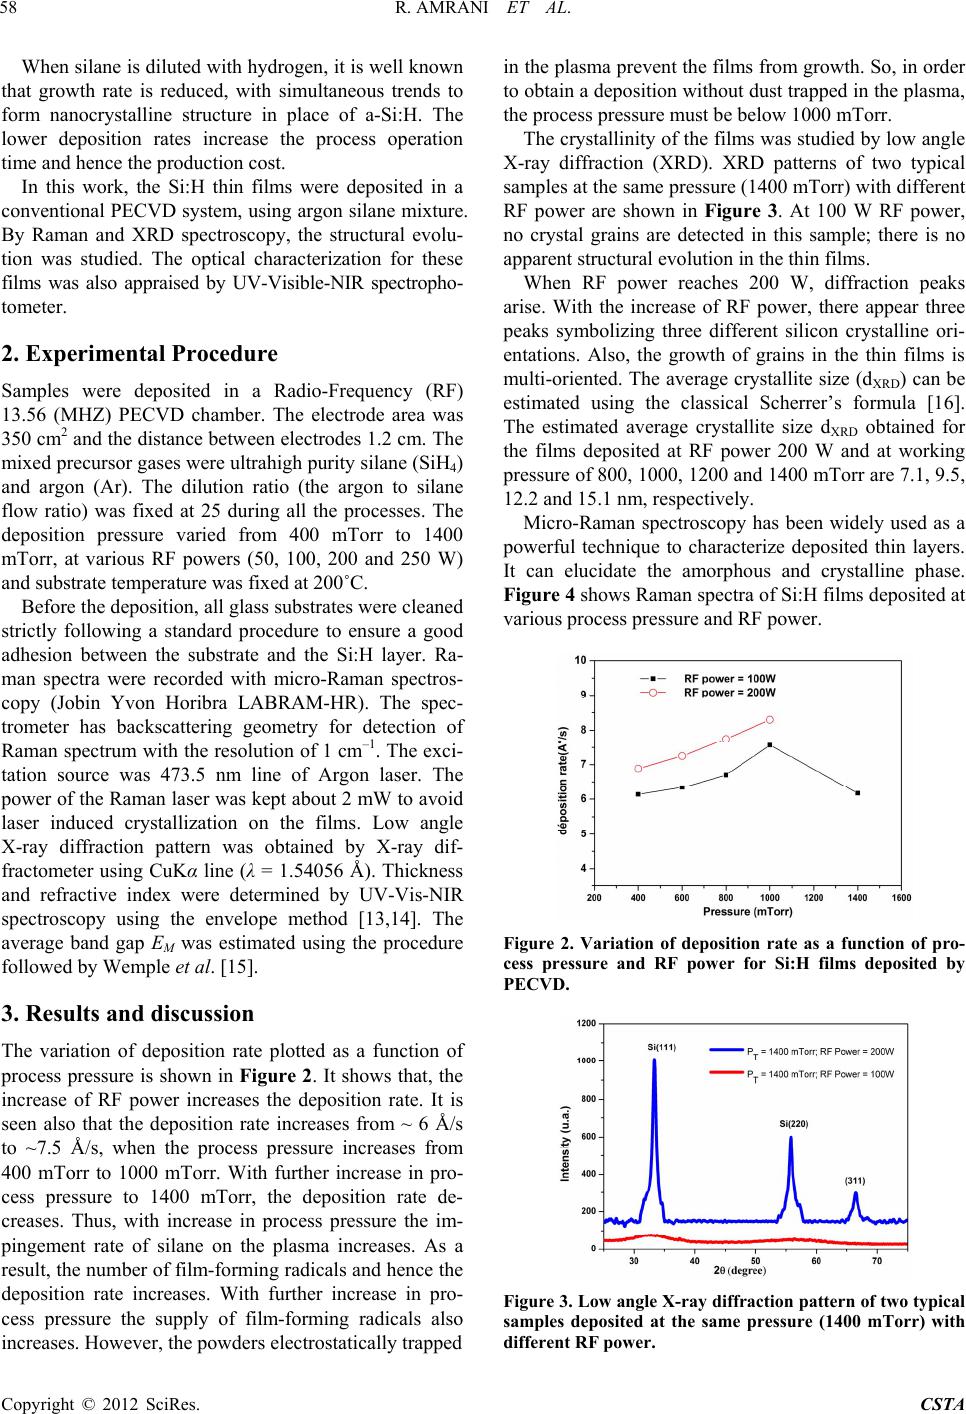 R. AMRANI ET AL. 58 When silane is diluted with hydrogen, it is well known that growth rate is reduced, with simultaneous trends to form nanocrystalline structure in place of a-Si:H. The lower deposition rates increase the process operation time and hence the production cost. In this work, the Si:H thin films were deposited in a conventional PECVD system, using argon silane mixture. By Raman and XRD spectroscopy, the structural evolu- tion was studied. The optical characterization for these films was also appraised by UV-Visible-NIR spectropho- tometer. 2. Experimental Procedure Samples were deposited in a Radio-Frequency (RF) 13.56 (MHZ) PECVD chamber. The electrode area was 350 cm2 and the distance between electrodes 1.2 cm. The mixed precursor gases were ultrahigh purity silane (SiH4) and argon (Ar). The dilution ratio (the argon to silane flow ratio) was fixed at 25 during all the processes. The deposition pressure varied from 400 mTorr to 1400 mTorr, at various RF powers (50, 100, 200 and 250 W) and substrate temperature was fixed at 200˚C. Before the deposition, all glass substrates were cleaned strictly following a standard procedure to ensure a good adhesion between the substrate and the Si:H layer. Ra- man spectra were recorded with micro-Raman spectros- copy (Jobin Yvon Horibra LABRAM-HR). The spec- trometer has backscattering geometry for detection of Raman spectrum with the resolution of 1 cm–1. The exci- tation source was 473.5 nm line of Argon laser. The power of the Raman laser was kept about 2 mW to avoid laser induced crystallization on the films. Low angle X-ray diffraction pattern was obtained by X-ray dif- fractometer using CuKα line (λ = 1.54056 Å). Thickness and refractive index were determined by UV-Vis-NIR spectroscopy using the envelope method [13,14]. The average band gap EM was estimated using the procedure followed by Wemple et al. [15]. 3. Results and discussion The variation of deposition rate plotted as a function of process pressure is shown in Figure 2 . It shows that, the increase of RF power increases the deposition rate. It is seen also that the deposition rate increases from ~ 6 Å/s to ~7.5 Å/s, when the process pressure increases from 400 mTorr to 1000 mTorr. With further increase in pro- cess pressure to 1400 mTorr, the deposition rate de- creases. Thus, with increase in process pressure the im- pingement rate of silane on the plasma increases. As a result, the number of film-forming radicals and hence the deposition rate increases. With further increase in pro- cess pressure the supply of film-forming radicals also increases. However, the powders electrostatically trapped in the plasma prevent the films from growth. So, in order to obtain a deposition without dust trapped in the plasma, the process pressure must be below 1000 mTorr. The crystallinity of the films was studied by low angle X-ray diffraction (XRD). XRD patterns of two typical samples at the same pressure (1400 mTorr) with different RF power are shown in Figure 3. At 100 W RF power, no crystal grains are detected in this sample; there is no apparent structural evolution in the thin films. When RF power reaches 200 W, diffraction peaks arise. With the increase of RF power, there appear three peaks symbolizing three different silicon crystalline ori- entations. Also, the growth of grains in the thin films is multi-oriented. The average crystallite size (dXRD) can be estimated using the classical Scherrer’s formula [16]. The estimated average crystallite size dXRD obtained for the films deposited at RF power 200 W and at working pressure of 800, 1000, 1200 and 1400 mTorr are 7.1, 9.5, 12.2 and 15.1 nm, respectively. Micro-Raman spectroscopy has been widely used as a powerful technique to characterize deposited thin layers. It can elucidate the amorphous and crystalline phase. Figure 4 shows Raman spectra of Si:H films deposited at various process pressure and RF power. Figure 2. Variation of deposition rate as a function of pro- cess pressure and RF power for Si:H films deposited by PECVD. Figure 3. Low angle X-ray diffraction pattern of two typical samples deposited at the same pressure (1400 mTorr) with different RF power. Copyright © 2012 SciRes. CSTA 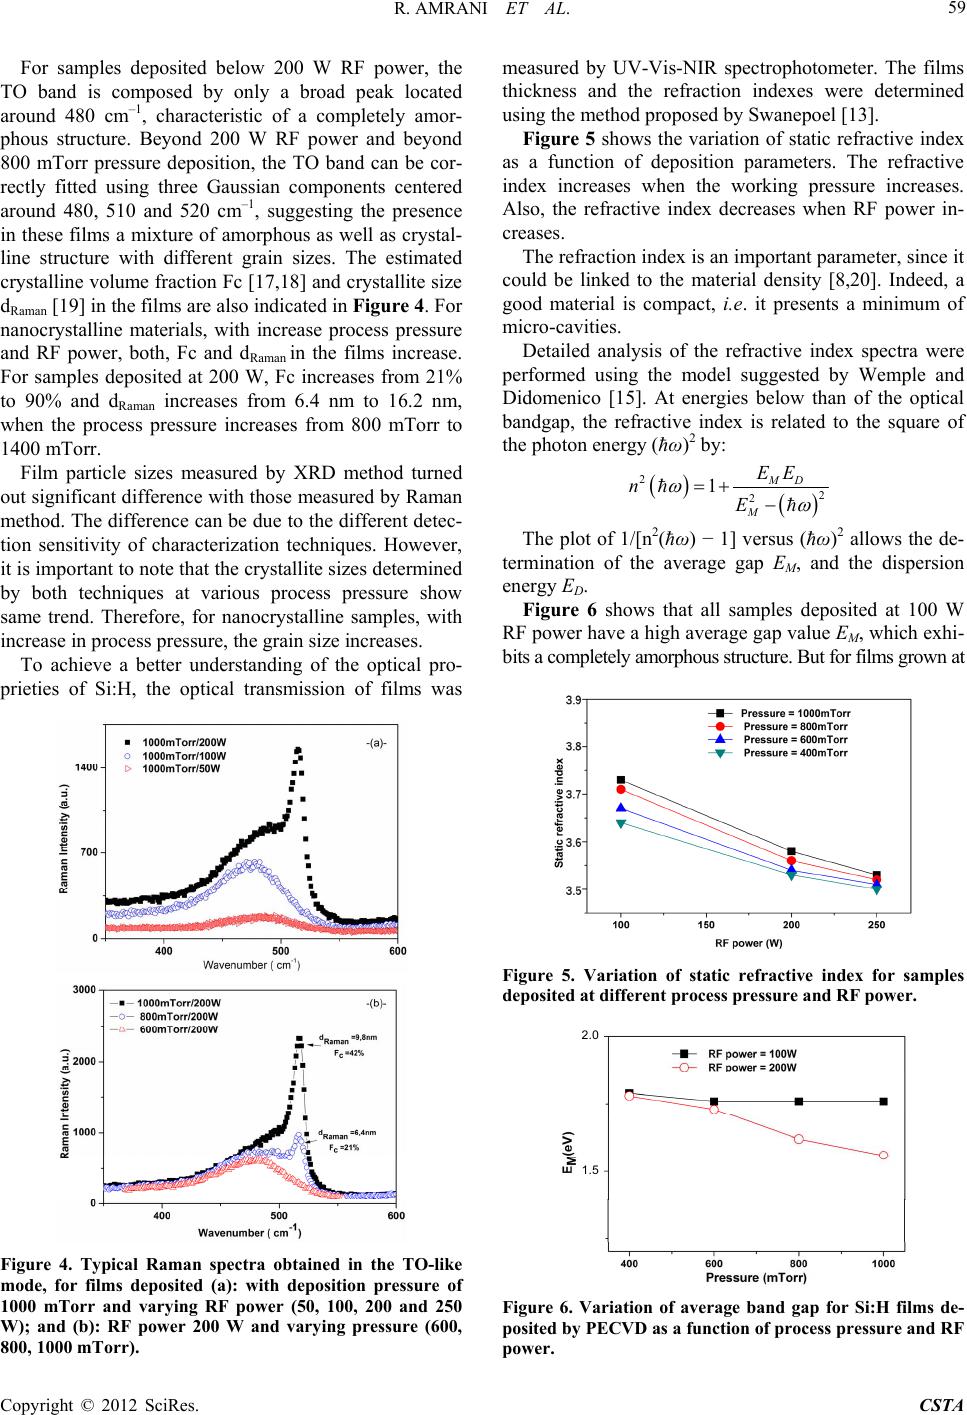 R. AMRANI ET AL. 59 For samples deposited below 200 W RF power, the TO band is composed by only a broad peak located around 480 cm–1, characteristic of a completely amor- phous structure. Beyond 200 W RF power and beyond 800 mTorr pressure deposition, the TO band can be cor- rectly fitted using three Gaussian components centered around 480, 510 and 520 cm–1, suggesting the presence in these films a mixture of amorphous as well as crystal- line structure with different grain sizes. The estimated crystalline volume fraction Fc [17,18] and crystallite size dRaman [19] in the films are also indicated in Figure 4. For nanocrystalline materials, with increase process pressure and RF power, both, Fc and dRaman in the films increase. For samples deposited at 200 W, Fc increases from 21% to 90% and dRaman increases from 6.4 nm to 16.2 nm, when the process pressure increases from 800 mTorr to 1400 mTorr. Film particle sizes measured by XRD method turned out significant difference with those measured by Raman method. The difference can be due to the different detec- tion sensitivity of characterization techniques. However, it is important to note that the crystallite sizes determined by both techniques at various process pressure show same trend. Therefore, for nanocrystalline samples, with increase in process pressure, the grain size increases. To achieve a better understanding of the optical pro- prieties of Si:H, the optical transmission of films was Figure 4. Typical Raman spectra obtained in the TO-like mode, for films deposited (a): with deposition pressure of 1000 mTorr and varying RF power (50, 100, 200 and 250 W); and (b): RF power 200 W and varying pressure (600, 800, 1000 mTorr). measured by UV-Vis-NIR spectrophotometer. The films thickness and the refraction indexes were determined using the method proposed by Swanepoel [13]. Figure 5 shows the variation of static refractive index as a function of deposition parameters. The refractive index increases when the working pressure increases. Also, the refractive index decreases when RF power in- creases. The refraction index is an important parameter, since it could be linked to the material density [8,20]. Indeed, a good material is compact, i.e. it presents a minimum of micro-cavities. Detailed analysis of the refractive index spectra were performed using the model suggested by Wemple and Didomenico [15]. At energies below than of the optical bandgap, the refractive index is related to the square of the photon energy (ħω)2 by: 2 2 2 1 MD M EE n E The plot of 1/[n2(ħω) − 1] versus (ħω)2 allows the de- termination of the average gap EM, and the dispersion energy ED. Figure 6 shows that all samples deposited at 100 W RF power have a high average gap value EM, which exhi- bits a completely amorphous structure. But for films grown at Figure 5. Variation of static refractive index for samples deposited at different process pressure and RF power. 2.0 1.5 Figure 6. Variation of average band gap for Si:H films de- posited by PECVD as a function of process pr essure and RF power. Copyright © 2012 SciRes. CSTA  R. AMRANI ET AL. 60 200 W and beyond 800 mTorr, EM decreases considera- bly. This confirms once again, that beyond these deposi- tion parameters, an amorphous-nanocrystalline transition is observed. The RF bias voltage is an important deposition pa- rameter of nc-Si:H films. During the growth, the RF bias has a decisive effect on the energy and natures of (SiHn) species [19]. The appropriate bias may control the reac- tion rate at the gas-substrate interface, so as to promote the nucleation rate, and enhance the densification of nanocrystallites in the growing films. He et al. demon- strate also, that bias voltage controls the crystalline frac- tion for nc-Si:H samples [19]. In this work, and at certain deposition parameters, the bias varies. For power more than 200 W and pressure below 800 mTorr, RF bias in- creases from 3 V to 80 V, after a few minutes for the beginning of the deposition process. The reflect RF power is also an important parameter. After a specific deposition time (~10 min), the reflect power increases, and in consequence the real power deposition decreases. To resolve the effects of RF bias and RF power reflect values, samples were deposited with layer by layer (LBL) deposition method. 4. Conclusion As conclusion, we have proved that the formation of powders in Silane-Argon plasma, initially considered as a drawback, can be exploited to produce nanocrystalline silicon particles. We have shown that hydrogenated nanocrystalline silicon (nc-Si:H) films can be prepared from silane argon mixture without hydrogen dilution at high deposition rates (~10 Å/s) and at low substrate tem- perature (200˚C) using PECVD method. The structural evolution studies show that beyond 200 W RF power and beyond 800 mTorr pressure deposition conditions, we observed an amorphous-nanocrystalline transition. From the present study it has been concluded that the process pressure and RF power are the key process parameters to induce the crystallinity in the Si:H films grown by PECVD method. From materials and devices application, especially, photovoltaic devices application, nanocrystal- line silicon produced at low temperature in silane plasma, open the way to new applications, like the deposition on flexible substrate. 5. Acknowledgements The authors would like to thank D. Bourgogne for Ra- man experiments assistance and B. Fraisse for the X-ray diffraction measurements. This work is kindly supported by Averroes Program. REFERENCES [1] W. E. Spear and P. G. LeComber, “Subtitutional Doping of Amorphous Silicon,” Solid State Communications, Vol. 17, No. 9, 1975, pp. 1193-1196. doi:10.1016/0038-1098(75)90284-7 [2] D. L. Staebler and C. R. Wronki, “Reversible Conduc- tivity Changes in Discharge Produced Amorphous Si,” Applied Physical Letters, Vol. 31, No. 4, 1977, p. 292. doi:10.1063/1.89674 [3] H. Li, R. H. Franken, R. L. Stolk, C. H. M. van der Werf, J. K. Rath and R. E. I. Schropp, “Controlling the Quality of Nanocrystalline Silicon Made by Hot-Wire Chemical Vapor Deposition by Using a Reverse H2 Profiling Tech- nique,” Journal of Non-Crystalline Solids, Vol. 354, No. 19-25, 2008, pp. 2087-2091. [4] M. Birkholz, B. Selle, E. Conrad, K. Lips and W. Fuhs, “Evolution of Structure in Thin Microcrystalline Silicon Films Grown by Electron-Cyclotron Resonance Chemical Vapor Deposition,” Journal of Applied Physics, Vol. 88, No. 7, 2000, pp. 4376-4379. doi:10.1063/1.1289783 [5] B. Rech, T. Roschek, J. Müller, S. Wieder and H. Wagner, “Amorphous and Microcrystalline Silicon Solar Cells Prepared at High Deposition Rates Using RF (13.56 MHz) Plasma Excitation Frequencies,” Solar Energy Materials and Solar Cells, Vol. 66, No. 1-4, 2001, pp. 267-273. doi:10.1016/S0927-0248(00)00183-5 [6] Y. Mai, S. Klein, R. Carius, L. Houben, X. Geng and F. Finger, “Improvement of Open Circuit Voltage in Micro- crystalline Silicon Solar Cells Using Hot Wire Buffer Layers,” Journal of Non-Crystalline Solids, Vol. 352, No. 9-20, 2006, pp. 1859-1862. [7] M. van Veen, C. van der Werf and R. Schropp, “Tandem Solar Cells Deposited Using Hot-Wire Chemical Vapor Deposition,” Journal of Non-Crystalline Solids, Vol. 338- 340, No. 1, 2004, pp. 655-658. doi:10.1016/j.jnoncrysol.2004.03.071 [8] R. Amrani, D. Benlekehal, R. Baghdad, D. Senouci, A. Zeinert, K. Zellama, L. Chahed, J. D. Sib and Y. Bouizem, “Low-Temperature Growth of Nanocrystalline Silicon Films Prepared by RF Magnetron Sputtering: Structural and Optical Studies,” Journal of Non-Crystalline Solids, Vol. 354, No. 19-25, 2008, pp. 2291-2295. doi:10.1016/j.jnoncrysol.2007.10.044 [9] J. L. Dorier, C. Hollenstein, A. A. Howling and U. Kroll, “Powder Dynamics in Very High Frequency Silane Plas- mas,” Journal of Vacuum Science & Technology, Vol. A10, No. 4, 1992, pp. 1048-1052. doi:10.1116/1.578200 [10] J. L. Dorier, C. Hollenstein and A. A. Howling, “Spatio- temporal Powder Formation and Trapping in Radio Fre- quency Silane Plasmas Using Two-Dimensional Polari- zation-Sensitive Laser Scattering,” Journal of Vacuum Science & Technology, Vol. A13, No. 3, 1995, pp. 918- 926. doi:10.1116/1.579852 [11] A. A. Howling, J. L. Dorier, C. Hollenstein, U. Kroll and F. Finger, “Frequency Effects in Silane Plasmas for Plasma Enhanced Chemical Vapor Deposition,” Journal of Vacuum Science & Technology, A10, No. 4, 1992, pp. 1080-1085. doi:10.1116/1.578205 [12] J. L. Dorier,“Genèse, Croissance et Conséquences de Particules Dans les Plasmas en Silane à Basse Pression et Basse Température,” Ph.D. Thesis, E.P.F.L, Switzerland, Copyright © 2012 SciRes. CSTA  R. AMRANI ET AL. Copyright © 2012 SciRes. CSTA 61 1996. [13] R. Swanpoel, “Determination of the Thickness and Opti- cal Constants of Amorphous Silicon,” Journal of Physics E: Scientific Instruments, Vol. 16, No. 12, 1983, pp. 1214- 1222. doi:10.1088/0022-3735/16/12/023 [14] J. C. Manifacier, J. Gasiot and J. P. Fillard, “A Simple Method for the Determination of the Optical Constants n, k and the Thickness of a Weakly Absorbing Thin Film,” Journal of Physics E: Scientific Instruments, Vol. 9, No. 11, 1976, pp. 1002-1004. doi:10.1088/0022-3735/9/11/032 [15] S. H. Wemple and M. Didomenico, “Behavior of the Electronic Dielectric Constant in Covalent and Ionic Ma- terials,” Physical Review B, Vol. 3, No. 4, 1971, pp. 1338- 1351. doi:10.1103/PhysRevB.3.1338 [16] P. Scherrer, “Bestimmung der Grösse und Derinneren Struktur von Kolloidteilchen Mittels Röntgenstrahlen,” Nachrichten von der Gesellschaft der Wissenschaften zu Göttingen, Mathematisch-Physikalische Klasse, Vol. 26, No. 1, 1918, pp. 98-100. [17] G. Yue, J. D. Lorentzien, J. Lin, D. Han and Q. Wang, “Photoluminescence and Raman Studies in Thin-Film Materials: Transition from Amorphous to Microcrystal- line Silicon,” Journal of Applied Physical Letters, Vol. 75, No. 4, 1999, pp. 492-494. doi:10.1063/1.124426 [18] D. Beeman, R. Tsu and M. F. Thorpe, “Structural Infor- mation from the Raman Spectrum of Amorphous Sili- con,” Physical Review B, Vol. 32, No. 2, 1985, pp. 874- 878. doi:10.1103/PhysRevB.32.874 [19] Y. He, C. Yin, G. Cheng, L. Wang, X. Liu and G. H. Hu, “The Structure and Properties of Nanosize Crystalline Si- licon Films,” Journal of Applied Physics, Vol. 75, No. 2, 1994, pp. 797-803. doi:10.1063/1.356432 [20] E. C. Freeman and W. Paul, “Optical Constants of rf Sputtered Hydrogenated Amorphous Si,” Physical Review B, Vol. 20, No. 1, 1979, pp. 716-728. doi:10.1103/PhysRevB.20.716 |