

Paper Menu >>
Journal Menu >>
 American Journal of Climate Change, 2012, 1, 210-216 http://dx.doi.org/10.4236/ajcc.2012.14018 Published Online December 2012 (http://www.SciRP.org/journal/ajcc) Long-Term Changes in Night Time Airglow Emission at 557.7 nm over Mid Latitude Japanese Station i.e., Kiso (35.79˚N, 137.63˚E) Brij Mohan Vyas1, Vimal Saraswat1,2 1Department of Physics, M. L. Sukhadia University, Udaipur, India 2Department of Basic Sciences, Pacific College of Engineering, Udaipur, India Email: [email protected], [email protected] Received July 21, 2012; revised August 23, 2012; accepted September 12, 2012 ABSTRACT The present study describes the long-term changes in Pre-midnight and Midnight airglow intensities of 557.7 nm during the period 1979-1994 over mid latitu de Japanese station i.e., Kiso, Tokyo Astronomical Observatory, University of To- kyo (35.79˚N, 137.63˚E; 1130 m), Japan. It has observed that there is a positive increasing decadal change in Midnight and Pre-midnight mesospheric airglow intensity of the range 25 - 88 R. This range is the order of 10% to 30% of the ob- served MARV and average night airglow intensity of 250 R. Besides this long-term trend, inter-annual monthly varia- tion is also seen from fluctuation of yearly variation of deviation values from MARV to particular average monthly val- ues. The present observations about the positive decadal change in night time mesospheric airglow intensity has been further linked to the reduction of mesospheric electron densities and temperature or shrinking and cooling of the lower ionosphere as established from the long-term behavior of mesospheric parameters such as a negative decadal change in thermal structure, electron density, neutral density parameters as per studies reported by other researchers. Keywords: Airglow; Long-Term Changes; Ionosphere 1. Introduction The ionosphere of Earth emits electromagnetic radiation spectrum ranging from the visible to near infrared (IR) wavelength during different hours continuously. These radiations depend on neutral & electron density, tempe- rature, rate of the recombination and photochemical reac- tions between numerous chemical species occurring at different altitudes of ionospheric layers [1,2]. It is fact that about 40% of the light in a dark moonless night, be- yond the city comes not from the stars or zodiacal belt or galaxies, it scattered by atmospheric particles. The natu- ral chemi-luminescence’s process in the presence of nu- merous types of atmospheric atoms and molecules pre- sent in earth’s ionosphere produce this light [3]. This weak self-luminescence activity observed on the ground is known as Airglow [4]. In simple way the glowing of air is termed as airglow. The airglows are mainly of three types like day, twilight and night airglow according to their time of occurrences [5]. During daytime, the atmospheric atoms, molecules and ions get excited by absorbing incidental solar energy fluxes and subsequently they come down to the ground state, emitting energy as light and it is termed as Day Airglow [1,6,7]. However, in night hours, when they come down to ground state or meta-stable lower energy state, they emit the electromagnetic radiation light; these transitions known as Night Airglow. In addition to this, collision also plays a vital role for n ight airglow emission. During twilight hours, the ions, atoms and molecules are partly or completely getting excited not only by absorb- ing solar energy but also by different collision pheno- menon. The various types of airglow spectrums are such as lines, band and continuum type of emission ranging from ultraviolet (UV) to near IR. The primary emission lines, accessible on the grounds are known as Oxygen airglow (OI 557.7 nm (Green), OI 630 nm (Red)), Hy- droxyl airglow and Sodium D-airglow lines (Na-D 589.3 nm (Yellow)) [8 ]. There are several lines of wavelengths concerned to different ionospheric regions of night airglows. Generally night airglow of Na-D line (589.3 nm) is found to be linked with mesospheric-lower thermospheric (MLT) region i.e., 90 to 100 km (peak emission altitude ~ 92km), whereas the night airglow of deep red emission at 630 nm (peak emission altitude ~ 250 km) attributes to iono- spheric F-region [9]. However, the nocturnal airglow in- tensity at 557.7 nm is mainly concerned with the meso- spheric region in different night hours [8,10,11]. Thus, nocturnal airglow intensity of OI 557.7 nm, Na-D 589.3 C opyright © 2012 SciRes. AJCC 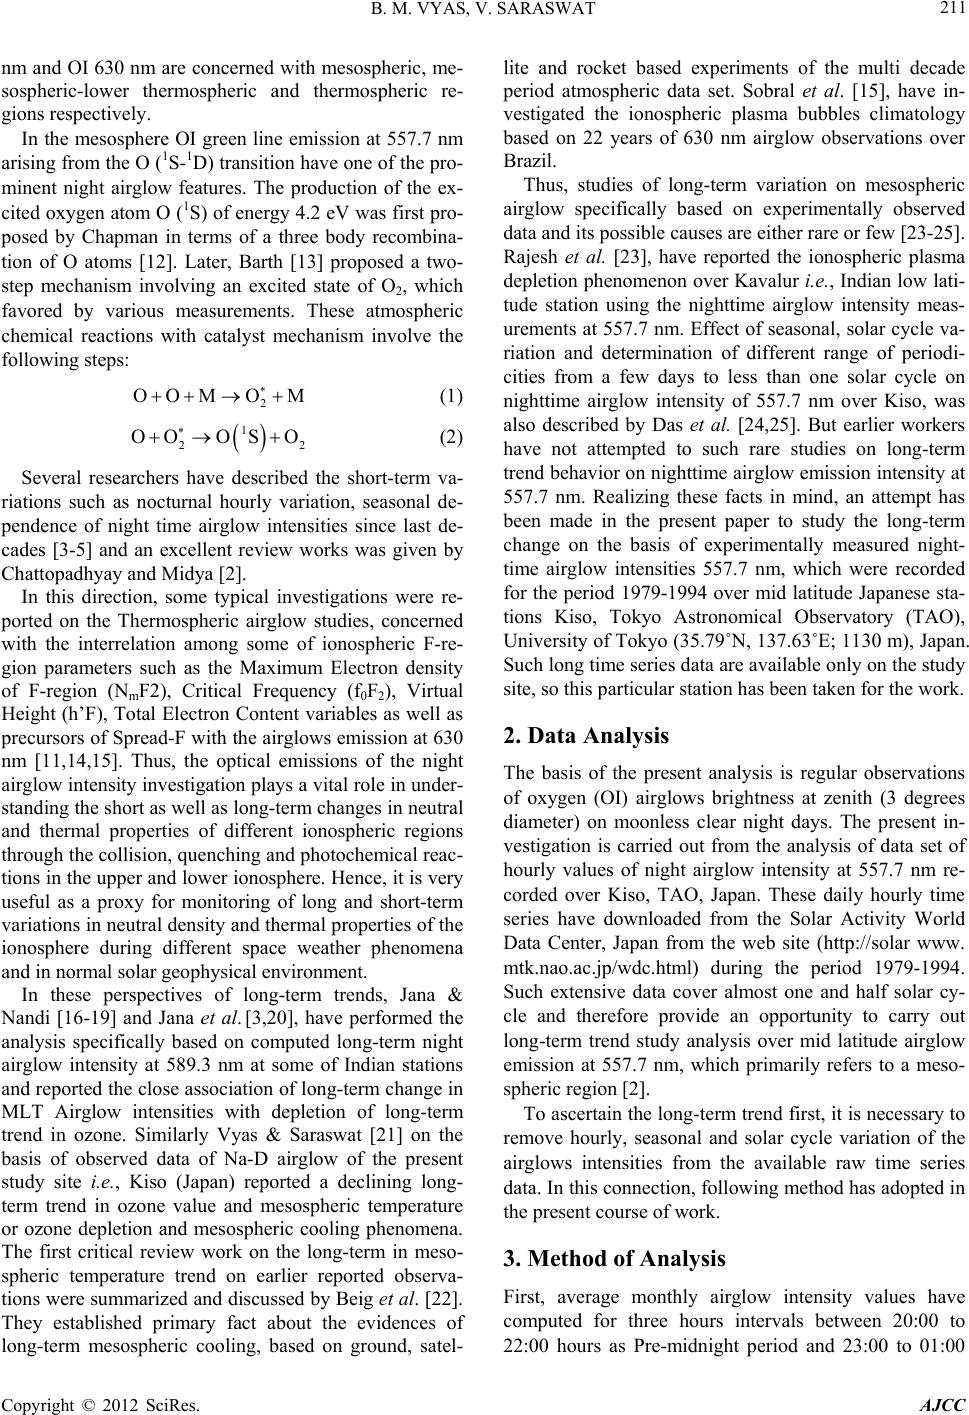 B. M. VYAS, V. SARASWAT 211 nm and OI 630 nm are concerned with mesospheric, me- sospheric-lower thermospheric and thermospheric re- gions respectively. In the mesosphere OI green line emission at 557.7 nm arising from the O (1S-1D) tran sition have one of the pro - minent night airglow features. The production of the ex- cited oxygen ato m O (1S) of energy 4.2 eV was first pro- posed by Chapman in terms of a three body recombina- tion of O atoms [12]. Later, Barth [13] proposed a two- step mechanism involving an excited state of O2, which favored by various measurements. These atmospheric chemical reactions with catalyst mechanism involve the following steps: 2 OOMO M (1) 1 2 OOOS O 2 (2) Several researchers have described the short-term va- riations such as nocturnal hourly variation, seasonal de- pendence of night time airglow intensities since last de- cades [3-5] and an excellent review works was given by Chattopadhyay and Midya [2]. In this direction, some typical investigations were re- ported on the Thermospheric airglow studies, concerned with the interrelation among some of ionospheric F-re- gion parameters such as the Maximum Electron density of F-region (NmF2), Critical Frequency (f0F2), Virtual Height (h’F), Total Electron Content variables as well as precursors of Spread-F with the airglows emission at 630 nm [11,14,15]. Thus, the optical emissions of the night airglow intensity investigation p lays a vital role in under- standing the short as well as long-term changes in neutral and thermal properties of different ionospheric regions through the collision, quenching and photochemical reac- tions in the upper an d lower ionosphere. Hence, it is v ery useful as a proxy for monitoring of long and short-term variations in neutral density and thermal properties of the ionosphere during different space weather phenomena and in normal solar geophysical environment. In these perspectives of long-term trends, Jana & Nandi [16-19] and Jana et al. [3,20], have performed the analysis specifically based on computed long-term night airglow intensity at 589.3 nm at some of Indian stations and reported the close association of long-term change in MLT Airglow intensities with depletion of long-term trend in ozone. Similarly Vyas & Saraswat [21] on the basis of observed data of Na-D airglow of the present study site i.e., Kiso (Japan) reported a declining long- term trend in ozone value and mesospheric temperature or ozone depletion and mesospheric cooling phenomena. The first critical review work on the long-term in meso- spheric temperature trend on earlier reported observa- tions were summarized and discussed by Beig et al. [22]. They established primary fact about the evidences of long-term mesospheric cooling, based on ground, satel- lite and rocket based experiments of the multi decade period atmospheric data set. Sobral et al. [15], have in- vestigated the ionospheric plasma bubbles climatology based on 22 years of 630 nm airglow observations over Brazil. Thus, studies of long-term variation on mesospheric airglow specifically based on experimentally observed data and its possible causes are either rare or few [23-25]. Rajesh et al. [23], have reported the ionospheric plasma depletion phenomenon over Kavalur i.e., Indian low lati- tude station using the nighttime airglow intensity meas- urements at 557.7 nm. Effect of seasonal, solar cycle va- riation and determination of different range of periodi- cities from a few days to less than one solar cycle on nighttime airglow intensity of 557.7 nm over Kiso, was also described by Das et al. [24,25]. But earlier workers have not attempted to such rare studies on long-term trend behavior on nighttime airglow emission intensity at 557.7 nm. Realizing these facts in mind, an attempt has been made in the present paper to study the long-term change on the basis of experimentally measured night- time airglow intensities 557.7 nm, which were recorded for the period 1979-1994 over mid latitude Japanese sta- tions Kiso, Tokyo Astronomical Observatory (TAO), University of Tokyo (35.79˚N, 137.63˚E; 1130 m), Japan. Such long time series data are av ailable only on the stud y site, so this particular station has been taken for the work. 2. Data Analysis The basis of the present analysis is regular observations of oxygen (OI) airglows brightness at zenith (3 degrees diameter) on moonless clear night days. The present in- vestigation is carried out from the analysis of data set of hourly values of night airglow intensity at 557.7 nm re- corded over Kiso, TAO, Japan. These daily hourly time series have downloaded from the Solar Activity World Data Center, Japan from the web site (http://solar www. mtk.nao.ac.jp/wdc.html) during the period 1979-1994. Such extensive data cover almost one and half solar cy- cle and therefore provide an opportunity to carry out long-term trend study analysis over mid latitude airglow emission at 557.7 nm, which primarily refers to a meso- spheric region [2]. To ascertain the long-term trend first, it is necessary to remove hourly, seasonal and solar cycle variation of the airglows intensities from the available raw time series data. In this connection, following method has adopted in the present course of work. 3. Method of Analysis First, average monthly airglow intensity values have computed for three hours intervals between 20:00 to 22:00 hours as Pre-midnight period and 23:00 to 01:00 Copyright © 2012 SciRes. AJCC  B. M. VYAS, V. SARASWAT Copyright © 2012 SciRes. AJCC 212 have computed and plotted as a function of years. The average values of such deviations are also depicted as black dotted lines to visualize the overall lon g-term trend in Mesospheric airglow intensities or departure from the normal level. hours as the Midnight period from their respective daily values of each particular month of the years (1979-1994). The particular average monthly values of Pre-midnight and Midnight hours have been computed to eliminate the hourly, month-to-month as well as seasonal dependence factors from the raw daily airglow data. Subsequently, monthly average reference value (MARV) has also cal- culated separately from the average monthly values of Pre-midnight and Midnight hours for each specific month of the entire selected study years. Such MARV value of individual monthly value of airglow intensity is evalu- ated to eliminate the solar cycle dependence of entire specified period and is shown in the Table 1 and Figures 1 and 2. Therefor e, MARV ha s treat ed as refe rence v alue for the specific month of observations of the chosen study period. Furthermore, such time series of deviation value of MARV are subjected to statistical linear regression ana- lysis to find the slope or yearly change and correlation coefficient (R’) etc., of the linearly fitted line. The statis- tically linearly regression fitted line as the red line is il lustrated along with their observed trend exhibited by dark black line in the same figures (Figures 1 and 2). The slope, R’ and probability (P) values have also shown in each figure, which gives the inference about the cha ng- ing of airglow intensity per year with its statistical sig- nificance, respectively. Figures 1 and 2 show graphical representations of the long-term change in airglow inten- sities 557.7 nm in each individual month of years from The deviation of the individual average monthly val- ues from corresponding MARV of the similar months Figure 1. Long-term change in pre-midnight airglow intensity at 557.7 nm for different months.  B. M. VYAS, V. SARASWAT 213 Figure 2. Long-term change in midnight airglow intensity at 557.7 nm for different months. 1979-1994 for Pre-midnight and Midnight hours respec- tively. The results obtained from the analysis have pre- sented and discussed in the next section 4. Results 4.1. Mid Latitude Pre-Midnight Airglow Intensities Figure 1 represents the year to year variation in devia- tion values from MARV to its individual particular av- erage monthly value of Pre-midnight green airglow emission of Oxygen on 557.7 nm. It is quite eviden t from figures as well as calculated slope, R’ and P values that deviation values from the MARV airglow intensity shows the maximum positive decadal change between 32 to 80 R1 during March to June and October to December (with a maximum value of 80 R in October) but on the basis of the statistical significance level, the good sig- nificance level above 95% found during April to June, October and November month. The significance level below 95% found in March & December and in January & February months only ab out 75% signif icance is found during this period 28 R per decade change occurs in de- viation in intensity from the mean value of the airglow. While in rest of months like July to September, there is an insignificant statistical change (below 50%) in yearly variation in such airglow intensity. From the close look to the nature of red and black line in the figures and above discussed results, it implies th at the most prob able deviation values from the MARV to individual average value exhibit the increasing trend and its magnitude va- ries between 25 to 80 R per decade in most of the months with the statistical significance level of above 90% ex- cept in July to September. While, MARV values are found to be chang ed between 82 to 264 R with maximu m and minimum in October and January months, respec- tively. Thus, the results observed in the present work 1Unit of airglow intensity, Rayleigh photons/cm2/sec. Copyright © 2012 SciRes. AJCC  B. M. VYAS, V. SARASWAT 214 Table 1. Monthly average reference values of the airglow intensity of OI 577.7 nm and their standard error value in pre-midnight and midnight hours of different months dur- ing study period. MARV during Month Pre-midnight Midnight January February March April May June July August September October November December 82.41 ± 10.09 108.05 ± 11.65 136.68 ± 13.44 185.45 ± 27.14 168.51 ± 10.97 175.84 ± 9.09 133.38 ± 13.84 141.47 ± 15.28 222.57 ± 15.44 264.25 ± 18.84 150.93 ± 10.91 103.48 ± 13.34 116.67 ± 13.80 129.52 ± 12.57 151.78 ± 16.62 190.35 ± 25.91 186.43 ± 12.52 213.27 ± 10.23 156.69 ± 11.56 171.08 ± 18.04 195.01 ± 16.42 236.98 ± 19.39 168.51 ± 12.75 137.24 ± 14.95 like the variation of MARV follows the same trend as well as comparable values to monthly airglow intensity magnitude with the highest value of airg low intensity ob- served in October and lowest in January retrieved from several year observations over mid latitude sites by Carovillano and Forbe [26]. They also reported the aver- age value of night airglow of OI 557.7 nm of order 250 R which are also in the same order as observed in the pre- sent investigation of the average value of the MARV value of all months. With consideration of above reported average nominal value of night time airglow intensity of 557.7 nm order of 250 R, observed change in MARV of individ ual mon- th and decadal fluctuation rang e of 25 to 80 R, it is impe- rative that increasing decadal change in the Pre-midnight airglow intensity is seen up to 30% of the average refe- rence nominal value. Furthermore, the year to year fluc- tuations in the deviation value of the airglow intensity is also attributed the inter-annual month ly nature as evident from the black dotted line. 4.2. Mid Latitude Midnight Airglow Intensities The Midnight yearly behavior of departure values from the MARV to each specific monthly average value are plotted with years in Figure 2. The positive deviation v a- lues per decade are found to be lying in the range be- tween 30 to 88 R (statistically significant at least 90% or above significance level), which is in the same order as observed for the Pre-midnight period. However, the li- near regression trend line (shown by red colour) and av er- age deviation line (shown by dotted black line) exhibit enhancement trend in the highest range of 60 to 88 R per decade during March, October and November and the lowest range of 30 to 40 R per decade in Feb ruary, April to July. However, in remaining months there is no sig- nificant long-term variation in the same night airglow intensity. The MARV of the different months are also found to be varied from 116 to 236 R with a peak value of 236 R in October and the least value in January as shown in Table 1 and Figure 2. Similar monthly varia- tion in airglow intensity is also observed in Pre-midnight hour case in the present investigation and also reported by several researche rs on ot her stations [3-5,10 ,11] . On the basis of the above discussed results, it is obvi- ous that there is a remarkable inclination of long-term increasing trend in Pre-midnight as well as Midnight mesospheric airglow intensity of 25 to 80 R in some of months with good statistical significance level above 90%. This rate of increase the airglow of OI 557.7 nm line intensity per decade is in the magnitude of 10% to 30% with the observed MARV as well as average nomi- nal of 250 R. Furthermore, the yearly fluctuations in the difference values of specified month are also illustrating the nature of inter-annual monthly behavior in the air- glow intensity. 5. Summary and Discussions The long-term behavior of Pre-midnight and Midnight airglow intensities concerning to mesospheric layers are described in the present work. The present results reveal that there is positive increasing decadal change in Mid- night and Pre-midnight mesospheric airglow intensity of the magnitude in the range of 25 to 88 R, which is the order of 10% to 30% of the observed MARV and aver- age night airglow intens ity values of OI 557.7 nm of 250 R as reported by Carovillano & Forbes [26]. It has been well recognized and well established fact that each air- glow emission intensity and its width primarily depends on the large number of ionospheric parameters like elec- tron density, temperature profile, the nature of chemical species of the concerned height range of airglow emis- sion lines, where it takes p lace. On the basis of the above argument, it may be stated that consequence of the in- creasing of mesospheric airglow intensities may be re- sponsible to alter the mesospheric thermal structure, wh ich further seems the cause of reduction of mesospheric electron density. Therefore, such long-term trend in air- glow mesosphere intensity can be further linked to the observed reduction of electron density, shrinking of the ionosphere or in term of negative varying nature of its decadal change in temperature and electron density etc., of concerned ionospheric D-region [23-25]. Copyright © 2012 SciRes. AJCC  B. M. VYAS, V. SARASWAT 215 6. Acknowledgements We the authors are grateful to Dr. G. Beig, IITM, Pune, India for scientific advice and suggesting the views for the present carried research work. The authors are also thankful to Head, Department of Physics, M. L. Sukhadia University, Udaipur, India for providing necessary en- couragements during investigation. REFERENCES [1] M. H. Rees, “Physics and Chemistry of the Upper Atmo- sphere,” Cambridge University Press, Cambridge, 1989. doi:10.1017/CBO9780511573118 [2] R. Chattopadhyay and S. K. Midya, “Airglow Emissions: Fundamentals of Theory and Experiments,” Indian Jour- nal of Physics, Vol. 80, No. 2, 2006, pp. 115-166. [3] P. K. Jana, I. Saha and S. Mukhopadhyay, “Long-Term Ozone Decline and Its Effect on Night Airglow Intensity of Li 6708 Å at Varanasi (25˚N, 83˚E) and Halley Bay (76S, 27W),” Journal of Earth System Science, Vol. 120, No. 2, 2011, pp. 291-300. doi:10.1007/s12040-011-0047-8 [4] S. K. Midya and D. Midya, “The Effect of Antarctic O3 Decline on Night Airglow Inten sity of Na5893Å, O55 77Å, OH Emission and Its Correlation with Solar Flare Num- bers,” Earth, Moon & Planets (The Netherlands), Vol. 61, No. 2, 1993, pp. 175-182. doi:10.1007/BF00572412 [5] S. K. Midya and R. Chattopadhyay, “Evening Twilight- Glow of Sodium 5893 Å Line Emission at Calcutta and Its Typical Relation with Astronomical Parameters,” In- dian Journal of Radio & Space Physics, Vol. 35, No. 2, 2006, pp. 77-83. [6] J. W. Chamberlain, “Physics of the Aurora and Airglow,” Academic Press, New York, 1961. [7] D. M. Hunten, “Airglow Introduction and Review,” In: B. M. McCormac, Ed., The Radiating Atmosphere, D. Reidel Publishing Company, Dordrecht, 1970, pp. 1-16. [8] T. N. Davis, “The Night Airglow,” 1979, Article #293. http://www.gi.alaska.edu/ScienceForum/ASF2/293.html [9] A. Taori, A. Jayaraman, K. Raghunath and V. Kamalakar, “A New Method to Derive Middle Atmospheric Tempe- rature Profiles Using a Combination of Rayleigh Lidar and O2 Airglow Temperatures Measurements,” Annals of Geophysics, Vol. 30, No. 1, 2012, pp. 27-32. doi:10.5194/angeo-30-27-2012 [10] H. Gao, J.-B. Nee and J. Xu, “The Emission of Oxygen Green Line and Density of O Atom Determined by Using ISUAL and SABER Measurements,” Annals of Geophy- sics, Vol. 30, No. 4, 2012, pp. 695-701. doi:10.5194/angeo-30-695-2012 [11] T. Bangia, S. Bhattacharjee, A. Guharay, A. Taori and W. Uddin, “Study of Upper Atmospheric Emissions Using Mesosphere Lower Thermosphere Photometer (MLTP) Designed at ARIES,” Indian Journal of Radio & Space Physics, Vol. 39, No. 5, 2010, pp. 325-329. [12] D. R. Bates, “Excitation of 557.7 nm OI Line in Night- Glow,” Planetary and Space Science, Vol. 36, No. 9, 1988, pp. 883-889. doi:10.1016/0032-0633(88)90094-3 [13] C. A. Barth and A. F. Hildebrandt, “The 5577 Å Airglow Emission Mechanism,” Journal of Geophysical Research, Vol. 66, No. 3, 1961, pp. 985-986. [14] T. Ogawa, N. Balan, Y. Otsuka, K. Shiokawa, C. Ihara, T. Shimomai and A. Saito, “Observations and Modeling of 630 nm Airglow and Total Electron Content Associated with Traveling Ionospheric Disturbances over Shigaraki, Japan,” Earth, Planet Space (Japan), Vol. 54, No. 1, 2002, pp. 45-56. [15] J. Sobral, M. Abdu, H. Takahashi, M. Taylor, E. de Paula, C. Zamlutti, M. de Aquino and G. Borba, “Ionospheric Plasma Bubble Climatology over Brazil Base d on 22 Year s (1977-1998) of 630 nm Airglow Observatio ns,” Journal of Atmospheric and Solar-Terrestrial Physics (UK), Vol. 64, No. 1214, 2002, pp. 1517-1524. doi:10.1016/S1364-6826(02)00089-5 [16] P. K. Jana and S. C. Nandi, “Effect of Solar Parameters on Antarctic, Arctic and Tropical Ozone during the Last Solar Cycle,” Indian Journal of Radio & Space Physics, Vol. 34, No. 2, 2005, pp. 114-118. [17] P. K. Jana and S. C. Nandi, “Depletion of Ozone and Its Effect on Night Airglow Intensity of Na 5893 Å at New Delhi (29˚N, 77˚E) and Halley Bay (76˚S, 27 ˚W),” Indian Journal of Physics, Vol. 79, No. 11, 2005, pp. 1113-1317. [18] P. K. Jana and S. C. Nandi, “Depletion of Ozone and Its Effect on Night Airglow Intensity of Na 5893 Å at Trivandrum (8.25˚N, 76.9˚E) and Halley Bay (76˚S, 27˚W),” Mausam, Vol. 57, No. 2, 2005, pp. 350-354. [19] P. K. Jana and S. C. Nandi, “Ozone Decline and Its Effect on Night Airglow Intensity of Na 5893 Å at Dumdum (22.5˚N, 88.5˚E) and Halley Bay (76˚S, 27˚W),” Journal of Earth System Science, Vol. 115, No. 5, 2006, pp. 607- 613. doi:10.1007/BF02702913 [20] P. K. Jana, I. Saha, P. Das, D. Sarkar and S. K. Midya, “Long-Term Ozone Trend and Its Effect on Night Air- glow Intensity of Li 6708 Å at Ahmedaba d (23˚N, 72.5˚E), India and Halley Bay (76˚S, 27˚W), British Antarctic Service Station,” Indian Journal of Physics, Vol. 84, No. 1, 2010, pp. 41-53. doi:10.1007/s12648-010-0003-5 [21] B. M. Vyas and V. Saraswat, “Long Term Trend in Noc- turnal Airglow Emission of 589.3 nm over Mid Latitude Japanese Station i.e., Kiso (35.79˚N, 137.63˚E),” 2012. http://www.nipne.ro/rjp/accpaps/Saraswat_V_8FB31B.pd f). [22] G. Beig, P. Keckhut, R. P. Lowe, R. G. Roble, M. G. Mlyczak, J. Scheer, V. I. Fomichev, D. Offerman, W. J. R. French, M. G. Shepherd, A. I. Semenov, E. E. Remsberg, C. Y. She, F. J. Lubken, J. Bremer, B. R. Clemesha, J. Stegman, F. Sigerne s and S. Fadnavis, “Revie w of Meso- spheric Temperature Trends,” Reviews of Geophysics, Vol. 41, No. 4, 2003, pp. 1-41. doi:10.1029/2002RG000121 [23] P. K. Rajesh, J. Y. Li u, H. S. S. Sinha, S. B. Banerjee , R. N. Misra, N. Dutt and M. B. Dadhania, “Observations of Plasma Depletions in 557.7 nm Images over Kavalur,” Journal of Geophysical Research, Vol. 112, 2007. doi:10.1029/2006JA012055 Copyright © 2012 SciRes. AJCC  B. M. VYAS, V. SARASWAT Copyright © 2012 SciRes. AJCC 216 [24] U. Das and H. S. S. Sinha, “Long Term Variations in Oxygen Green Line Emission over Kiso, Japan from Ground Photometric Observations Using Continuous Wavelet Transform,” Journal of Geophysical Research, Vol. 113, 2008. doi:10.1029/2007JD009516 [25] U. Das, C. J. Pan and H. S. S. Sinha, “Effects of Solar Cycle Variations on Oxygen Green Line Emission Rate over Kiso, Japan,” Earth Planets Space, Vol. 63, No. 8, 2011, pp. 941-948. [26] R. L. Carovillano and J. M. Forbes, “Solar Terrestrial Physics, Principles and Theoretical Foundations,” D. Reidel Publishing Company, Dordrecht, 1983. |