

Paper Menu >>
Journal Menu >>
 Optics and Photonics Journal, 2012, 2, 286-293 http://dx.doi.org/10.4236/opj.2012.24035 Published Online December 2012 (http://www.SciRP.org/journal/opj) Spectrometric Measurement of Plasma Parameters Utilizing the Target Ambient Gas O I & N I Atomic Lines in LIBS Experiment Ashraf M. El Sherbini1,2, Abdel Aziz Saad Al Amer1, Ahmed T. Hassan1,2, Tharwat M. El Sherbini2 1Department of Physics, Collage of Science, Al Imam Muhammad Ibn Saud Islamic University (AIMSIU), Al Riyadh, KSA 2Laboratory of Lasers and New Materials (LLNM), Department of Physics, Faculty of Science, Cairo University, Giza, Egypt Email: [email protected] Received August 16, 2012; revised September 23, 2012; accepted October 12, 2012 ABSTRACT In this article, we shall report the results of the spectroscopic measurements of the plasma parameters utilizing the spec- tral lines emitted from the air atoms surrounding plasma (O I line at 777.19 nm and N I at 746.83 nm). The plasma was created via irradiation of plane solid aluminum target in open air by a high peak power Nd: YAG laser pulses at funda- mental wavelength of 1064 nm. The emission spectra were recorded using Echelle type spectrograph in conjunction with a time gated ICCD camera at different delay time from 1 to 5 μs and at a fixed gate time of 1 μs. The plasma elec- tron density was measured utilizing the Stark broadening of the N I and O I lines and then compared to the reference density as deduced from the optically thin Hα-line at 656.27 nm appeared in the same emission spectra. The results show that under our experimental conditions the air lines are subjected to moderate absorption. The plasma electron temperature was measured utilizing the relative spectral intensity of the air (O I to N I) lines after correcting their spec- tral radiance against absorption. The standard temperature was measured utilizing the Al II ionic lines. A comparison to the reference temperatures shows a very close agreement after correcting the emission spectral radiance of the air lines against self absorption, which emphasizes the importance of correction process. Keywords: LIBS; Self Absorption; O I-N I Lines; Plasma Parameters 1. Introduction The laser induced breakdown spectroscopy (LIBS) is the spectral analysis to the emitted light from the plasma generated via the interaction of pulsed laser with matter. Over the past decades the LIBS-technique becomes a distinguished applied analytical technique used in dif- ferent application fields, because of its reliability, non- contact optical nature and its freedom from sample pre- paration [1]. Different fields of applications were already established e.g. elemental analysis [2-4], the quality of steel manufacturing [5], characterization of jewellery products [6,7], in soil studies [8,9], pulsed laser thin film deposition [10,11], the quality of pharmaceutical prod- ucts [12], cleaning [13], culture heritage (cleaning of old papers, wood preservers, old paintings) [14-16] and in situ planetary exploration [17]. However, there are more investigations to improve the technique from the physical point of view; e.g. correction of the emitted spectral lines against optical thickness [18-22], improvement of the limit of detection [23], ef- fect of ambient gas pressure on laser ablation process [24,25] and finally an enhancement of the LIBS signals through different suggested schemes e.g. Double pulse LIBS [26]. Two major parameters in LIBS namely electron den- sity and temperature has to be given by experiment in what is called the plasma diagnostics. Different diagnos- tic techniques were established and utilized [27,28]. The most direct method is the optical emission spectroscopy (OES) in which the light emerging from the plasma is studied using a standard experimental setup. Spectroscopically, the plasma electron temperature can be measured from the relative intensity of two or more optically thin lines having small separation in the emis- sion wavelength and large separation in their upper ex- cited states (Boltzmann plot method) [27]. Moreover, the ionization temperature can be calculated from the relative intensity of two or more lines originating from two con- secutive ionization stages. This method enhances the precession in measuring temperature due to enhancement of the separation of the upper excited states by the ioni- zation energy (Saha-Boltzmann plot) [28]. As an exten- C opyright © 2012 SciRes. OPJ 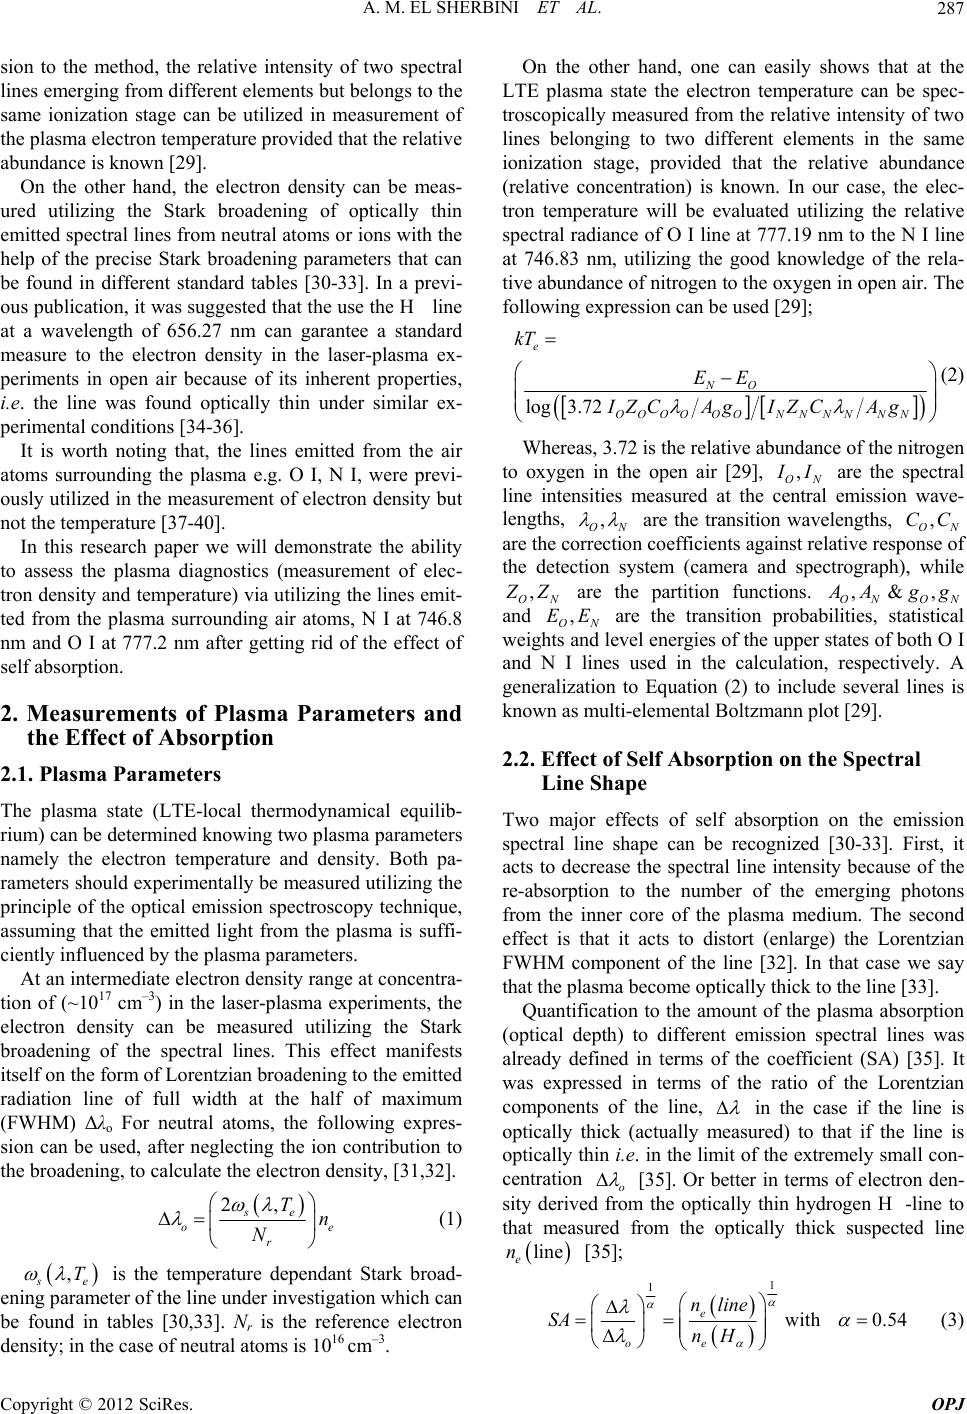 A. M. EL SHERBINI ET AL. 287 sion to the method, the relative intensity of two spectral lines emerging from different elements but belongs to the same ionization stage can be utilized in measurement of the plasma electron temperature provided that the relative abundance is known [29]. On the other hand, the electron density can be meas- ured utilizing the Stark broadening of optically thin emitted spectral lines from neutral atoms or ions with the help of the precise Stark broadening parameters that can be found in different standard tables [30-33]. In a previ- ous publication, it was suggested that the use the H line at a wavelength of 656.27 nm can garantee a standard measure to the electron density in the laser-plasma ex- periments in open air because of its inherent properties, i.e. the line was found optically thin under similar ex- perimental conditions [34-36]. It is worth noting that, the lines emitted from the air atoms surrounding the plasma e.g. O I, N I, were previ- ously utilized in the measurement of electron density but not the temperature [37-40]. In this research paper we will demonstrate the ability to assess the plasma diagnostics (measurement of elec- tron density and temperature) via utilizing the lines emit- ted from the plasma surrounding air atoms, N I at 746.8 nm and O I at 777.2 nm after getting rid of the effect of self absorption. 2. Measurements of Plasma Parameters and the Effect of Absorption 2.1. Plasma Parameters The plasma state (LTE-local thermodynamical equilib- rium) can be determined knowing two plasma parameters namely the electron temperature and density. Both pa- rameters should experimentally be measured utilizing the principle of the optical emission spectroscopy technique, assuming that the emitted light from the plasma is suffi- ciently influenced by the plasma parameters. At an intermediate electron density range at concentra- tion of (~1017 cm–3) in the laser-plasma experiments, the electron density can be measured utilizing the Stark broadening of the spectral lines. This effect manifests itself on the form of Lorentzian broadening to the emitted radiation line of full width at the half of maximum (FWHM) Δλo For neutral atoms, the following expres- sion can be used, after neglecting the ion contribution to the broadening, to calculate the electron density, [31,32]. 2, se o r Tn N e (1) , s e T is the temperature dependant Stark broad- ening parameter of the line under investigation which can be found in tables [30,33]. Nr is the reference electron density; in the case of neutral atoms is 1016 cm–3. On the other hand, one can easily shows that at the LTE plasma state the electron temperature can be spec- troscopically measured from the relative intensity of two lines belonging to two different elements in the same ionization stage, provided that the relative abundance (relative concentration) is known. In our case, the elec- tron temperature will be evaluated utilizing the relative spectral radiance of O I line at 777.19 nm to the N I line at 746.83 nm, utilizing the good knowledge of the rela- tive abundance of nitrogen to the oxygen in open air. The following expression can be used [29]; log3.72 e NO OOOOOON NNNN N kT EE IZCAg IZCAg (2) Whereas, 3.72 is the relative abundance of the nitrogen to oxygen in the open air [29], , ON I I are the spectral line intensities measured at the central emission wave- lengths, , ON are the transition wavelengths, are the correction coefficients against relative response of the detection system (camera and spectrograph), while , ON CC , ON Z Z are the partition functions. ON ON ,&, A Agg and are the transition probabilities, statistical weights and level energies of the upper states of both O I and N I lines used in the calculation, respectively. A generalization to Equation (2) to include several lines is known as multi-elemental Boltzmann plot [29]. , ON EE 2.2. Effect of Self Absorption on the Spectral Line Shape Two major effects of self absorption on the emission spectral line shape can be recognized [30-33]. First, it acts to decrease the spectral line intensity because of the re-absorption to the number of the emerging photons from the inner core of the plasma medium. The second effect is that it acts to distort (enlarge) the Lorentzian FWHM component of the line [32]. In that case we say that the plasma become optically thick to the line [33]. Quantification to the amount of the plasma absorption (optical depth) to different emission spectral lines was already defined in terms of the coefficient (SA) [35]. It was expressed in terms of the ratio of the Lorentzian components of the line, in the case if the line is optically thick (actually measured) to that if the line is optically thin i.e. in the limit of the extremely small con- centration o [35]. Or better in terms of electron den- sity derived from the optically thin hydrogen H-line to that measured from the optically thick suspected line line e n [35]; 1 1 with 0.54 e oe nline SA nH (3) Copyright © 2012 SciRes. OPJ 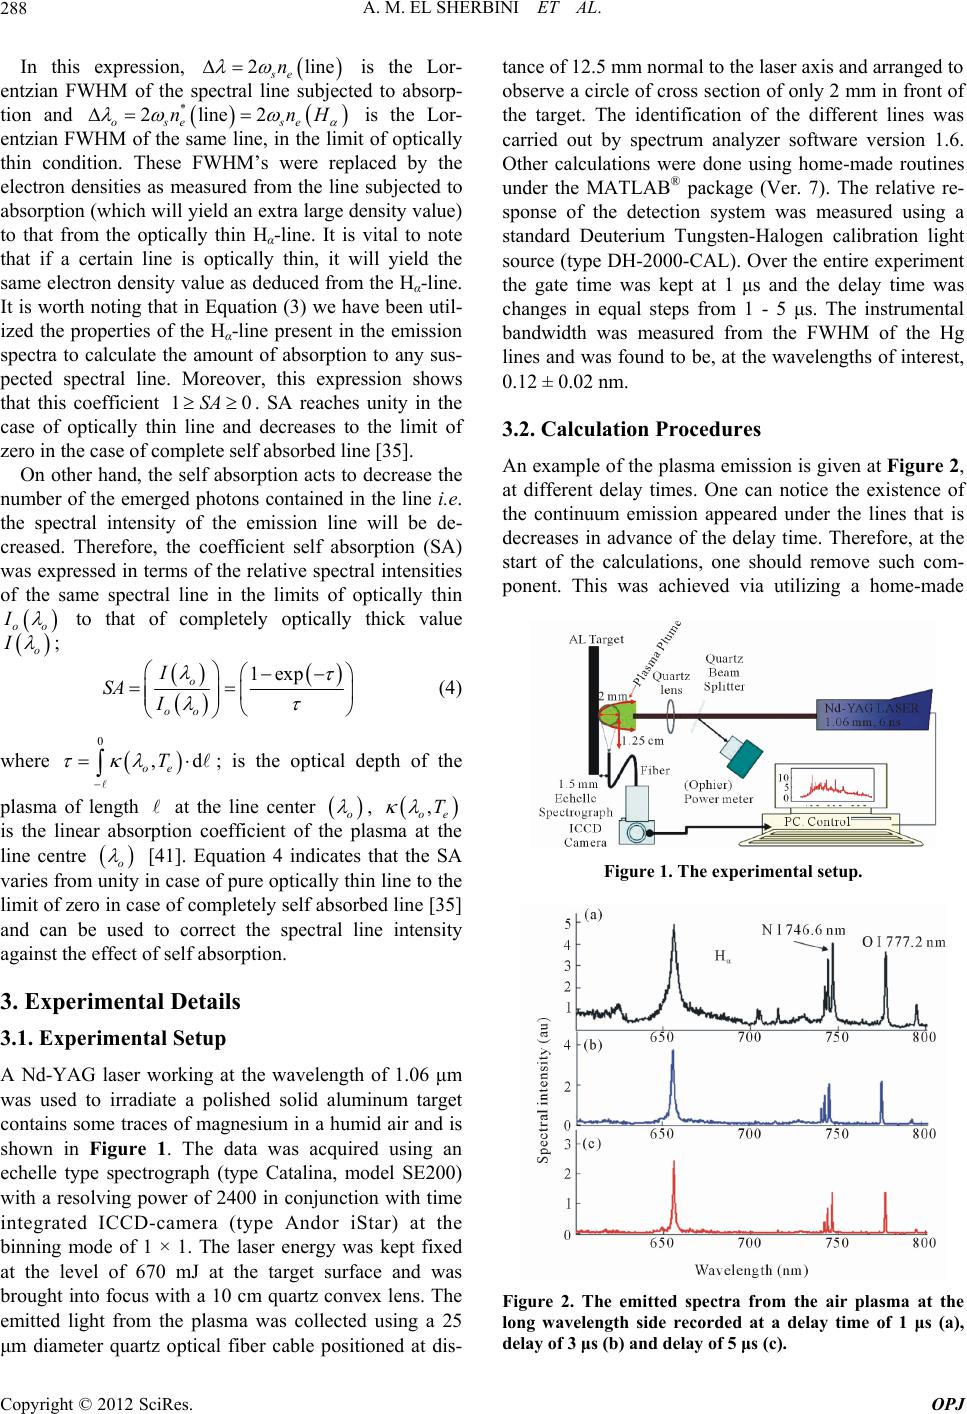 A. M. EL SHERBINI ET AL. 288 In this expression, is the Lor- entzian FWHM of the spectral line subjected to absorp- tion and ose se 2lin se n 2line2nn e H * 10SA is the Lor- entzian FWHM of the same line, in the limit of optically thin condition. These FWHM’s were replaced by the electron densities as measured from the line subjected to absorption (which will yield an extra large density value) to that from the optically thin Hα-line. It is vital to note that if a certain line is optically thin, it will yield the same electron density value as deduced from the Hα-line. It is worth noting that in Equation (3) we have been util- ized the properties of the Hα-line present in the emission spectra to calculate the amount of absorption to any sus- pected spectral line. Moreover, this expression shows that this coefficient . SA reaches unity in the case of optically thin line and decreases to the limit of zero in the case of complete self absorbed line [35]. On other hand, the self absorption acts to decrease the number of the emerged photons contained in the line i.e. the spectral intensity of the emission line will be de- creased. Therefore, the coefficient self absorption (SA) was expressed in terms of the relative spectral intensities of the same spectral line in the limits of optically thin oo I to that of completely optically thick value o I ; 1exp o oo I SA I (4) where ; is the optical depth of the 0 ,d oe T plasma of length at the line center o , , oe T is the linear absorption coefficient of the plasma at the line centre o [41]. Equation 4 indicates that the SA varies from unity in case of pure optically thin line to the limit of zero in case of completely self absorbed line [35] and can be used to correct the spectral line intensity against the effect of self absorption. 3. Experimental Details 3.1. Experimental Setup A Nd-YAG laser working at the wavelength of 1.06 μm was used to irradiate a polished solid aluminum target contains some traces of magnesium in a humid air and is shown in Figure 1. The data was acquired using an echelle type spectrograph (type Catalina, model SE200) with a resolving power of 2400 in conjunction with time integrated ICCD-camera (type Andor iStar) at the binning mode of 1 × 1. The laser energy was kept fixed at the level of 670 mJ at the target surface and was brought into focus with a 10 cm quartz convex lens. The emitted light from the plasma was collected using a 25 μm diameter quartz optical fiber cable positioned at dis- tance of 12.5 mm normal to the laser axis and arranged to observe a circle of cross section of only 2 mm in front of the target. The identification of the different lines was carried out by spectrum analyzer software version 1.6. Other calculations were done using home-made routines under the MATLAB® package (Ver. 7). The relative re- sponse of the detection system was measured using a standard Deuterium Tungsten-Halogen calibration light source (type DH-2000-CAL). Over the entire experiment the gate time was kept at 1 μs and the delay time was changes in equal steps from 1 - 5 μs. The instrumental bandwidth was measured from the FWHM of the Hg lines and was found to be, at the wavelengths of interest, 0.12 ± 0.02 nm. 3.2. Calculation Procedures An example of the plasma emission is given at Figure 2, at different delay times. One can notice the existence of the continuum emission appeared under the lines that is decreases in advance of the delay time. Therefore, at the start of the calculations, one should remove such com- ponent. This was achieved via utilizing a home-made Figure 1. The experimental setup. Figure 2. The emitted spectra from the air plasma at the long wavelength side recorded at a delay time of 1 μs (a), delay of 3 μs (b) and delay of 5 μs (c). Copyright © 2012 SciRes. OPJ 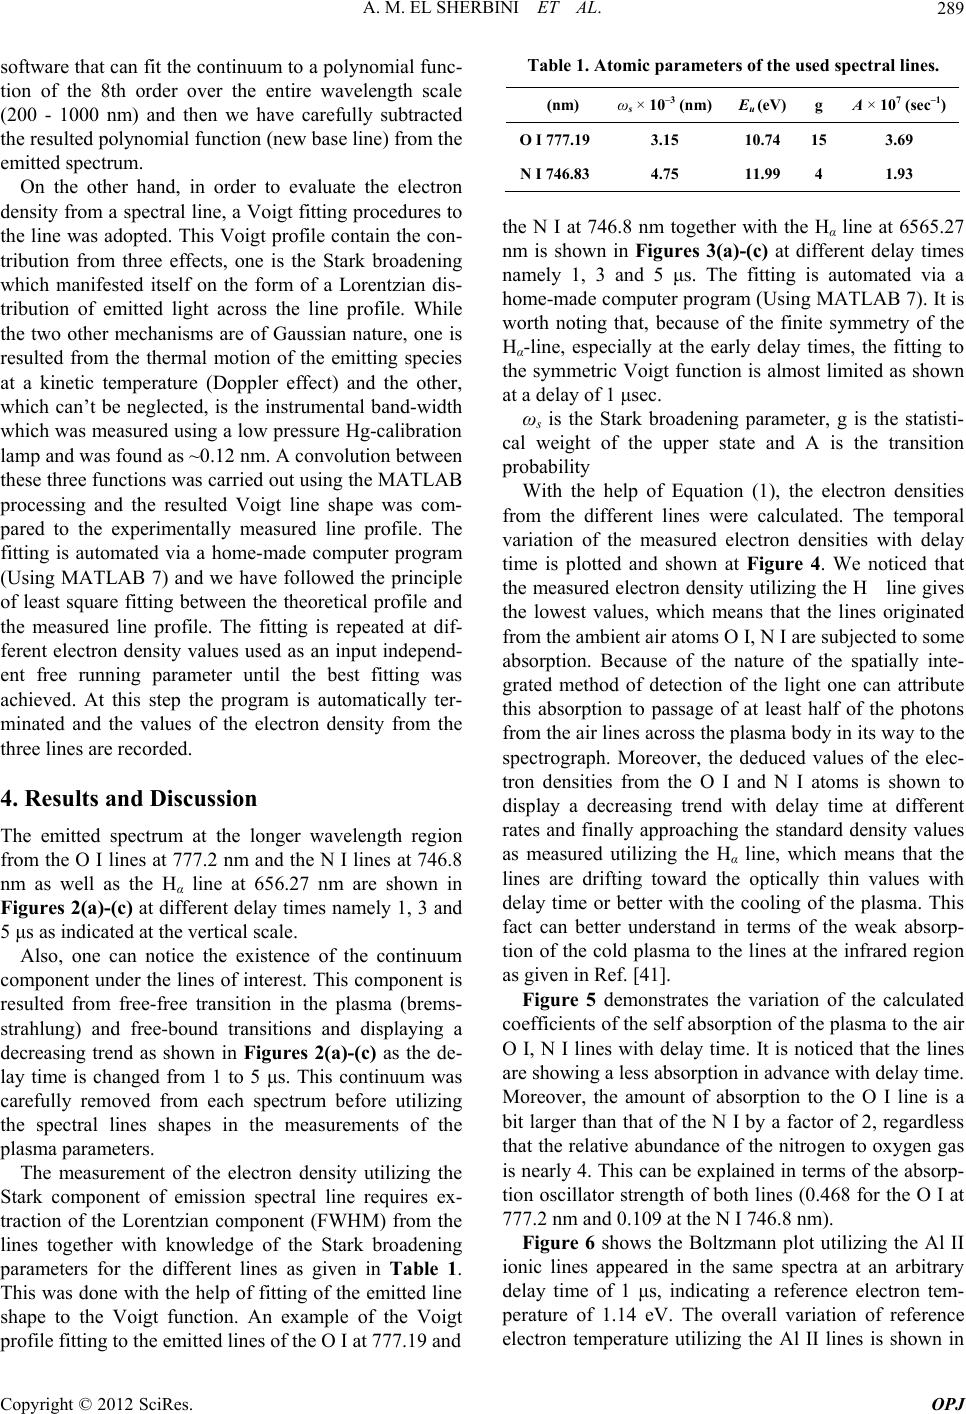 A. M. EL SHERBINI ET AL. 289 software that can fit the continuum to a polynomial func- tion of the 8th order over the entire wavelength scale (200 - 1000 nm) and then we have carefully subtracted the resulted polynomial function (new base line) from the emitted spectrum. On the other hand, in order to evaluate the electron density from a spectral line, a Voigt fitting procedures to the line was adopted. This Voigt profile contain the con- tribution from three effects, one is the Stark broadening which manifested itself on the form of a Lorentzian dis- tribution of emitted light across the line profile. While the two other mechanisms are of Gaussian nature, one is resulted from the thermal motion of the emitting species at a kinetic temperature (Doppler effect) and the other, which can’t be neglected, is the instrumental band-width which was measured using a low pressure Hg-calibration lamp and was found as ~0.12 nm. A convolution between these three functions was carried out using the MATLAB processing and the resulted Voigt line shape was com- pared to the experimentally measured line profile. The fitting is automated via a home-made computer program (Using MATLAB 7) and we have followed the principle of least square fitting between the theoretical profile and the measured line profile. The fitting is repeated at dif- ferent electron density values used as an input independ- ent free running parameter until the best fitting was achieved. At this step the program is automatically ter- minated and the values of the electron density from the three lines are recorded. 4. Results and Discussion The emitted spectrum at the longer wavelength region from the O I lines at 777.2 nm and the N I lines at 746.8 nm as well as the Hα line at 656.27 nm are shown in Figures 2(a)-(c) at different delay times namely 1, 3 and 5 μs as indicated at the vertical scale. Also, one can notice the existence of the continuum component under the lines of interest. This component is resulted from free-free transition in the plasma (brems- strahlung) and free-bound transitions and displaying a decreasing trend as shown in Figures 2(a)-(c) as the de- lay time is changed from 1 to 5 μs. This continuum was carefully removed from each spectrum before utilizing the spectral lines shapes in the measurements of the plasma parameters. The measurement of the electron density utilizing the Stark component of emission spectral line requires ex- traction of the Lorentzian component (FWHM) from the lines together with knowledge of the Stark broadening parameters for the different lines as given in Table 1. This was done with the help of fitting of the emitted line shape to the Voigt function. An example of the Voigt profile fitting to the emitted lines of the O I at 777.19 and Table 1. Atomic parameters of the used spectral lines. (nm) ωs × 10–3 (nm)Eu (eV) g A × 107 (sec–1) O I 777.193.15 10.74 15 3.69 N I 746.834.75 11.99 4 1.93 the N I at 746.8 nm together with the Hα line at 6565.27 nm is shown in Figures 3(a)-(c) at different delay times namely 1, 3 and 5 μs. The fitting is automated via a home-made computer program (Using MATLAB 7). It is worth noting that, because of the finite symmetry of the Hα-line, especially at the early delay times, the fitting to the symmetric Voigt function is almost limited as shown at a delay of 1 μsec. ωs is the Stark broadening parameter, g is the statisti- cal weight of the upper state and A is the transition probability With the help of Equation (1), the electron densities from the different lines were calculated. The temporal variation of the measured electron densities with delay time is plotted and shown at Figure 4. We noticed that the measured electron density utilizing the H line gives the lowest values, which means that the lines originated from the ambient air atoms O I, N I are subjected to some absorption. Because of the nature of the spatially inte- grated method of detection of the light one can attribute this absorption to passage of at least half of the photons from the air lines across the plasma body in its way to the spectrograph. Moreover, the deduced values of the elec- tron densities from the O I and N I atoms is shown to display a decreasing trend with delay time at different rates and finally approaching the standard density values as measured utilizing the Hα line, which means that the lines are drifting toward the optically thin values with delay time or better with the cooling of the plasma. This fact can better understand in terms of the weak absorp- tion of the cold plasma to the lines at the infrared region as given in Ref. [41]. Figure 5 demonstrates the variation of the calculated coefficients of the self absorption of the plasma to the air O I, N I lines with delay time. It is noticed that the lines are showing a less absorption in advance with delay time. Moreover, the amount of absorption to the O I line is a bit larger than that of the N I by a factor of 2, regardless that the relative abundance of the nitrogen to oxygen gas is nearly 4. This can be explained in terms of the absorp- tion oscillator strength of both lines (0.468 for the O I at 777.2 nm and 0.109 at the N I 746.8 nm). Figure 6 shows the Boltzmann plot utilizing the Al II ionic lines appeared in the same spectra at an arbitrary delay time of 1 μs, indicating a reference electron tem- perature of 1.14 eV. The overall variation of reference electron temperature utilizing the Al II lines is shown in Copyright © 2012 SciRes. OPJ 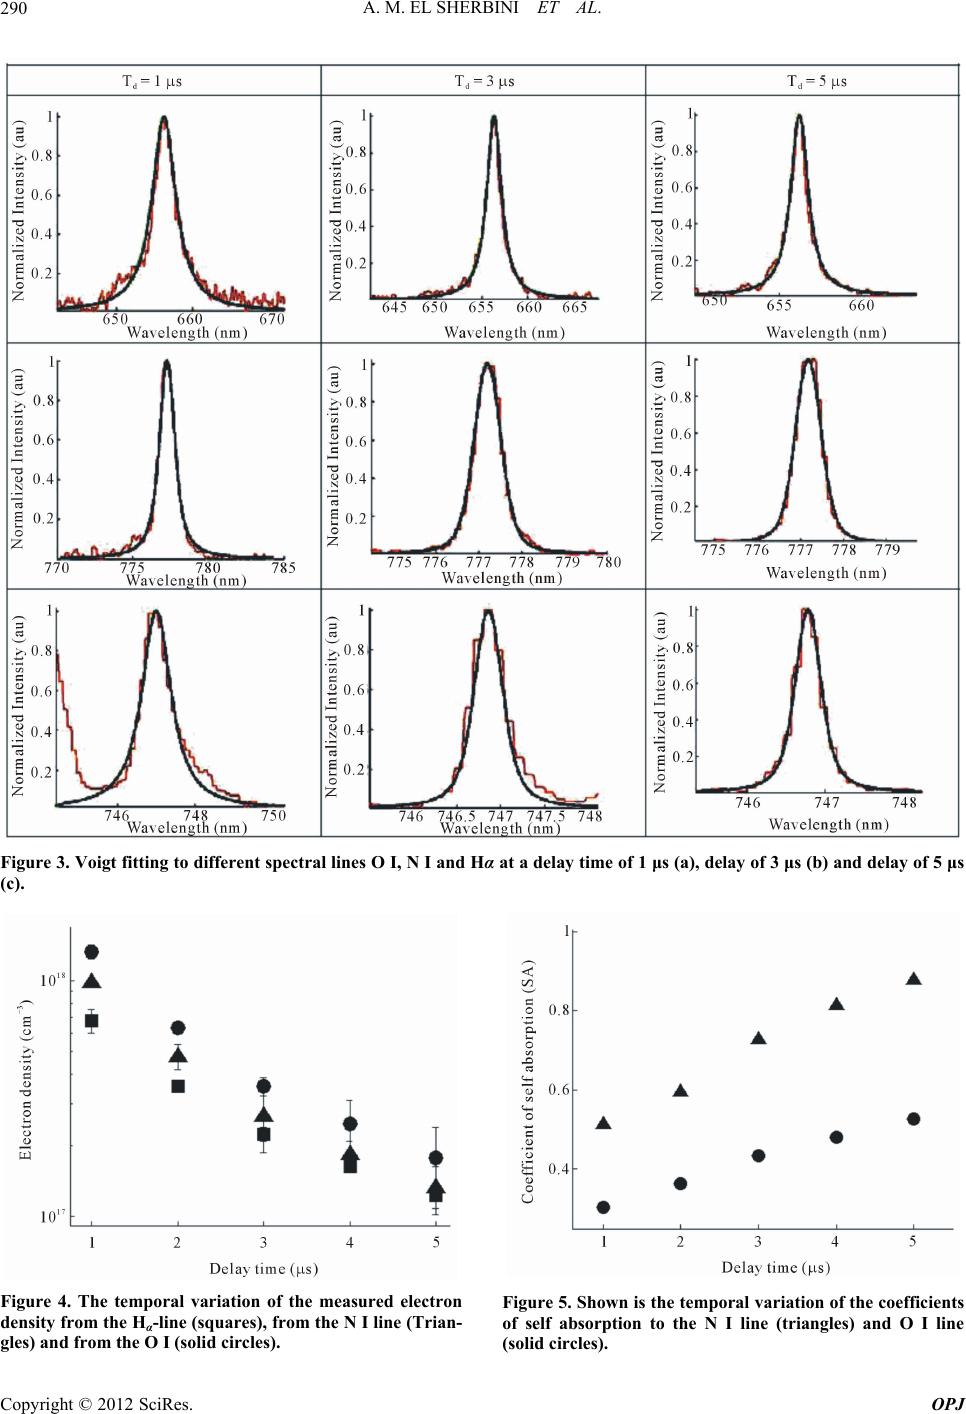 A. M. EL SHERBINI ET AL. Copyright © 2012 SciRes. OPJ 290 Figure 3. Voigt fitting to different spectral lines O I, N I and Hα at a delay time of 1 μs (a), delay of 3 μs (b) and delay of 5 μs (c). Figure 4. The temporal variation of the measured electron density from the Hα-line (squares), from the N I line (Trian- gles) and from the O I (solid circles). Figure 5. Shown is the temporal variation of the coefficients of self absorption to the N I line (triangles) and O I line (solid circles). 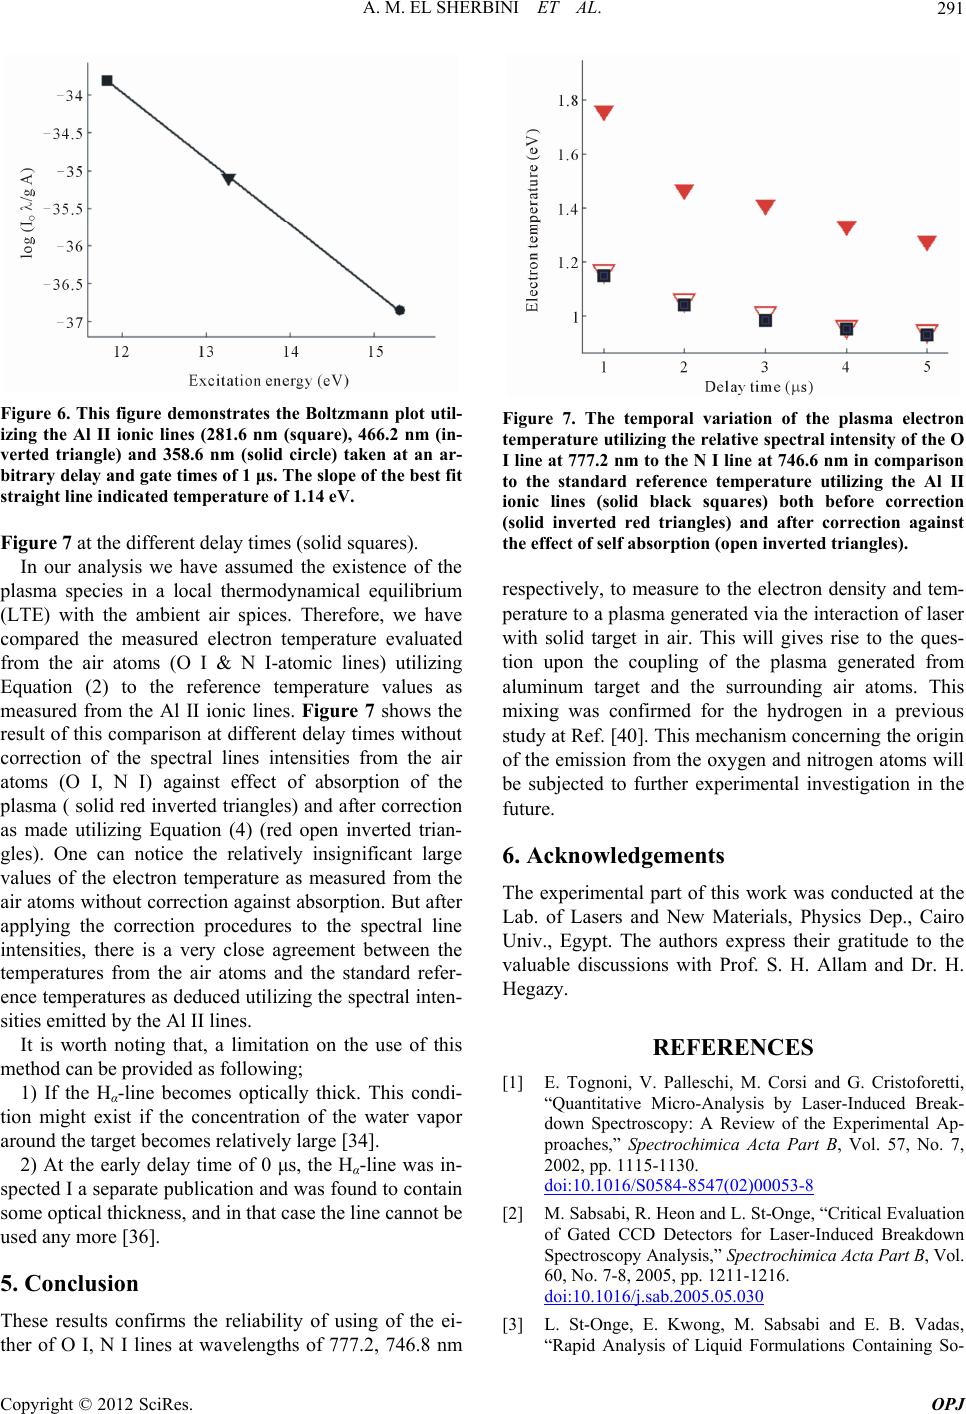 A. M. EL SHERBINI ET AL. 291 Figure 6. This figure demonstrates the Boltzmann plot util- izing the Al II ionic lines (281.6 nm (square), 466.2 nm (in- verted triangle) and 358.6 nm (solid circle) taken at an ar- bitrary delay and gate times of 1 μs. The slope of the best fit straight line indicated temperature of 1.14 eV. Figure 7 at the different delay times (solid squares). In our analysis we have assumed the existence of the plasma species in a local thermodynamical equilibrium (LTE) with the ambient air spices. Therefore, we have compared the measured electron temperature evaluated from the air atoms (O I & N I-atomic lines) utilizing Equation (2) to the reference temperature values as measured from the Al II ionic lines. Figure 7 shows the result of this comparison at different delay times without correction of the spectral lines intensities from the air atoms (O I, N I) against effect of absorption of the plasma ( solid red inverted triangles) and after correction as made utilizing Equation (4) (red open inverted trian- gles). One can notice the relatively insignificant large values of the electron temperature as measured from the air atoms without correction against absorption. But after applying the correction procedures to the spectral line intensities, there is a very close agreement between the temperatures from the air atoms and the standard refer- ence temperatures as deduced utilizing the spectral inten- sities emitted by the Al II lines. It is worth noting that, a limitation on the use of this method can be provided as following; 1) If the Hα-line becomes optically thick. This condi- tion might exist if the concentration of the water vapor around the target becomes relatively large [34]. 2) At the early delay time of 0 μs, the Hα-line was in- spected I a separate publication and was found to contain some optical thickness, and in that case the line cannot be used any more [36]. 5. Conclusion These results confirms the reliability of using of the ei- ther of O I, N I lines at wavelengths of 777.2, 746.8 nm Figure 7. The temporal variation of the plasma electron temperature utilizing the relative spectral intensity of the O I line at 777.2 nm to the N I line at 746.6 nm in comparison to the standard reference temperature utilizing the Al II ionic lines (solid black squares) both before correction (solid inverted red triangles) and after correction against the effect of self absorption (open inverted triangles). respectively, to measure to the electron density and tem- perature to a plasma generated via the interaction of laser with solid target in air. This will gives rise to the ques- tion upon the coupling of the plasma generated from aluminum target and the surrounding air atoms. This mixing was confirmed for the hydrogen in a previous study at Ref. [40]. This mechanism concerning the origin of the emission from the oxygen and nitrogen atoms will be subjected to further experimental investigation in the future. 6. Acknowledgements The experimental part of this work was conducted at the Lab. of Lasers and New Materials, Physics Dep., Cairo Univ., Egypt. The authors express their gratitude to the valuable discussions with Prof. S. H. Allam and Dr. H. Hegazy. REFERENCES [1] E. Tognoni, V. Palleschi, M. Corsi and G. Cristoforetti, “Quantitative Micro-Analysis by Laser-Induced Break- down Spectroscopy: A Review of the Experimental Ap- proaches,” Spectrochimica Acta Part B, Vol. 57, No. 7, 2002, pp. 1115-1130. doi:10.1016/S0584-8547(02)00053-8 [2] M. Sabsabi, R. Heon and L. St-Onge, “Critical Evaluation of Gated CCD Detectors for Laser-Induced Breakdown Spectroscopy Analysis,” Spectrochimica Acta Part B, Vol. 60, No. 7-8, 2005, pp. 1211-1216. doi:10.1016/j.sab.2005.05.030 [3] L. St-Onge, E. Kwong, M. Sabsabi and E. B. Vadas, “Rapid Analysis of Liquid Formulations Containing So- Copyright © 2012 SciRes. OPJ 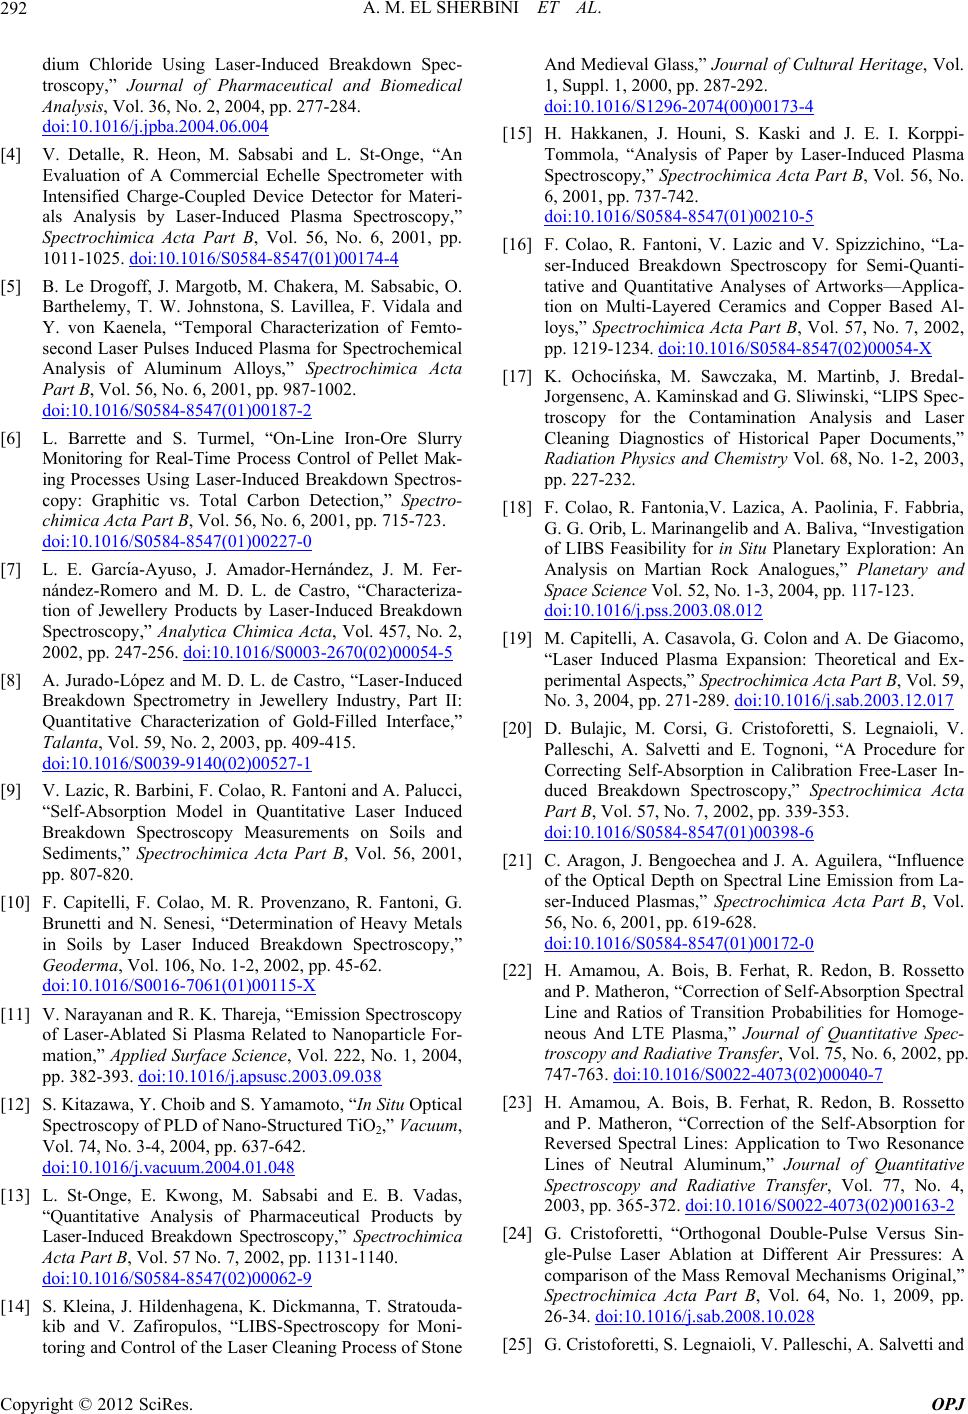 A. M. EL SHERBINI ET AL. 292 dium Chloride Using Laser-Induced Breakdown Spec- troscopy,” Journal of Pharmaceutical and Biomedical Analysis, Vol. 36, No. 2, 2004, pp. 277-284. doi:10.1016/j.jpba.2004.06.004 [4] V. Detalle, R. Heon, M. Sabsabi and L. St-Onge, “An Evaluation of A Commercial Echelle Spectrometer with Intensified Charge-Coupled Device Detector for Materi- als Analysis by Laser-Induced Plasma Spectroscopy,” Spectrochimica Acta Part B, Vol. 56, No. 6, 2001, pp. 1011-1025. doi:10.1016/S0584-8547(01)00174-4 [5] B. Le Drogoff, J. Margotb, M. Chakera, M. Sabsabic, O. Barthelemy, T. W. Johnstona, S. Lavillea, F. Vidala and Y. von Kaenela, “Temporal Characterization of Femto- second Laser Pulses Induced Plasma for Spectrochemical Analysis of Aluminum Alloys,” Spectrochimica Acta Part B, Vol. 56, No. 6, 2001, pp. 987-1002. doi:10.1016/S0584-8547(01)00187-2 [6] L. Barrette and S. Turmel, “On-Line Iron-Ore Slurry Monitoring for Real-Time Process Control of Pellet Mak- ing Processes Using Laser-Induced Breakdown Spectros- copy: Graphitic vs. Total Carbon Detection,” Spectro- chimica Acta Part B, Vol. 56, No. 6, 2001, pp. 715-723. doi:10.1016/S0584-8547(01)00227-0 [7] L. E. Garcı́a-Ayuso, J. Amador-Hernández, J. M. Fer- nández-Romero and M. D. L. de Castro, “Characteriza- tion of Jewellery Products by Laser-Induced Breakdown Spectroscopy,” Analytica Chimica Acta, Vol. 457, No. 2, 2002, pp. 247-256. doi:10.1016/S0003-2670(02)00054-5 [8] A. Jurado-López and M. D. L. de Castro, “Laser-Induced Breakdown Spectrometry in Jewellery Industry, Part II: Quantitative Characterization of Gold-Filled Interface,” Talanta, Vol. 59, No. 2, 2003, pp. 409-415. doi:10.1016/S0039-9140(02)00527-1 [9] V. Lazic, R. Barbini, F. Colao, R. Fantoni and A. Palucci, “Self-Absorption Model in Quantitative Laser Induced Breakdown Spectroscopy Measurements on Soils and Sediments,” Spectrochimica Acta Part B, Vol. 56, 2001, pp. 807-820. [10] F. Capitelli, F. Colao, M. R. Provenzano, R. Fantoni, G. Brunetti and N. Senesi, “Determination of Heavy Metals in Soils by Laser Induced Breakdown Spectroscopy,” Geoderma, Vol. 106, No. 1-2, 2002, pp. 45-62. doi:10.1016/S0016-7061(01)00115-X [11] V. Narayanan and R. K. Thareja, “Emission Spectroscopy of Laser-Ablated Si Plasma Related to Nanoparticle For- mation,” Applied Surface Science, Vol. 222, No. 1, 2004, pp. 382-393. doi:10.1016/j.apsusc.2003.09.038 [12] S. Kitazawa, Y. Choib and S. Yamamoto, “In Situ Optical Spectroscopy of PLD of Nano-Structured TiO2,” Vacuum, Vol. 74, No. 3-4, 2004, pp. 637-642. doi:10.1016/j.vacuum.2004.01.048 [13] L. St-Onge, E. Kwong, M. Sabsabi and E. B. Vadas, “Quantitative Analysis of Pharmaceutical Products by Laser-Induced Breakdown Spectroscopy,” Spectrochimica Acta Part B, Vol. 57 No. 7, 2002, pp. 1131-1140. doi:10.1016/S0584-8547(02)00062-9 [14] S. Kleina, J. Hildenhagena, K. Dickmanna, T. Stratouda- kib and V. Zafiropulos, “LIBS-Spectroscopy for Moni- toring and Control of the Laser Cleaning Process of Stone And Medieval Glass,” Journal of Cultural Heritage, Vol. 1, Suppl. 1, 2000, pp. 287-292. doi:10.1016/S1296-2074(00)00173-4 [15] H. Hakkanen, J. Houni, S. Kaski and J. E. I. Korppi- Tommola, “Analysis of Paper by Laser-Induced Plasma Spectroscopy,” Spectrochimica Acta Part B, Vol. 56, No. 6, 2001, pp. 737-742. doi:10.1016/S0584-8547(01)00210-5 [16] F. Colao, R. Fantoni, V. Lazic and V. Spizzichino, “La- ser-Induced Breakdown Spectroscopy for Semi-Quanti- tative and Quantitative Analyses of Artworks—Applica- tion on Multi-Layered Ceramics and Copper Based Al- loys,” Spectrochimica Acta Part B, Vol. 57, No. 7, 2002, pp. 1219-1234. doi:10.1016/S0584-8547(02)00054-X [17] K. Ochocińska, M. Sawczaka, M. Martinb, J. Bredal- Jorgensenc, A. Kaminskad and G. Sliwinski, “LIPS Spec- troscopy for the Contamination Analysis and Laser Cleaning Diagnostics of Historical Paper Documents,” Radiation Physics and Chemistry Vol. 68, No. 1-2, 2003, pp. 227-232. [18] F. Colao, R. Fantonia,V. Lazica, A. Paolinia, F. Fabbria, G. G. Orib, L. Marinangelib and A. Baliva, “Investigation of LIBS Feasibility for in Situ Planetary Exploration: An Analysis on Martian Rock Analogues,” Planetary and Space Science Vol. 52, No. 1-3, 2004, pp. 117-123. doi:10.1016/j.pss.2003.08.012 [19] M. Capitelli, A. Casavola, G. Colon and A. De Giacomo, “Laser Induced Plasma Expansion: Theoretical and Ex- perimental Aspects,” Spectrochimica Acta Part B, Vol. 59, No. 3, 2004, pp. 271-289. doi:10.1016/j.sab.2003.12.017 [20] D. Bulajic, M. Corsi, G. Cristoforetti, S. Legnaioli, V. Palleschi, A. Salvetti and E. Tognoni, “A Procedure for Correcting Self-Absorption in Calibration Free-Laser In- duced Breakdown Spectroscopy,” Spectrochimica Acta Part B, Vol. 57, No. 7, 2002, pp. 339-353. doi:10.1016/S0584-8547(01)00398-6 [21] C. Aragon, J. Bengoechea and J. A. Aguilera, “Influence of the Optical Depth on Spectral Line Emission from La- ser-Induced Plasmas,” Spectrochimica Acta Part B, Vol. 56, No. 6, 2001, pp. 619-628. doi:10.1016/S0584-8547(01)00172-0 [22] H. Amamou, A. Bois, B. Ferhat, R. Redon, B. Rossetto and P. Matheron, “Correction of Self-Absorption Spectral Line and Ratios of Transition Probabilities for Homoge- neous And LTE Plasma,” Journal of Quantitative Spec- troscopy and Radiative Transfer, Vol. 75, No. 6, 2002, pp. 747-763. doi:10.1016/S0022-4073(02)00040-7 [23] H. Amamou, A. Bois, B. Ferhat, R. Redon, B. Rossetto and P. Matheron, “Correction of the Self-Absorption for Reversed Spectral Lines: Application to Two Resonance Lines of Neutral Aluminum,” Journal of Quantitative Spectroscopy and Radiative Transfer, Vol. 77, No. 4, 2003, pp. 365-372. doi:10.1016/S0022-4073(02)00163-2 [24] G. Cristoforetti, “Orthogonal Double-Pulse Versus Sin- gle-Pulse Laser Ablation at Different Air Pressures: A comparison of the Mass Removal Mechanisms Original,” Spectrochimica Acta Part B, Vol. 64, No. 1, 2009, pp. 26-34. doi:10.1016/j.sab.2008.10.028 [25] G. Cristoforetti, S. Legnaioli, V. Palleschi, A. Salvetti and Copyright © 2012 SciRes. OPJ 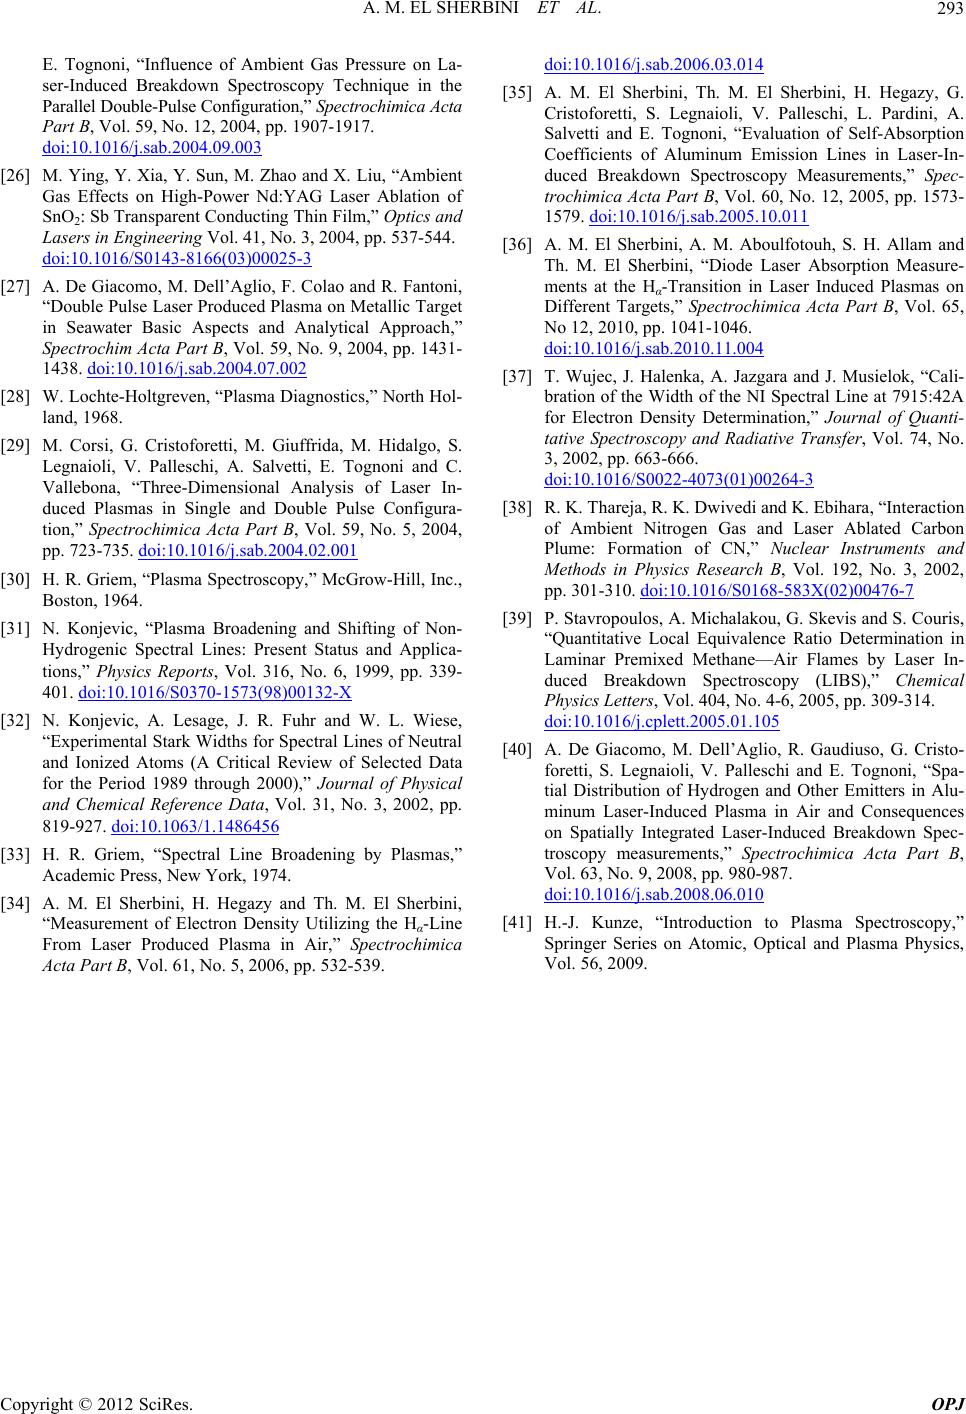 A. M. EL SHERBINI ET AL. Copyright © 2012 SciRes. OPJ 293 E. Tognoni, “Influence of Ambient Gas Pressure on La- ser-Induced Breakdown Spectroscopy Technique in the Parallel Double-Pulse Configuration,” Spectrochimica Acta Part B, Vol. 59, No. 12, 2004, pp. 1907-1917. doi:10.1016/j.sab.2004.09.003 [26] M. Ying, Y. Xia, Y. Sun, M. Zhao and X. Liu, “Ambient Gas Effects on High-Power Nd:YAG Laser Ablation of SnO2: Sb Transparent Conducting Thin Film,” Optics and Lasers in Engineering Vol. 41, No. 3, 2004, pp. 537-544. doi:10.1016/S0143-8166(03)00025-3 [27] A. De Giacomo, M. Dell’Aglio, F. Colao and R. Fantoni, “Double Pulse Laser Produced Plasma on Metallic Target in Seawater Basic Aspects and Analytical Approach,” Spectrochim Acta Part B, Vol. 59, No. 9, 2004, pp. 1431- 1438. doi:10.1016/j.sab.2004.07.002 [28] W. Lochte-Holtgreven, “Plasma Diagnostics,” North Hol- land, 1968. [29] M. Corsi, G. Cristoforetti, M. Giuffrida, M. Hidalgo, S. Legnaioli, V. Palleschi, A. Salvetti, E. Tognoni and C. Vallebona, “Three-Dimensional Analysis of Laser In- duced Plasmas in Single and Double Pulse Configura- tion,” Spectrochimica Acta Part B, Vol. 59, No. 5, 2004, pp. 723-735. doi:10.1016/j.sab.2004.02.001 [30] H. R. Griem, “Plasma Spectroscopy,” McGrow-Hill, Inc., Boston, 1964. [31] N. Konjevic, “Plasma Broadening and Shifting of Non- Hydrogenic Spectral Lines: Present Status and Applica- tions,” Physics Reports, Vol. 316, No. 6, 1999, pp. 339- 401. doi:10.1016/S0370-1573(98)00132-X [32] N. Konjevic, A. Lesage, J. R. Fuhr and W. L. Wiese, “Experimental Stark Widths for Spectral Lines of Neutral and Ionized Atoms (A Critical Review of Selected Data for the Period 1989 through 2000),” Journal of Physical and Chemical Reference Data, Vol. 31, No. 3, 2002, pp. 819-927. doi:10.1063/1.1486456 [33] H. R. Griem, “Spectral Line Broadening by Plasmas,” Academic Press, New York, 1974. [34] A. M. El Sherbini, H. Hegazy and Th. M. El Sherbini, “Measurement of Electron Density Utilizing the Hα-Line From Laser Produced Plasma in Air,” Spectrochimica Acta Part B, Vol. 61, No. 5, 2006, pp. 532-539. doi:10.1016/j.sab.2006.03.014 [35] A. M. El Sherbini, Th. M. El Sherbini, H. Hegazy, G. Cristoforetti, S. Legnaioli, V. Palleschi, L. Pardini, A. Salvetti and E. Tognoni, “Evaluation of Self-Absorption Coefficients of Aluminum Emission Lines in Laser-In- duced Breakdown Spectroscopy Measurements,” Spec- trochimica Acta Part B, Vol. 60, No. 12, 2005, pp. 1573- 1579. doi:10.1016/j.sab.2005.10.011 [36] A. M. El Sherbini, A. M. Aboulfotouh, S. H. Allam and Th. M. El Sherbini, “Diode Laser Absorption Measure- ments at the Hα-Transition in Laser Induced Plasmas on Different Targets,” Spectrochimica Acta Part B, Vol. 65, No 12, 2010, pp. 1041-1046. doi:10.1016/j.sab.2010.11.004 [37] T. Wujec, J. Halenka, A. Jazgara and J. Musielok, “Cali- bration of the Width of the NI Spectral Line at 7915:42A for Electron Density Determination,” Journal of Quanti- tative Spectroscopy and Radiative Transfer, Vol. 74, No. 3, 2002, pp. 663-666. doi:10.1016/S0022-4073(01)00264-3 [38] R. K. Thareja, R. K. Dwivedi and K. Ebihara, “Interaction of Ambient Nitrogen Gas and Laser Ablated Carbon Plume: Formation of CN,” Nuclear Instruments and Methods in Physics Research B, Vol. 192, No. 3, 2002, pp. 301-310. doi:10.1016/S0168-583X(02)00476-7 [39] P. Stavropoulos, A. Michalakou, G. Skevis and S. Couris, “Quantitative Local Equivalence Ratio Determination in Laminar Premixed Methane—Air Flames by Laser In- duced Breakdown Spectroscopy (LIBS),” Chemical Physics Letters, Vol. 404, No. 4-6, 2005, pp. 309-314. doi:10.1016/j.cplett.2005.01.105 [40] A. De Giacomo, M. Dell’Aglio, R. Gaudiuso, G. Cristo- foretti, S. Legnaioli, V. Palleschi and E. Tognoni, “Spa- tial Distribution of Hydrogen and Other Emitters in Alu- minum Laser-Induced Plasma in Air and Consequences on Spatially Integrated Laser-Induced Breakdown Spec- troscopy measurements,” Spectrochimica Acta Part B, Vol. 63, No. 9, 2008, pp. 980-987. doi:10.1016/j.sab.2008.06.010 [41] H.-J. Kunze, “Introduction to Plasma Spectroscopy,” Springer Series on Atomic, Optical and Plasma Physics, Vol. 56, 2009. |