

Paper Menu >>
Journal Menu >>
 Optics and Photonics Journal, 2012, 2, 278-285 http://dx.doi.org/10.4236/opj.2012.24034 Published Online December 2012 (http://www.SciRP.org/journal/opj) Measurements of Plasma Electron Temperature Utilizing Magnesium Lines Appeared in Laser Produced Aluminum Plasma in Air Ashraf M. El Sherbini1,2, Abdel Aziz Saad Al Amer1, Ahmed T. Hassan1,2, Tharwat M. El Sherbini2 1Department of Physics, Collage of Science, Al Imam Muhammad Ibn Saud Islamic University (AIMSIU), Al Riyadh, KSA 2Laboratory of Lasers and New Materials (LLNM), Department of Physics, Faculty of Science, Cairo University, Giza, Egypt Email: [email protected] Received August 14, 2012; revised September 16, 2012; accepted October 2, 2012 ABSTRACT We have utilized the relative intensity of magnesium lines originated from the Mg I at 285.2 nm and Mg II at 280.27, 279.55 nm to measure the plasma electron temperature. The plasma was produced via interaction of Nd:YAG laser with solid aluminum target contains traces of magnesium. The magnesium lines were found to suffer from optical thickness which manifests itself on the form of scattered points around the Saha-Boltzmann line. We have utilized a simple method used for rapid calculation to the amount of absorption to these lines via comparison of the electron densities as deduced from magnesium lines to that evaluated from the optically thin hydrogen Hα line at 656.27 nm appeared in the same spectra under the same condition. A correction to the magnesium spectral lines intensities was carried out; hence the corrected temperatures were re-evaluated. The measurements were repeated at different delay times ranging from 1 to 5 μsec. This work emphasizes on the importance of correcting the emitted spectral line intensity against the effect of self absorption before using them in the calculation of plasma electron temperature in laser induced breakdown spec- troscopy (LIBS) experiments. Keywords: LIBS; Self Absorption; Mg-Lines; Plasma Parameters 1. Introduction The LIBS technique is one of the potentially growing applied techniques used in the field of elemental analysis, because of its simplicity and non-contact nature [1-10]. Its basic principle is based on exciting matter (solid, liq- uid or gas) to plasma state through irradiation by high power laser pulses. The diagnostics of the plasma can be done through the measurements of electron density (ne) and temperature (Te). The optical emission spectroscopy (OES) is the tool by which the plasma can be diagnosed [11]. The meas- urement of the electron density through Stark broadening effect requires a line which is free from self absorption [12,13]. Self absorption occurs in general in any kind of system capable of emitting radiation, such as plasma. Moreover, the formation of the plasma in air shows, in general, a strong gradient of temperature due to the cool- ing effect of the surrounding air [14]. These cold periph- eries of the plasma contain a high concentration of the atoms at the low laying atomic states which can cause a strong re-absorption to the emitted radiation lines [15- 17]. It was found that, especially the resonance and strong lines are more likely to be subjected to self ab- sorbed. The Mg II ionic lines are a good example of this effect because they are either a resonance lines like; the h and k lines at 279.55 and 280.27 nm respectively, or they are relatively intense. However, these lines would be good candidates for calculating the plasma electron tem- perature. The wavelength separation is very small as well as their separation in the upper excited states is relatively large with respect to the expected plasma temperature (~ 1 eV) [11,18,19]. Moreover, the h and k resonance lines belong to the most exploited lines in astrophysical plasma diagnostics [18] and therefore, they are also of the interest in astrophysical plasma at large temperatures. Moreover, the Stark broadening of these lines are well known at electron density higher than 1015 cm–3 [18]. On the other hand the appearance of the Mg I-resonance line at 285.2 nm provides a assurance chance to construct the Saha-Boltzmann plot with the help of the Mg II lines, but unfortunately this line is a resonance line, hence one should expect that it may be subjected to the effect of self absorption. It was suggested in Ref’s [12,20,21], that the use of the C opyright © 2012 SciRes. OPJ 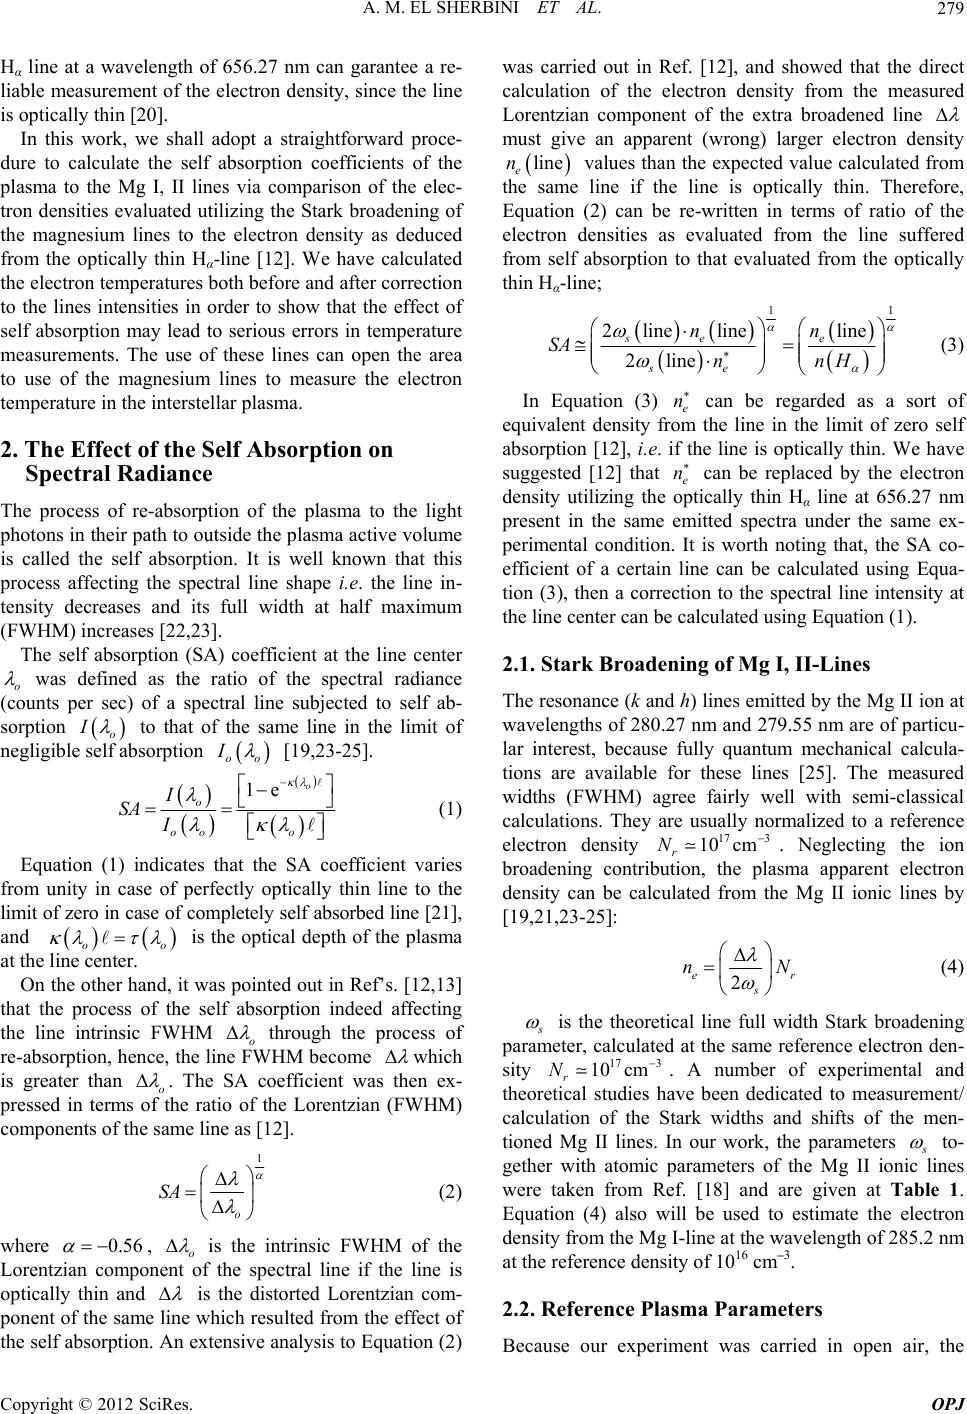 A. M. EL SHERBINI ET AL. 279 Hα line at a wavelength of 656.27 nm can garantee a re- liable measurement of the electron density, since the line is optically thin [20]. In this work, we shall adopt a straightforward proce- dure to calculate the self absorption coefficients of the plasma to the Mg I, II lines via comparison of the elec- tron densities evaluated utilizing the Stark broadening of the magnesium lines to the electron density as deduced from the optically thin Hα-line [12]. We have calculated the electron temperatures both before and after correction to the lines intensities in order to show that the effect of self absorption may lead to serious errors in temperature measurements. The use of these lines can open the area to use of the magnesium lines to measure the electron temperature in the interstellar plasma. 2. The Effect of the Self Absorption on Spectral Radiance The process of re-absorption of the plasma to the light photons in their path to outside the plasma active volume is called the self absorption. It is well known that this process affecting the spectral line shape i.e. the line in- tensity decreases and its full width at half maximum (FWHM) increases [22,23]. The self absorption (SA) coefficient at the line center o was defined as the ratio of the spectral radiance (counts per sec) of a spectral line subjected to self ab- sorption o I to that of the same line in the limit of negligible self absorption oo I [19,23-25]. 1e o o oo o I SA I (1) Equation (1) indicates that the SA coefficient varies from unity in case of perfectly optically thin line to the limit of zero in case of completely self absorbed line [21], and is the optical depth of the plasma at the line center. o o On the other hand, it was pointed out in Ref’s. [12,13] that the process of the self absorption indeed affecting the line intrinsic FWHM o through the process of re-absorption, hence, the line FWHM become which is greater than o . The SA coefficient was then ex- pressed in terms of the ratio of the Lorentzian (FWHM) components of the same line as [12]. 1 o SA (2) where 0.56 , o is the intrinsic FWHM of the Lorentzian component of the spectral line if the line is optically thin and is the distorted Lorentzian com- ponent of the same line which resulted from the effect of the self absorption. An extensive analysis to Equation (2) was carried out in Ref. [12], and showed that the direct calculation of the electron density from the measured Lorentzian component of the extra broadened line must give an apparent (wrong) larger electron density line e n values than the expected value calculated from the same line if the line is optically thin. Therefore, Equation (2) can be re-written in terms of ratio of the electron densities as evaluated from the line suffered from self absorption to that evaluated from the optically thin Hα-line; 1 1 2 linelineline 2line se e se nn SA nH n (3) In Equation (3) e n can be regarded as a sort of equivalent density from the line in the limit of zero self absorption [12], i.e. if the line is optically thin. We have suggested [12] that e n can be replaced by the electron density utilizing the optically thin Hα line at 656.27 nm present in the same emitted spectra under the same ex- perimental condition. It is worth noting that, the SA co- efficient of a certain line can be calculated using Equa- tion (3), then a correction to the spectral line intensity at the line center can be calculated using Equation (1). 2.1. Stark Broadening of Mg I, II-Lines The resonance (k and h) lines emitted by the Mg II ion at wavelengths of 280.27 nm and 279.55 nm are of particu- lar interest, because fully quantum mechanical calcula- tions are available for these lines [25]. The measured widths (FWHM) agree fairly well with semi-classical calculations. They are usually normalized to a reference electron density . Neglecting the ion broadening contribution, the plasma apparent electron density can be calculated from the Mg II ionic lines by [19,21,23-25]: 17 3 10 cm r N 2 e s n r N (4) s is the theoretical line full width Stark broadening parameter, calculated at the same reference electron den- sity 17 3 10 cm r N . A number of experimental and theoretical studies have been dedicated to measurement/ calculation of the Stark widths and shifts of the men- tioned Mg II lines. In our work, the parameters s to- gether with atomic parameters of the Mg II ionic lines were taken from Ref. [18] and are given at Table 1. Equation (4) also will be used to estimate the electron density from the Mg I-line at the wavelength of 285.2 nm at the reference density of 1016 cm–3. 2.2. Reference Plasma Parameters Because our experiment was carried in open air, the Copyright © 2012 SciRes. OPJ 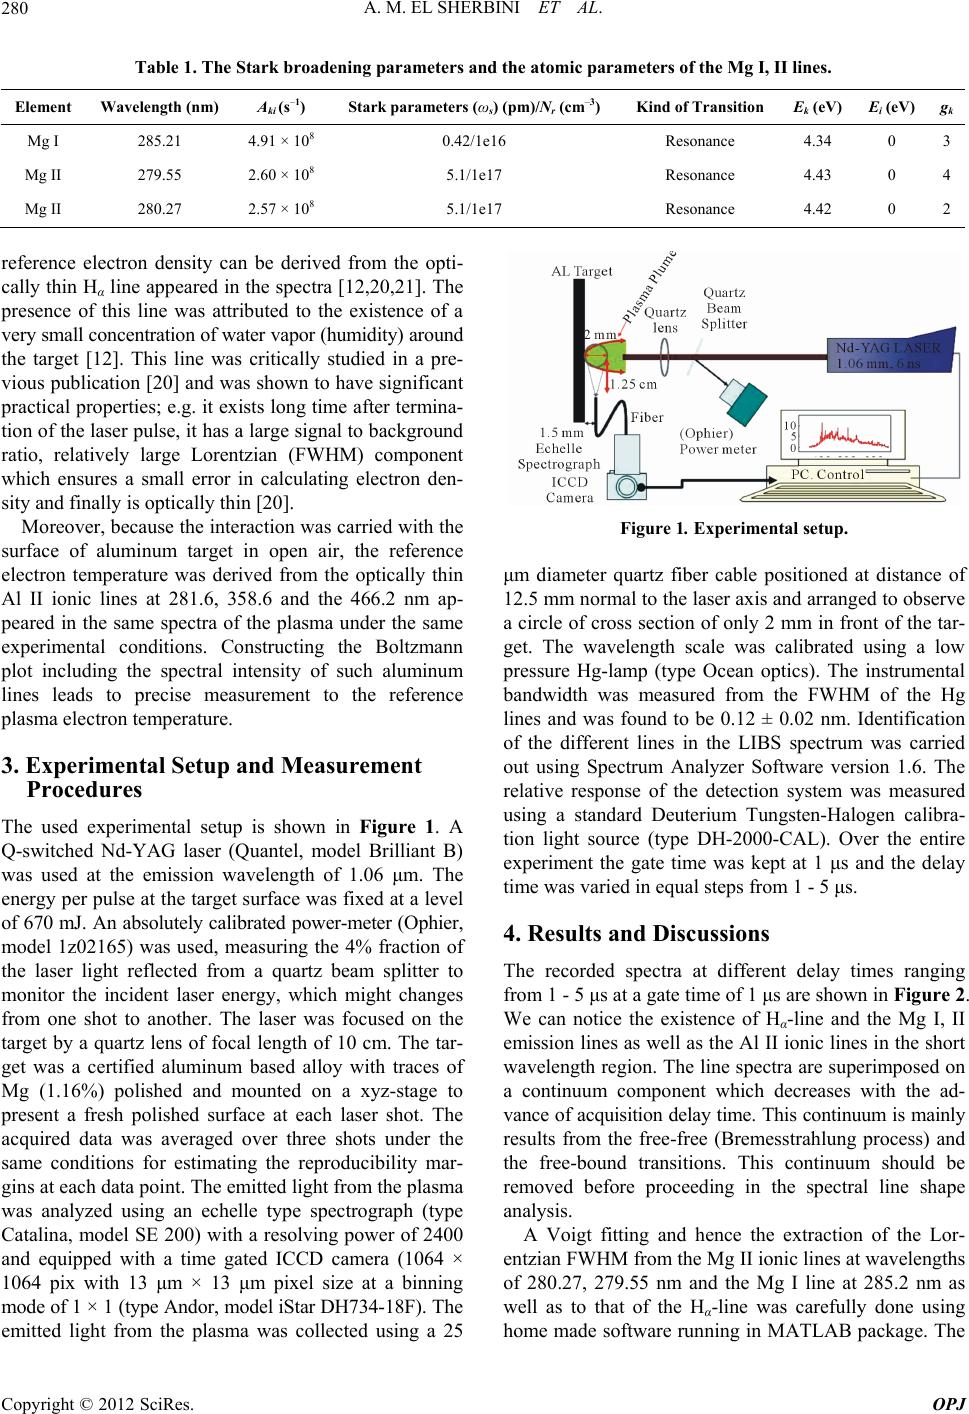 A. M. EL SHERBINI ET AL. Copyright © 2012 SciRes. OPJ 280 Table 1. The Stark broadening parameters and the atomic parameters of the Mg I, II lines. Element Wavelength (nm) Aki (s–1) Stark parameters (ωs) (pm)/Nr (cm–3) Kind of Transition Ek (eV) Ei (eV)gk Mg I 285.21 4.91 × 10⁸ 0.42/1e16 Resonance 4.34 0 3 Mg II 279.55 2.60 × 10⁸ 5.1/1e17 Resonance 4.43 0 4 Mg II 280.27 2.57 × 10⁸ 5.1/1e17 Resonance 4.42 0 2 reference electron density can be derived from the opti- cally thin Hα line appeared in the spectra [12,20,21]. The presence of this line was attributed to the existence of a very small concentration of water vapor (humidity) around the target [12]. This line was critically studied in a pre- vious publication [20] and was shown to have significant practical properties; e.g. it exists long time after termina- tion of the laser pulse, it has a large signal to background ratio, relatively large Lorentzian (FWHM) component which ensures a small error in calculating electron den- sity and finally is optically thin [20]. Moreover, because the interaction was carried with the surface of aluminum target in open air, the reference electron temperature was derived from the optically thin Al II ionic lines at 281.6, 358.6 and the 466.2 nm ap- peared in the same spectra of the plasma under the same experimental conditions. Constructing the Boltzmann plot including the spectral intensity of such aluminum lines leads to precise measurement to the reference plasma electron temperature. Figure 1. Experimental setup. μm diameter quartz fiber cable positioned at distance of 12.5 mm normal to the laser axis and arranged to observe a circle of cross section of only 2 mm in front of the tar- get. The wavelength scale was calibrated using a low pressure Hg-lamp (type Ocean optics). The instrumental bandwidth was measured from the FWHM of the Hg lines and was found to be 0.12 ± 0.02 nm. Identification of the different lines in the LIBS spectrum was carried out using Spectrum Analyzer Software version 1.6. The relative response of the detection system was measured using a standard Deuterium Tungsten-Halogen calibra- tion light source (type DH-2000-CAL). Over the entire experiment the gate time was kept at 1 μs and the delay time was varied in equal steps from 1 - 5 μs. 3. Experimental Setup and Measurement Procedures The used experimental setup is shown in Figure 1. A Q-switched Nd-YAG laser (Quantel, model Brilliant B) was used at the emission wavelength of 1.06 μm. The energy per pulse at the target surface was fixed at a level of 670 mJ. An absolutely calibrated power-meter (Ophier, model 1z02165) was used, measuring the 4% fraction of the laser light reflected from a quartz beam splitter to monitor the incident laser energy, which might changes from one shot to another. The laser was focused on the target by a quartz lens of focal length of 10 cm. The tar- get was a certified aluminum based alloy with traces of Mg (1.16%) polished and mounted on a xyz-stage to present a fresh polished surface at each laser shot. The acquired data was averaged over three shots under the same conditions for estimating the reproducibility mar- gins at each data point. The emitted light from the plasma was analyzed using an echelle type spectrograph (type Catalina, model SE 200) with a resolving power of 2400 and equipped with a time gated ICCD camera (1064 × 1064 pix with 13 μm × 13 μm pixel size at a binning mode of 1 × 1 (type Andor, model iStar DH734-18F). The emitted light from the plasma was collected using a 25 4. Results and Discussions The recorded spectra at different delay times ranging from 1 - 5 μs at a gate time of 1 μs are shown in Figure 2. We can notice the existence of Hα-line and the Mg I, II emission lines as well as the Al II ionic lines in the short wavelength region. The line spectra are superimposed on a continuum component which decreases with the ad- vance of acquisition delay time. This continuum is mainly results from the free-free (Bremesstrahlung process) and the free-bound transitions. This continuum should be removed before proceeding in the spectral line shape analysis. A Voigt fitting and hence the extraction of the Lor- entzian FWHM from the Mg II ionic lines at wavelengths of 280.27, 279.55 nm and the Mg I line at 285.2 nm as well as to that of the Hα-line was carefully done using home made software running in MATLAB package. The  A. M. EL SHERBINI ET AL. 281 Figure 2. A sample of the emission spectra from plasma at different delay times showing the different lines appeared Hα, Mg I, and Mg II as well as Al II ionic line at 281.6 nm (a); at arbitrary delay time of 5 μs (b); and the resolved lines at the short wavelength region (c). results of the best fittings to the different lines at an arbi- trary delay times of 1, 3, 5 μs and at a fixed gate time of 1 μs are shown in Figure 3. According to Equation (3), the deviation of the meas- ured electron density calculated from the Mg I, II lines with respect to that evaluated from the optically thin Hα line indicates the existence of self absorption. A plot of the apparent electron density calculated from the Lor- entzian (FWHM) component from the three Mg I, II lines, in comparison to that evaluated from the Hα are shown in Figure 4. This figure confirmed that the Mg I, II lines are influenced by the effect of the self absorption and hence the higher the observed electron densities from the mag- nesium lines. The self absorption coefficients were calculated utiliz- ing Equation (3) to the three Mg I, II lines at different delay times with the results shown in Figure 5. A loga- rithmic decrease in the SA values with delay time can be observed, indicating an increase of the optical depth of the lines with delay time. This means that as the plasma become cooler with the delay time (as a result of expan- sion) the population of the atoms in the lower state be- comes higher and hence the more the absorption. Moreover, the calculated SA values for the resonance doublets (h and k) Mg II lines shows nearly an equal de- creasing rates, which is in agreement with the known Copyright © 2012 SciRes. OPJ  A. M. EL SHERBINI ET AL. 282 Figure 3. The quality of the Voigt fitting to the different spectral Mg I , II-lines used in the investigation as well as the Hα-line at delay times of 1, 3 and 5 μs. absorption oscillator strengths of the lines (0.61 and 0.31 respectively). A correction to the Mg I, II lines spectral radiances was carried out according to Equation (1). Saha-Boltz- mann plots were constructed [26,27] with the result as shown in Figure 6, utilizing the Mg I, II lines intensities both before and after correction against effect of self ab- sorption. We can notice the scattering of the points cor- responding to emission wavelengths of 280.27 and 279.55 nm before correction against this effect. After the application of correction procedures and re-construction of the plot, the points are tending to coincide with one another forming a straight line. This figure primarily in- dicates the effectiveness of the correction process. In order to evaluate the reference electron temperature we have utilizing the spectral radiances from the Al II ionic lines at 281.6, 358.6 and the 466.2 nm to con- structed the Boltzmann line with the result as shown in Figure 7. One basic advantage of utilizing such alumi- num lines is that they are optically thin [12]. One can Copyright © 2012 SciRes. OPJ  A. M. EL SHERBINI ET AL. 283 Figure 4. The temporal variation of the measured electron densities utilizing the Hα line (lower solid squares), from the Mg I line at 285.2 nm (solid inverted triangles), from the Mg II ionic line at 279.2 nm (solid circles) and from the ionic Mg II line at 280.2 nm (solid triangles). Figure 5. A demonstration to the variation of the coeffi- cients of self absorption for from the Mg I line at 285.2 nm (solid inverted triangles), from the Mg II ionic line at 279.2 nm (solid circles) and from the ionic Mg II line at 280.2 nm (solid triangles). Figure 6. The Saha-Boltzmann plot utilizing spectral line intensities from the Mg I, II lines before correction (lower open figures) and after correction against self absorption (upper solid figure). The slope of the upper line indicates a temperature of 1.12 eV, while the lower dashed line 1.92 eV. (Squares = Mg I line at 285.2 nm, inverted triangles at Mg II 279.55 nm and the circle at Mg II 280.27 nm). Figure 7. The Boltzmann plot utilizing the Al II ionic lines (281.6 nm (square), 466.2 nm (inverted triangle) and 358.6 nm (solid circle) taken at an arbitrary delay and gate times of 1 μs. The slope of the best fit straight line indicated tem- perature of 1.14 eV. notice the existence of the points on the straight line with slope indicating the reference electron temperature. Figure 8 shows the overall temperatures variation with delay time as evaluated from the Mg I, II lines both be- fore and after correction in comparison with the refer- ence temperature as deduced from the Al II ionic lines. We can notice that, the calculated electron temperatures from the Mg II lines without correction against self ab- sorption effects are larger than after correction. This large deviation of the evaluated temperatures shows that the Mg I, II lines, should be corrected against effect of self absorption before used in plasma diagnostics. 5. Conclusion We have measured the plasma electron temperature and density utilizing three lines emerging from magnesium in LIBS experiment. The effect of the self absorption on three Mg II lines at 280.27, 279.55 and Mg I resonance line at 285.2 nm were quantified utilizing simple formu- las based on the measurement of the ratio of the apparent electron density from the lines of interest to that derived from the optically thin Hα line. The spectral line intensi- ties were then corrected. The electron temperatures were re-evaluated and compared to reference temperatures utilizing the Al II ionic lines. This comparison shows an excellent agreement between the reference temperatures and the measured utilizing the magnesium emission lines. The results shows that the Mg I, II lines appeared at the short wavelength region of the LIBS spectrum are good candidates for measuring the temperature of the plasma in LIBS experiments, but after correction against self absorption. 6. Acknowledgements The experimental part of this work was conducted at the Copyright © 2012 SciRes. OPJ  A. M. EL SHERBINI ET AL. 284 Figure 8. Presentation to the variation of the measured electron temperature with delay time utilizing Mg I, II lines after correcting spectral intensities against effect of self absorption (lower open circles), without correction (upper solid circles) and from the Al II ionic spectral line intensi- ties (red solid triangles). Laboratory of Lasers and New Materials (LLNM), Phys- ics Dep., Cairo Univ., Egypt. The authors express their gratitude to the valuable discussions with Prof. S. H. Al- lam and Dr. H. Hegazy. REFERENCES [1] S. Klein, J. Hildenhagen, K. Dickmann, T. Stratoudaki and Zafiropulos, “LIBS-Spectroscopy for Monitoring and Control of the Laser Cleaning Process of Stone and Me- dieval Glass,” Journal of Cultural Heritage, Vol. 1, Suppl. 1, 2000, pp. 287-292. doi:10.1016/S1296-2074(00)00173-4 [2] O. Samek, D. C. S. Beddows, H. H. Telle, J. Kaiser, M. Lĭska, J. O. Cáceres and A. G. Ureña, “Quantitative La- ser-Induced Breakdown Spectroscopy Analysis of Calci- fied Tissue Samples,” Spectrochimica Acta Part B, Vol. 56, No. 6, 2001, pp. 865-875 doi:10.1016/S0584-8547(01)00198-7 [3] Z. M. Madhavi, N. Labbé, G. R. Timothy and D. W. Stan, “Analysis of Preservative-Treated Wood by Multivariate Analysis of Laser-Induced Breakdown Spectroscopy Spec- tra,” Spectrochimica Acta Part B, Vol. 60, No. 7-8, 2005, pp. 1179-1185. doi:10.1016/j.sab.2005.05.022 [4] N. Carmon, M. Oujj, E. Rebollar, H. Römich and M. Castillejo, “Analysis of Corroded Glasses by Laser In- duced Breakdown Spectroscopy,” Spectrochimica Acta Part B, Vol. 60, No. 12, 2005, pp. 1155-1162. doi:10.1016/j.sab.2005.05.016 [5] L. St-Onge, E. Kwong, M. Sabsabi and E. B. Vadas, “Rapid Analysis of Liquid Formulations Containing So- dium Chloride Using Laser-Induced Breakdown Spec- troscopy,” Journal of Pharmaceutical and Biomedical Analysis, Vol. 36, No. 2, 2004, pp. 277-284. doi:10.1016/j.jpba.2004.06.004 [6] L. Barrette and S. Turmel, “On-Line Iron-Ore Slurry Monitoring for Real-Time Process Control of Pellet Mak- ing Processes Using Laser-Induced Breakdown Spec- troscopy: Graphitic vs. Total Carbon Detection,” Spec- trochimica Acta Part B, Vol. 56, No. 6, 2001, pp. 715- 723. doi:10.1016/S0584-8547(01)00227-0 [7] L. E. Garcýa-Ayuso, J. Amador-Hernández, J. M. Fer- nández-Romero and M. D. L. de Castro, “Characteriza- tion of Jewellery Products by Laser-Induced Breakdown Spectroscopy,” Analytica Chimica Acta, Vol. 457, No. 2, 2002, pp. 247-256. doi:10.1016/S0003-2670(02)00054-5 [8] A. Jurado-López and M. D Luque de Castro, “La- ser-Induced Breakdown Spectrometry in Jewellery Indus- try, Part II: Quantitative Characterization of Gold-Filled Interface,” Talanta, Vol. 59, No. 2, 2003, pp. 409-415. doi:10.1016/S0039-9140(02)00527-1 [9] F. Capitelli, F. Colao, M. R. Provenzano, R. Fantoni, G. Brunetti and N. Senesi, “Determination of Heavy Metals in Soils by Laser Induced Breakdown Spectroscopy,” Geoderma, Vol. 106, No. 1-2, 2002, pp. 45-62. doi:10.1016/S0016-7061(01)00115-X [10] I. B. Gornushkin, A. Y. Kazakov, N. Omenetto, B. W. Smith and J. D. Winefordner, “Experimental Verification of a Radiative Model of Laser-Induced Plasma Expanding into Vacuum,” Spectrochimica Acta Part B, Vol. 60, No. 2, 2005, pp. 215-230. doi:10.1016/j.sab.2004.11.009 [11] H. R. Griem, “Plasma Spectroscopy,” McGraw-Hill, Bos- ton, 1964. [12] A. M. El Sherbini, Th. M. El Sherbini, H. Hegazy, G. Cristoforetti, S. Legnaioli, V. Palleschi, L. Pardini, A. Salvetti and E. Tognoni, “Evaluation of Self-Absorption Coefficients of Aluminum Emission Lines in Laser-In- duced Breakdown Spectroscopy Measurements,” Spec- trochimica Acta Part B, Vol. 60. No. 12, 2005, pp. 1573- 1579. doi:10.1016/j.sab.2005.10.011 [13] D. Bulajic, M. Corsi, G. Cristoforetti, S. Legnaioli, V. Palleschi, A. Salvetti and E. Tognoni, “A Procedure for Correcting Self-Absorption in Calibration Free-Laser In- duced Breakdown Spectroscopy,” Spectrochimica Acta Part B, Vol. 57, No. 22, 2002, pp. 339-353. doi:10.1016/S0584-8547(01)00398-6 [14] M. J. Ying, Y. y. Xia, Y. M. Sun, M. W. Zhao and X. D. Liu, “Ambient Gas Effects on High-Power Nd:YAG La- ser Ablation of SnO2:Sb Transparent Conducting Thin Film,” Optics and Lasers in Engineering, Vol. 41, No. 3, 2004, pp. 537-544. doi:10.1016/S0143-8166(03)00025-3 [15] H. Amamou, A. Bois, B. Ferhat, R. Redon, B. Rossetto and M. Ripert, “Correction of the Self-Absorption for Re- versed Spectral Lines: Application to Two Resonance Lines of Neutral Aluminum,” Journal of Quantitative Spectroscopy and Radiative Transfer, Vol. 77, No. 4, 2003, pp. 365-372. [16] H. Amamou, A. Bois, B. Ferhat, R. Redon, B. Rossetto and P. Matheron, “Correction of Self-Absorption Spectral Line and Ratios of Transition Probabilities for Homoge- neous and LTE Plasma,” Journal of Quantitative Spec- troscopy and Radiative Transfer, Vol. 75, No. 6, 2002, pp. 747-763. [17] E. Alexandre, F. Belkacem, A. Lesage and J. Richou, “A Single Laser Spark in Aqueous Medium,” Journal of Quantitative Spectroscopy and Radiative Transfer, Vol. Copyright © 2012 SciRes. OPJ  A. M. EL SHERBINI ET AL. Copyright © 2012 SciRes. OPJ 285 64, No. 4, 2000, pp. 353-361. [18] S. Bukvic, A. Sreckovic and S. Djenize, “Mg II h and k Lines Stark Parameters,” New Astronomy, Vol. 9, No. 8, 2004, pp. 629-633. doi:10.1016/j.newast.2004.04.002 [19] W. Lochte-Holtgreven, “Plasma Diagnostics,” North Hol- land, 1968. [20] A. M. El Sherbini, H. Hegazy and Th. M. El Sherbini, “Measurement of Electron Density Utilizing the Hα-Line from Laser Produced Plasma in Air,” Spectrochimica Acta Part B, Vol. 61, No. 5, 2006, pp. 532-539. doi:10.1016/j.sab.2006.03.014 [21] D. Vincent, H. Rene, M. Sabsabi and L. St-Onge, “An Evaluation of a Commercial Echelle Spectrometer with Intensified Charge-Coupled Device Detector for Materi- als Analysis by Laser-Induced Plasma Spectroscopy,” Spectrochimica Acta Part B, Vol. 56, No. 6, 2001, pp. 1011-1025. doi:10.1016/S0584-8547(01)00174-4 [22] F. Bredice, F. O. Borges, H. Sobral, H. Villagran-Muniz, H. O. Di Rocco, G. Cristoforetti, S. Legnaioli, V. Palleschi, L. Pardini, A. Salvetti and E. Tognoni, “Evaluation of Self-Absorption of Manganese Emission Lines in La- ser-Induced Breakdown Spectroscopy Measurements,” Spectrochimica Acta Part B, Vol. 61, No. 12, 2006, pp. 1294-1303. doi:10.1016/j.sab.2006.10.015 [23] N. Konjevic, A. Lesage, J. R. Fuhr and W. L. Wiese, “Experimental Stark Widths for Spectral Lines of Neutral and Ionized Atoms (A Critical Review of Selected Data For the Period 1989 through 2000),” Journal of Physical and Chemical Reference Data, Vol. 31, No. 3, 2002, pp. 819-927. doi:10.1063/1.1486456 [24] N. Konjevic, “Plasma Broadening and Shifting of Non- Hydrogenic Spectral Lines: Present Status and Applica- tions,” Physics Reports, Vol. 316, No. 6, 1999, pp. 339- 401. doi:10.1016/S0370-1573(98)00132-X [25] H. R. Griem, “Spectral Line Broadening by Plasmas,” Academic Press, New York, 1974. [26] A. M. El Sherbini, A. M. Aboulfotouh, S. H. Allam and Th. M. El Sherbini, “Diode Laser Absorption Measure- ments at the Hα-Transition in Laser Induced Plasmas on Different Targets,” Spectrochimica Acta Part B, Vol. 65, No. 12, 2010, pp. 1041-1046. doi:10.1016/j.sab.2010.11.004 [27] C. Aragón and J. A. Aguilera, “Characterization of Laser Induced Plasmas by Optical Emission Spectroscopy: A Review of Experiments and Methods,” Spectrochimica Acta Part B, Vol. 63, No. 9, 2008, pp. 893-916. doi:10.1016/j.sab.2008.05.010 |