

Paper Menu >>
Journal Menu >>
 World Journal of Nano Science and Engineering, 2012, 2, 206-212 http://dx.doi.org/10.4236/wjnse.2012.24028 Published Online December 2012 (http://www.SciRP.org/journal/wjnse) Measurement of Plasma Parameters in Laser-Induced Breakdown Spectroscopy Using Si-Lines Ashraf Mohmoud El Sherbini1,2, Abdel Aziz Saad Al Aamer1 1Department of Physics, Collage of Science, Al-Imam Muhammad Ibn Saud Islamic University (IMSIU), Al Riyadh, KSA 2Laboratory of Lasers and New Materials, Department of Physics, Faculty of Science, Cairo University, Giza, Egypt Email: [email protected] Received August 7, 2012; revised August 20, 2012; accepted September 6, 2012 ABSTRACT The electron density and temperature of the laser induced silicon plasma were measured using two different methods. The plasma was produced via the interaction of high peak power Nd:YAG laser at the fundamental wavelength of 1064 nm with a plane solid iron target contain small traces of silicon as an element of minor concentration. The lines from the Si I at 288.15 nm and Si II-ionic lines at 413.08 and 634.71 nm were utilized to evaluate the plasma parameters. The reference plasma parameters were measured utilizing the Hα-line at 656.27 nm appeared in the spectra under the same condition. The electron density was measured utilizing the Stark broadening of the silicon lines and the temperature from the standard Saha-Boltzmann plot method. The comparison between electron densities from different silicon lines to that from the Hα-line reveals that the Si I-line at 288.15 nm contain some optical thickness while the Si II-ionic lines were found to be free from this effect. The measurements were repeated at different delay times between the laser and the camera in the range from 1 - 5 μsec. The electron density was found decreases from 2 × 10¹⁸ down to 4 × 1017 cm–3. After correcting the spectral intensity at the Si I-line at 288.15 nm, the temperatures evaluated from the different meth- ods were found in an excellent agreement and decreases from 1.25 down to 0.95 eV with delay time. Keywords: Laser; Electron Density; Temperature; Plasma; Hα-Line 1. Introduction The Laser-Induced Breakdown Spectroscopy (LIBS) te- chnique is one of the potentially growing applied tech- niques used in the field of elemental analysis, because of its simplicity and non-contact nature [1-10]. Its basic principle is based on exciting matter (solid, liquid or gas) to plasma state through irradiation by high power laser pulses. The plasma formed contains atoms and ions in different excited states, free electrons and radiation. Un- der the basic assumption that the emitted radiation is in- fluenced by the properties of the plasma, hence, it gives a detailed picture of the basic structure elements [9] and different processes in the plasma [10]. The diagnostics of the plasma can be done through the measurements of the plasma electron density (ne) and temperature (Te). The electron density in general, specifies the state of thermo- dynamical equilibrium of the plasma, while the tempera- ture determines the strength of the different distribution functions describing the plasma state [11]. The optical emission spectroscopy (OES) is the tool by which the plasma can be diagnosed [11-13]. The measurement of the electron density utilizing the Stark broadening effect requires a line which is free from self absorption [11-14]. Self absorption occurs in general in any kind of system capable of emitting radiation, such as homogeneous plasma. Moreover, the formation of the plasma in LIBS experiments in air shows, in general, a strong gradient of temperature due to the cooling effect of the surrounding air [15,16]. It was reported that the use the Hα-line at the wave- length of 656.27 nm can grantee a precise measurement of the electron density in LIBS experiments in open air, since the condition on its optical thickness was examined in a similar condition and verified to be optically thin [14,15,17]. In principle, the self absorption process acting on the strong emitted lines i.e. the lines emitted from the major element in the target material in LIBS experiments [16,18,19], and because of the passive action of this process, one can’t use such spectral lines to determine the electron temperature. Therefore, the lines that should be considered in the measurement of the plasma parame- ters must be chosen from the set of lines emitted from the minor element in the target material [16] i.e. the silicon lines in our case. Historically, the relative concentration of Si II/Si I was estimated utilizing the Saha-Boltzmann method [20]. In C opyright © 2012 SciRes. WJNSE 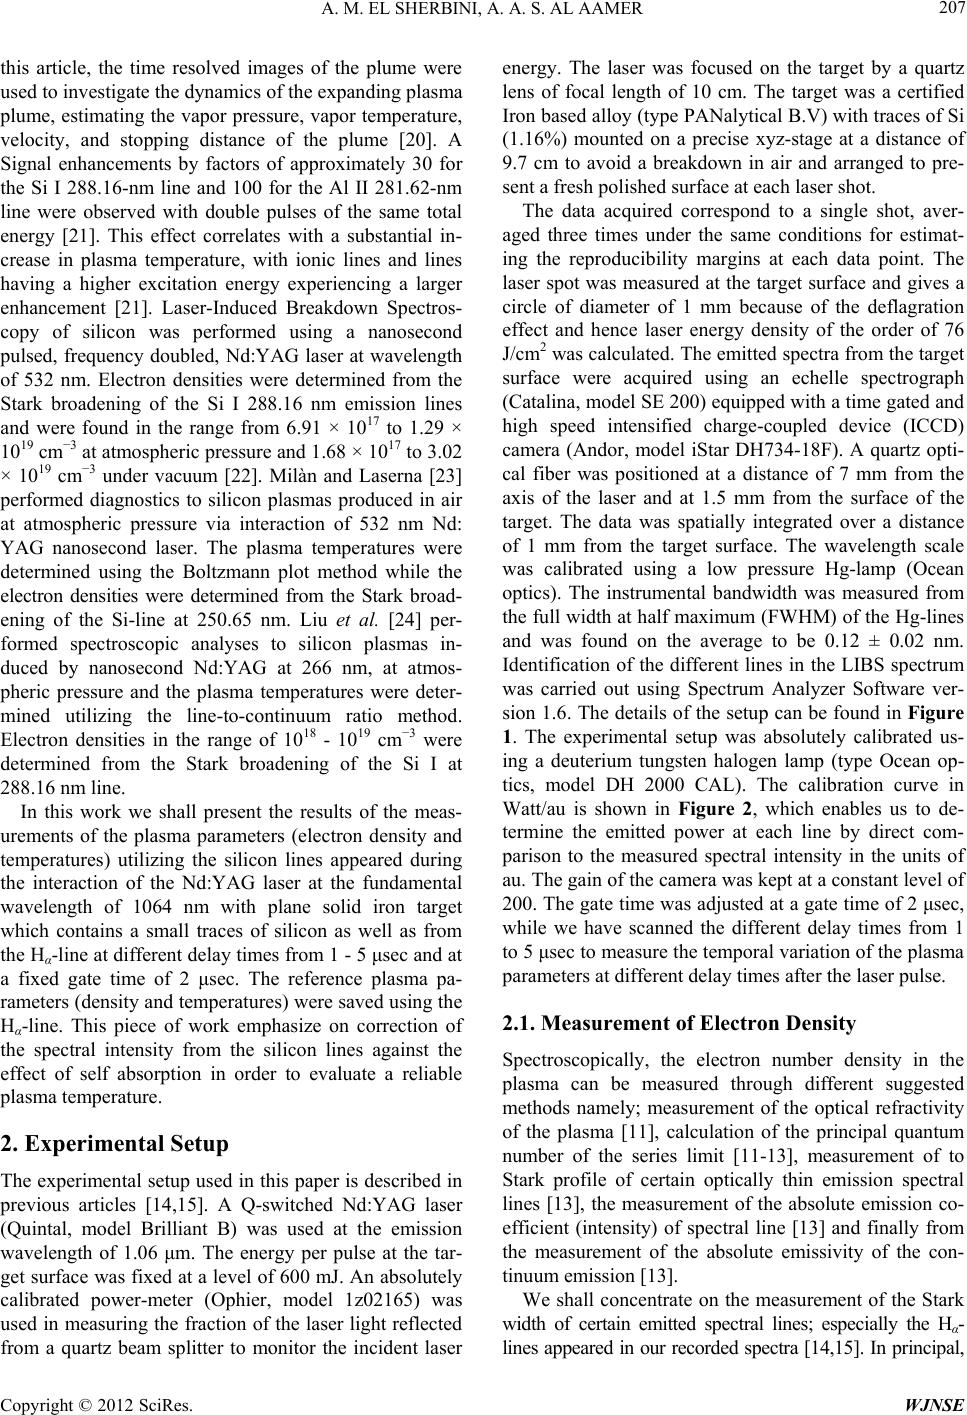 A. M. EL SHERBINI, A. A. S. AL AAMER 207 this article, the time resolved images of the plume were used to investigate the dynamics of the expanding plasma plume, estimating the vapor pressure, vapor temperature, velocity, and stopping distance of the plume [20]. A Signal enhancements by factors of approximately 30 for the Si I 288.16-nm line and 100 for the Al II 281.62-nm line were observed with double pulses of the same total energy [21]. This effect correlates with a substantial in- crease in plasma temperature, with ionic lines and lines having a higher excitation energy experiencing a larger enhancement [21]. Laser-Induced Breakdown Spectros- copy of silicon was performed using a nanosecond pulsed, frequency doubled, Nd:YAG laser at wavelength of 532 nm. Electron densities were determined from the Stark broadening of the Si I 288.16 nm emission lines and were found in the range from 6.91 × 10¹⁷ to 1.29 × 1019 cm−3 at atmospheric pressure and 1.68 × 10¹⁷ to 3.02 × 1019 cm−3 under vacuum [22]. Milàn and Laserna [23] performed diagnostics to silicon plasmas produced in air at atmospheric pressure via interaction of 532 nm Nd: YAG nanosecond laser. The plasma temperatures were determined using the Boltzmann plot method while the electron densities were determined from the Stark broad- ening of the Si-line at 250.65 nm. Liu et al. [24] per- formed spectroscopic analyses to silicon plasmas in- duced by nanosecond Nd:YAG at 266 nm, at atmos- pheric pressure and the plasma temperatures were deter- mined utilizing the line-to-continuum ratio method. Electron densities in the range of 1018 - 1019 cm−3 were determined from the Stark broadening of the Si I at 288.16 nm line. In this work we shall present the results of the meas- urements of the plasma parameters (electron density and temperatures) utilizing the silicon lines appeared during the interaction of the Nd:YAG laser at the fundamental wavelength of 1064 nm with plane solid iron target which contains a small traces of silicon as well as from the Hα-line at different delay times from 1 - 5 μsec and at a fixed gate time of 2 μsec. The reference plasma pa- rameters (density and temperatures) were saved using the Hα-line. This piece of work emphasize on correction of the spectral intensity from the silicon lines against the effect of self absorption in order to evaluate a reliable plasma temperature. 2. Experimental Setup The experimental setup used in this paper is described in previous articles [14,15]. A Q-switched Nd:YAG laser (Quintal, model Brilliant B) was used at the emission wavelength of 1.06 μm. The energy per pulse at the tar- get surface was fixed at a level of 600 mJ. An absolutely calibrated power-meter (Ophier, model 1z02165) was used in measuring the fraction of the laser light reflected from a quartz beam splitter to monitor the incident laser energy. The laser was focused on the target by a quartz lens of focal length of 10 cm. The target was a certified Iron based alloy (type PANalytical B.V) with traces of Si (1.16%) mounted on a precise xyz-stage at a distance of 9.7 cm to avoid a breakdown in air and arranged to pre- sent a fresh polished surface at each laser shot. The data acquired correspond to a single shot, aver- aged three times under the same conditions for estimat- ing the reproducibility margins at each data point. The laser spot was measured at the target surface and gives a circle of diameter of 1 mm because of the deflagration effect and hence laser energy density of the order of 76 J/cm2 was calculated. The emitted spectra from the target surface were acquired using an echelle spectrograph (Catalina, model SE 200) equipped with a time gated and high speed intensified charge-coupled device (ICCD) camera (Andor, model iStar DH734-18F). A quartz opti- cal fiber was positioned at a distance of 7 mm from the axis of the laser and at 1.5 mm from the surface of the target. The data was spatially integrated over a distance of 1 mm from the target surface. The wavelength scale was calibrated using a low pressure Hg-lamp (Ocean optics). The instrumental bandwidth was measured from the full width at half maximum (FWHM) of the Hg-lines and was found on the average to be 0.12 ± 0.02 nm. Identification of the different lines in the LIBS spectrum was carried out using Spectrum Analyzer Software ver- sion 1.6. The details of the setup can be found in Figure 1. The experimental setup was absolutely calibrated us- ing a deuterium tungsten halogen lamp (type Ocean op- tics, model DH 2000 CAL). The calibration curve in Watt/au is shown in Figure 2, which enables us to de- termine the emitted power at each line by direct com- parison to the measured spectral intensity in the units of au. The gain of the camera was kept at a constant level of 200. The gate time was adjusted at a gate time of 2 μsec, while we have scanned the different delay times from 1 to 5 μsec to measure the temporal variation of the plasma parameters at different delay times after the laser pulse. 2.1. Measurement of Electron Density Spectroscopically, the electron number density in the plasma can be measured through different suggested methods namely; measurement of the optical refractivity of the plasma [11], calculation of the principal quantum number of the series limit [11-13], measurement of to Stark profile of certain optically thin emission spectral lines [13], the measurement of the absolute emission co- efficient (intensity) of spectral line [13] and finally from the measurement of the absolute emissivity of the con- tinuum emission [13]. We shall concentrate on the measurement of the Stark width of certain emitted spectral lines; especially the Hα- lines appeared in our recorded spectra [14,15]. In principal, Copyright © 2012 SciRes. WJNSE 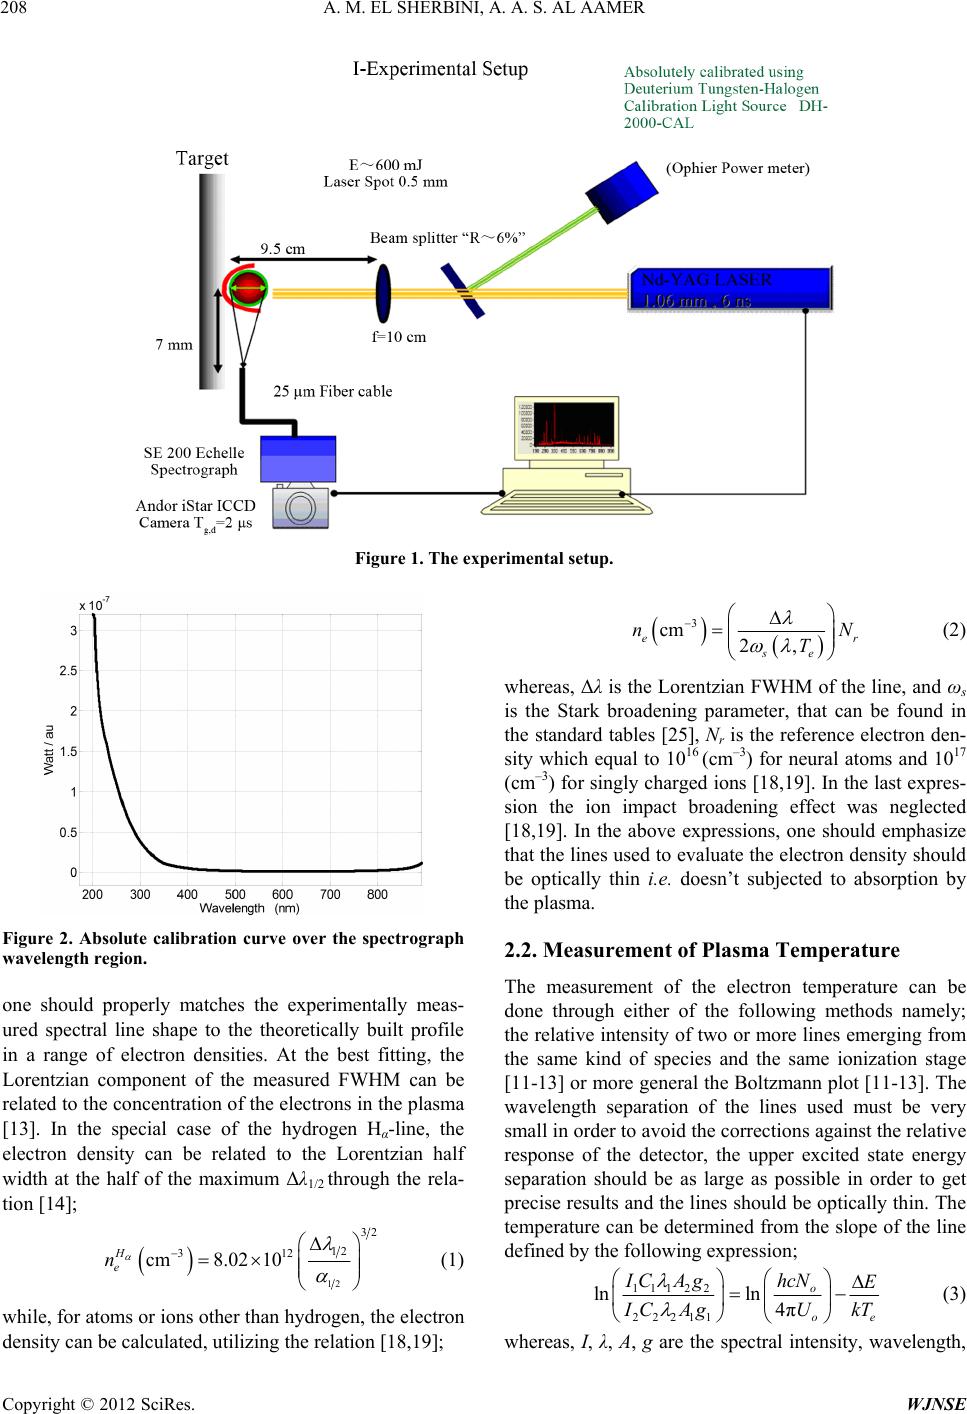 A. M. EL SHERBINI, A. A. S. AL AAMER Copyright © 2012 SciRes. WJNSE 208 Figure 1. The experimental setup. 3 cm 2, er se nN T (2) whereas, Δλ is the Lorentzian FWHM of the line, and ωs is the Stark broadening parameter, that can be found in the standard tables [25], Nr is the reference electron den- sity which equal to 1016 (cm–3) for neural atoms and 1017 (cm–3) for singly charged ions [18,19]. In the last expres- sion the ion impact broadening effect was neglected [18,19]. In the above expressions, one should emphasize that the lines used to evaluate the electron density should be optically thin i.e. doesn’t subjected to absorption by the plasma. Figure 2. Absolute calibration curve over the spectrograph wavelength region. 2.2. Measurement of Plasma Temperature The measurement of the electron temperature can be done through either of the following methods namely; the relative intensity of two or more lines emerging from the same kind of species and the same ionization stage [11-13] or more general the Boltzmann plot [11-13]. The wavelength separation of the lines used must be very small in order to avoid the corrections against the relative response of the detector, the upper excited state energy separation should be as large as possible in order to get precise results and the lines should be optically thin. The temperature can be determined from the slope of the line defined by the following expression; one should properly matches the experimentally meas- ured spectral line shape to the theoretically built profile in a range of electron densities. At the best fitting, the Lorentzian component of the measured FWHM can be related to the concentration of the electrons in the plasma [13]. In the special case of the hydrogen Hα-line, the electron density can be related to the Lorentzian half width at the half of the maximum Δλ1/2 through the rela- tion [14]; 12 32 12 312 cm8.02 10 H e n (1) 11122 22211 lnln 4π o oe hcN IC AgE I CAgU kT (3) while, for atoms or ions other than hydrogen, the electron density can be calculated, utilizing the relation [18,19]; whereas, I, λ, A, g are the spectral intensity, wavelength, 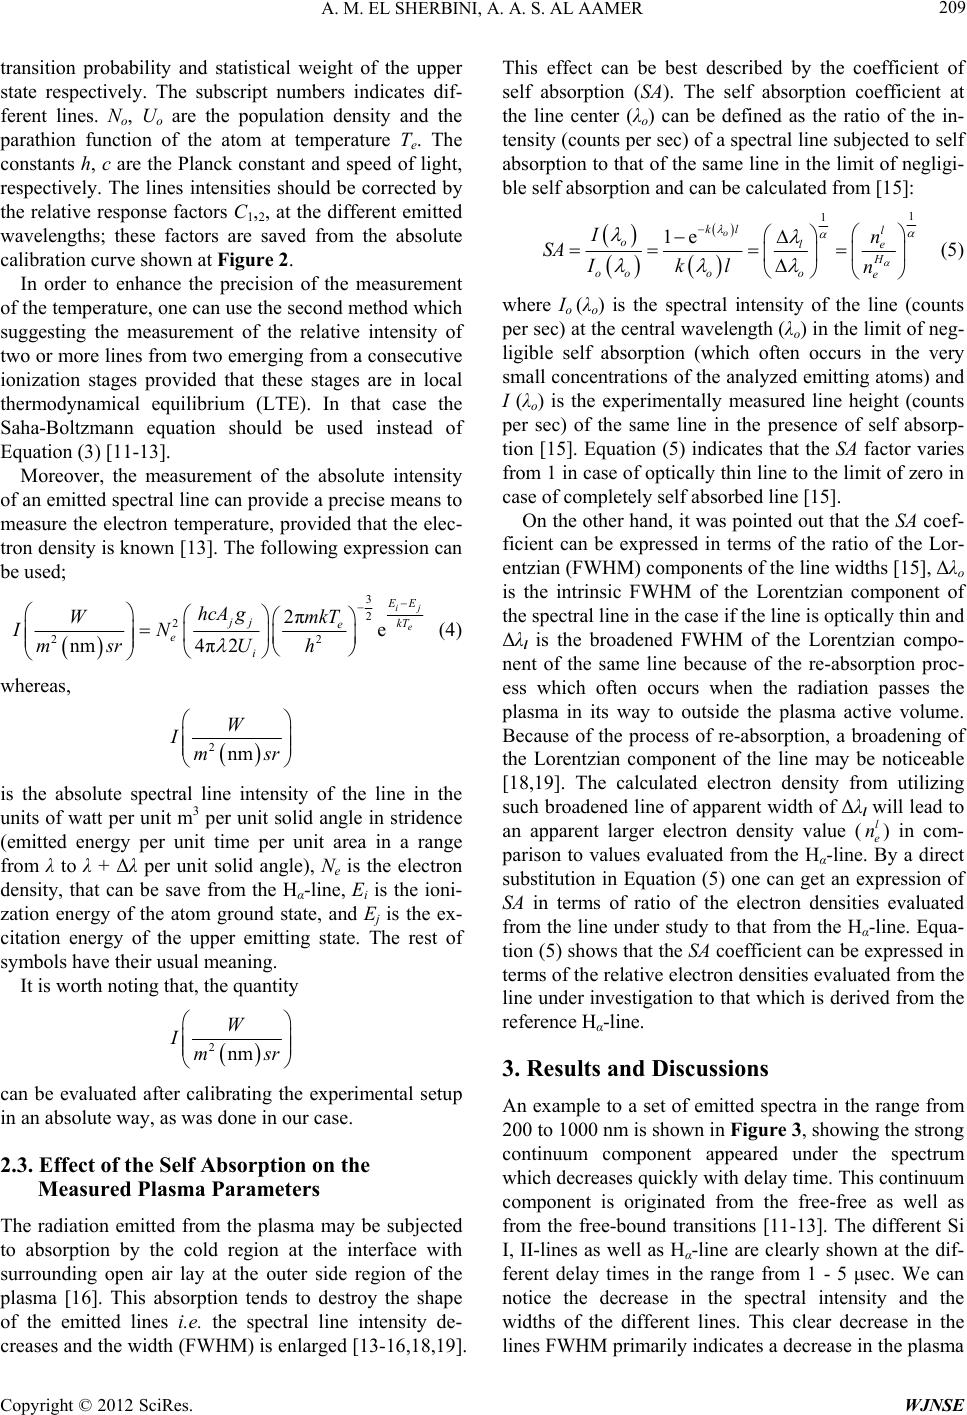 A. M. EL SHERBINI, A. A. S. AL AAMER 209 transition probability and statistical weight of the upper state respectively. The subscript numbers indicates dif- ferent lines. No, U o are the population density and the parathion function of the atom at temperature Te. The constants h, c are the Planck constant and speed of light, respectively. The lines intensities should be corrected by the relative response factors C1,2, at the different emitted wavelengths; these factors are saved from the absolute calibration curve shown at Figure 2. In order to enhance the precision of the measurement of the temperature, one can use the second method which suggesting the measurement of the relative intensity of two or more lines from two emerging from a consecutive ionization stages provided that these stages are in local thermodynamical equilibrium (LTE). In that case the Saha-Boltzmann equation should be used instead of Equation (3) [11-13]. Moreover, the measurement of the absolute intensity of an emitted spectral line can provide a precise means to measure the electron temperature, provided that the elec- tron density is known [13]. The following expression can be used; 3 2 2 2 2πe 4π2 nm ij e 2 E E jj kT e e i hcA gmkT W IN U msr h (4) whereas, 2nm W Ims r is the absolute spectral line intensity of the line in the units of watt per unit m3 per unit solid angle in stridence (emitted energy per unit time per unit area in a range from λ to λ + Δλ per unit solid angle), Ne is the electron density, that can be save from the Hα-line, Ei is the ioni- zation energy of the atom ground state, and Ej is the ex- citation energy of the upper emitting state. The rest of symbols have their usual meaning. It is worth noting that, the quantity 2nm W Ims r can be evaluated after calibrating the experimental setup in an absolute way, as was done in our case. 2.3. Effect of the Self Absorption on the Measured Plasma Parameters The radiation emitted from the plasma may be subjected to absorption by the cold region at the interface with surrounding open air lay at the outer side region of the plasma [16]. This absorption tends to destroy the shape of the emitted lines i.e. the spectral line intensity de- creases and the width (FWHM) is enlarged [13-16,18,19]. This effect can be best described by the coefficient of self absorption (SA). The self absorption coefficient at the line center (λo) can be defined as the ratio of the in- tensity (counts per sec) of a spectral line subjected to self absorption to that of the same line in the limit of negligi- ble self absorption and can be calculated from [15]: 1 1 1e o kl l ole H oooo e In SA Ikl n (5) where Io (λo) is the spectral intensity of the line (counts per sec) at the central wavelength (λo) in the limit of neg- ligible self absorption (which often occurs in the very small concentrations of the analyzed emitting atoms) and I (λo) is the experimentally measured line height (counts per sec) of the same line in the presence of self absorp- tion [15]. Equation (5) indicates that the SA factor varies from 1 in case of optically thin line to the limit of zero in case of completely self absorbed line [15]. On the other hand, it was pointed out that the SA coef- ficient can be expressed in terms of the ratio of the Lor- entzian (FWHM) components of the line widths [15], Δλo is the intrinsic FWHM of the Lorentzian component of the spectral line in the case if the line is optically thin and Δλl is the broadened FWHM of the Lorentzian compo- nent of the same line because of the re-absorption proc- ess which often occurs when the radiation passes the plasma in its way to outside the plasma active volume. Because of the process of re-absorption, a broadening of the Lorentzian component of the line may be noticeable [18,19]. The calculated electron density from utilizing such broadened line of apparent width of Δλl will lead to an apparent larger electron density value () in com- parison to values evaluated from the Hα-line. By a direct substitution in Equation (5) one can get an expression of SA in terms of ratio of the electron densities evaluated from the line under study to that from the Hα-line. Equa- tion (5) shows that the SA coefficient can be expressed in terms of the relative electron densities evaluated from the line under investigation to that which is derived from the reference Hα-line. l e n 3. Results and Discussions An example to a set of emitted spectra in the range from 200 to 1000 nm is shown in Figure 3, showing the strong continuum component appeared under the spectrum which decreases quickly with delay time. This continuum component is originated from the free-free as well as from the free-bound transitions [11-13]. The different Si I, II-lines as well as Hα-line are clearly shown at the dif- ferent delay times in the range from 1 - 5 μsec. We can notice the decrease in the spectral intensity and the widths of the different lines. This clear decrease in the lines FWHM primarily indicates a decrease in the plasma Copyright © 2012 SciRes. WJNSE 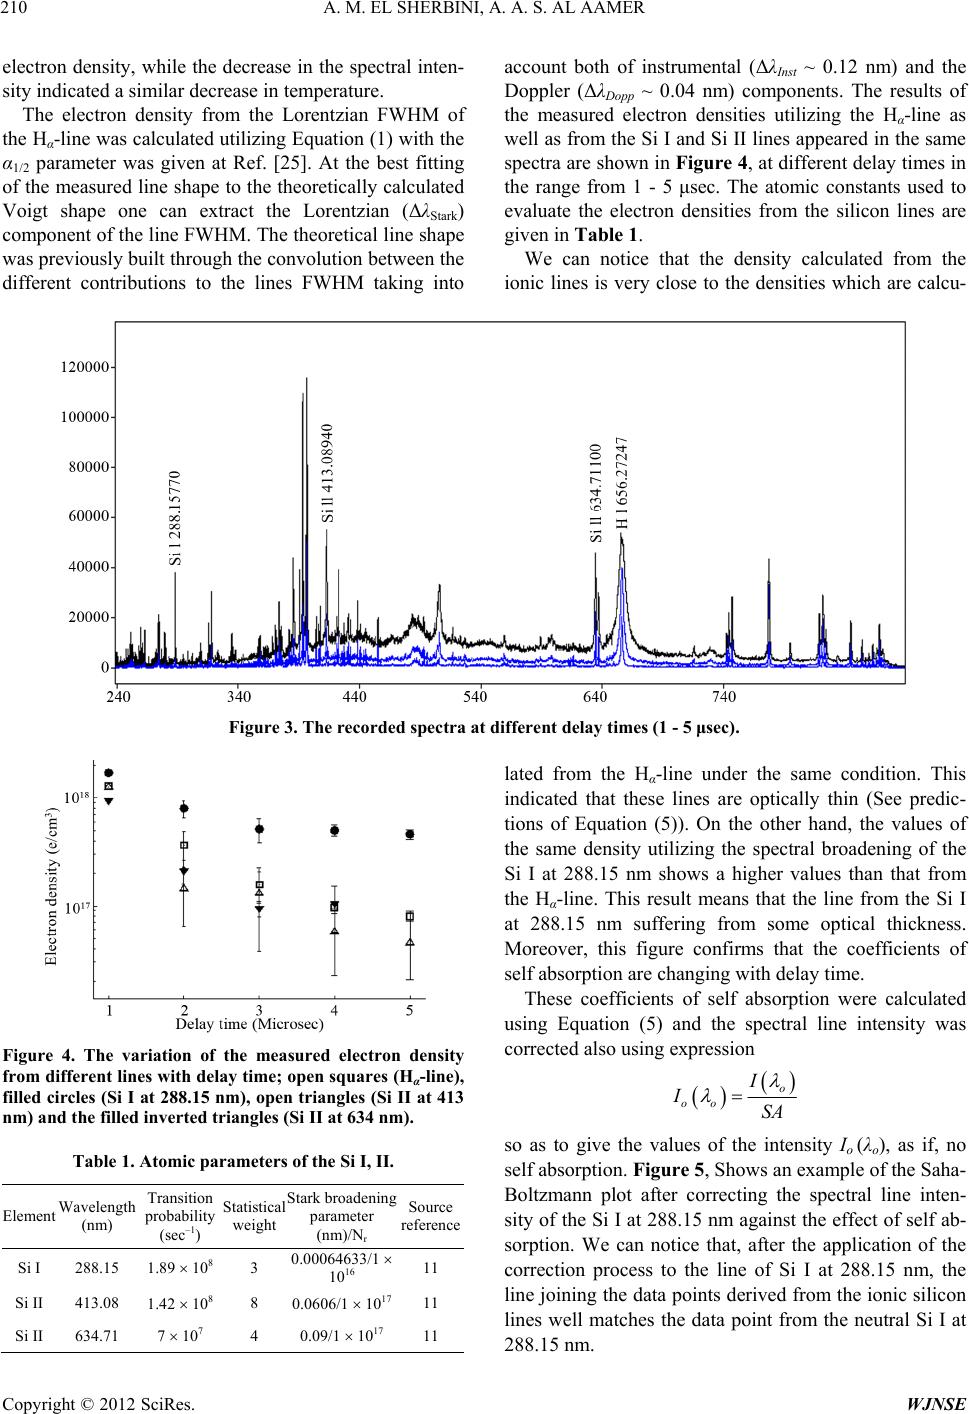 A. M. EL SHERBINI, A. A. S. AL AAMER Copyright © 2012 SciRes. WJNSE 210 electron density, while the decrease in the spectral inten- sity indicated a similar decrease in temperature. The electron density from the Lorentzian FWHM of the Hα-line was calculated utilizing Equation (1) with the α1/2 parameter was given at Ref. [25]. At the best fitting of the measured line shape to the theoretically calculated Voigt shape one can extract the Lorentzian (ΔλStark) component of the line FWHM. The theoretical line shape was previously built through the convolution between the different contributions to the lines FWHM taking into account both of instrumental (ΔλInst ~ 0.12 nm) and the Doppler (ΔλDopp ~ 0.04 nm) components. The results of the measured electron densities utilizing the Hα-line as well as from the Si I and Si II lines appeared in the same spectra are shown in Figure 4, at different delay times in the range from 1 - 5 μsec. The atomic constants used to evaluate the electron densities from the silicon lines are given in Table 1. We can notice that the density calculated from the ionic lines is very close to the densities which are calcu- Figure 3. The recorded spectra at different delay times (1 - 5 μsec). lated from the Hα-line under the same condition. This indicated that these lines are optically thin (See predic- tions of Equation (5)). On the other hand, the values of the same density utilizing the spectral broadening of the Si I at 288.15 nm shows a higher values than that from the Hα-line. This result means that the line from the Si I at 288.15 nm suffering from some optical thickness. Moreover, this figure confirms that the coefficients of self absorption are changing with delay time. These coefficients of self absorption were calculated using Equation (5) and the spectral line intensity was corrected also using expression Figure 4. The variation of the measured electron density from different lines with delay time; open squares (Hα-line), filled circles (Si I at 288.15 nm), open triangles (Si II at 413 nm) and the filled inverted triangles (Si II at 634 nm). o oo I ISA so as to give the values of the intensity Io (λo), as if, no self absorption. Figure 5, Shows an example of the Saha- Boltzmann plot after correcting the spectral line inten- sity of the Si I at 288.15 nm against the effect of self ab- sorption. We can notice that, after the application of the correction process to the line of Si I at 288.15 nm, the line joining the data points derived from the ionic silicon lines well matches the data point from the neutral Si I at 288.15 nm. Table 1. Atomic parameters of the Si I, II. Element Wavelength (nm) Transition probability (sec–1) Statistical weight Stark broadening parameter (nm)/Nr Source reference Si I 288.15 1.89 108 3 0.00064633/1 1016 11 Si II 413.08 1.42 108 8 0.0606/1 1017 11 Si II 634.71 7 107 4 0.09/1 1017 11 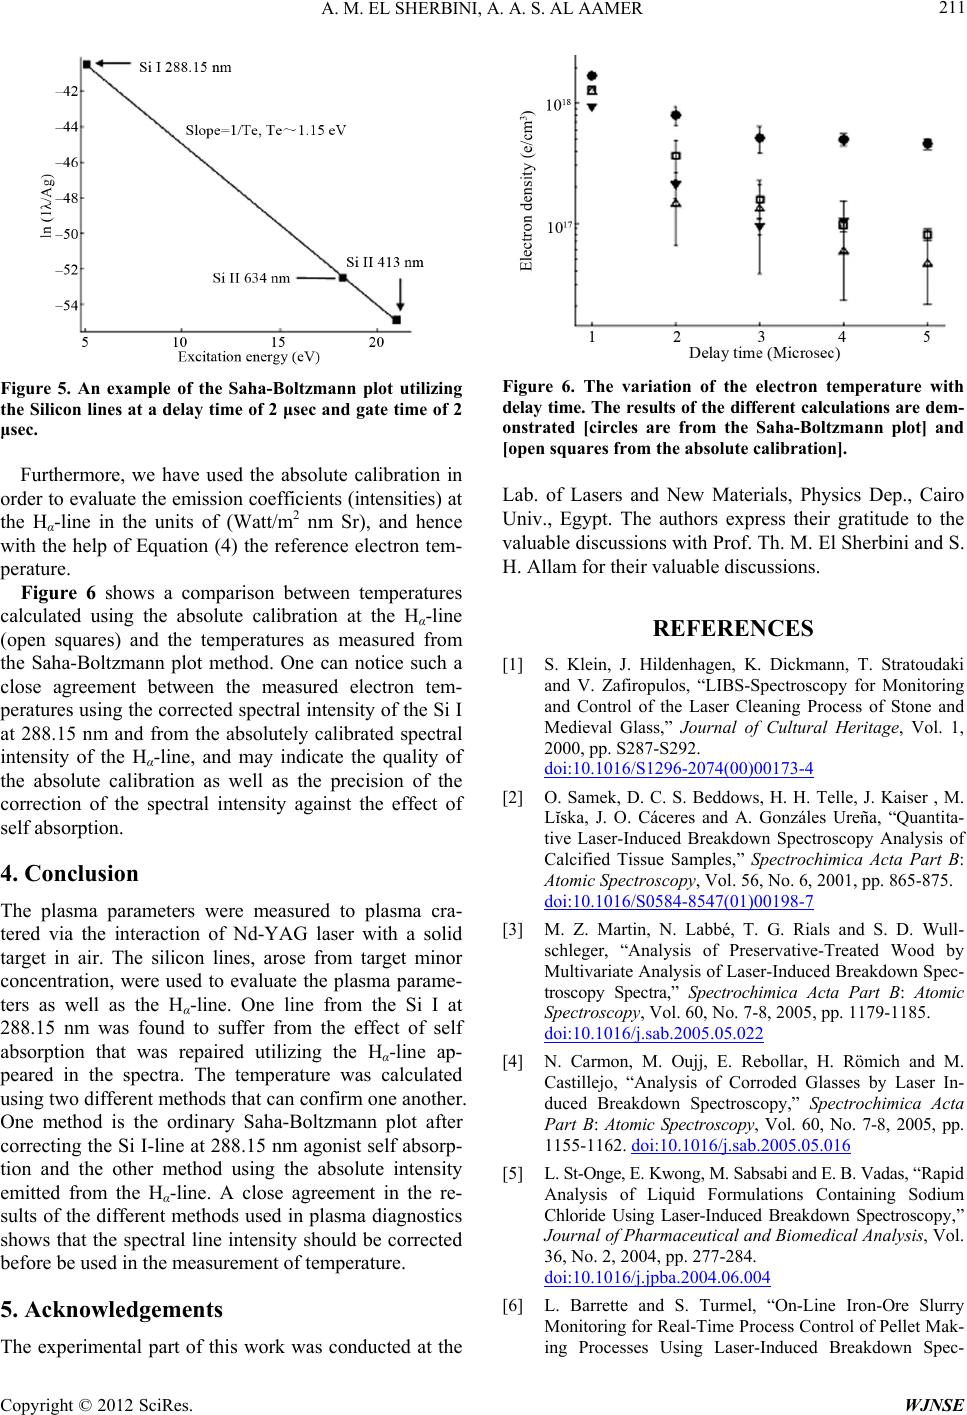 A. M. EL SHERBINI, A. A. S. AL AAMER 211 Figure 5. An example of the Saha-Boltzmann plot utilizing the Silicon lines at a delay time of 2 μsec and gate time of 2 μsec. Furthermore, we have used the absolute calibration in order to evaluate the emission coefficients (intensities) at the Hα-line in the units of (Watt/m2 nm Sr), and hence with the help of Equation (4) the reference electron tem- perature. Figure 6 shows a comparison between temperatures calculated using the absolute calibration at the Hα-line (open squares) and the temperatures as measured from the Saha-Boltzmann plot method. One can notice such a close agreement between the measured electron tem- peratures using the corrected spectral intensity of the Si I at 288.15 nm and from the absolutely calibrated spectral intensity of the Hα-line, and may indicate the quality of the absolute calibration as well as the precision of the correction of the spectral intensity against the effect of self absorption. 4. Conclusion The plasma parameters were measured to plasma cra- tered via the interaction of Nd-YAG laser with a solid target in air. The silicon lines, arose from target minor concentration, were used to evaluate the plasma parame- ters as well as the Hα-line. One line from the Si I at 288.15 nm was found to suffer from the effect of self absorption that was repaired utilizing the Hα-line ap- peared in the spectra. The temperature was calculated using two different methods that can confirm one another. One method is the ordinary Saha-Boltzmann plot after correcting the Si I-line at 288.15 nm agonist self absorp- tion and the other method using the absolute intensity emitted from the Hα-line. A close agreement in the re- sults of the different methods used in plasma diagnostics shows that the spectral line intensity should be corrected before be used in the measurement of temperature. 5. Acknowledgements The experimental part of this work was conducted at the Figure 6. The variation of the electron temperature with delay time. The results of the different calculations are dem- onstrated [circles are from the Saha-Boltzmann plot] and [open squares from the absolute calibration]. Lab. of Lasers and New Materials, Physics Dep., Cairo Univ., Egypt. The authors express their gratitude to the valuable discussions with Prof. Th. M. El Sherbini and S. H. Allam for their valuable discussions. REFERENCES [1] S. Klein, J. Hildenhagen, K. Dickmann, T. Stratoudaki and V. Zafiropulos, “LIBS-Spectroscopy for Monitoring and Control of the Laser Cleaning Process of Stone and Medieval Glass,” Journal of Cultural Heritage, Vol. 1, 2000, pp. S287-S292. doi:10.1016/S1296-2074(00)00173-4 [2] O. Samek, D. C. S. Beddows, H. H. Telle, J. Kaiser , M. Lĭska, J. O. Cáceres and A. Gonzáles Ureña, “Quantita- tive Laser-Induced Breakdown Spectroscopy Analysis of Calcified Tissue Samples,” Spectrochimica Acta Part B: Atomic Spectroscopy, Vol. 56, No. 6, 2001, pp. 865-875. doi:10.1016/S0584-8547(01)00198-7 [3] M. Z. Martin, N. Labbé, T. G. Rials and S. D. Wull- schleger, “Analysis of Preservative-Treated Wood by Multivariate Analysis of Laser-Induced Breakdown Spec- troscopy Spectra,” Spectrochimica Acta Part B: Atomic Spectroscopy, Vol. 60, No. 7-8, 2005, pp. 1179-1185. doi:10.1016/j.sab.2005.05.022 [4] N. Carmon, M. Oujj, E. Rebollar, H. Römich and M. Castillejo, “Analysis of Corroded Glasses by Laser In- duced Breakdown Spectroscopy,” Spectrochimica Acta Part B: Atomic Spectroscopy, Vol. 60, No. 7-8, 2005, pp. 1155-1162. doi:10.1016/j.sab.2005.05.016 [5] L. St-Onge, E. Kwong, M. Sabsabi and E. B. Vadas, “Rapid Analysis of Liquid Formulations Containing Sodium Chloride Using Laser-Induced Breakdown Spectroscopy,” Journal of Pharmaceutical and Biomedical Analysis, Vol. 36, No. 2, 2004, pp. 277-284. doi:10.1016/j.jpba.2004.06.004 [6] L. Barrette and S. Turmel, “On-Line Iron-Ore Slurry Monitoring for Real-Time Process Control of Pellet Mak- ing Processes Using Laser-Induced Breakdown Spec- Copyright © 2012 SciRes. WJNSE 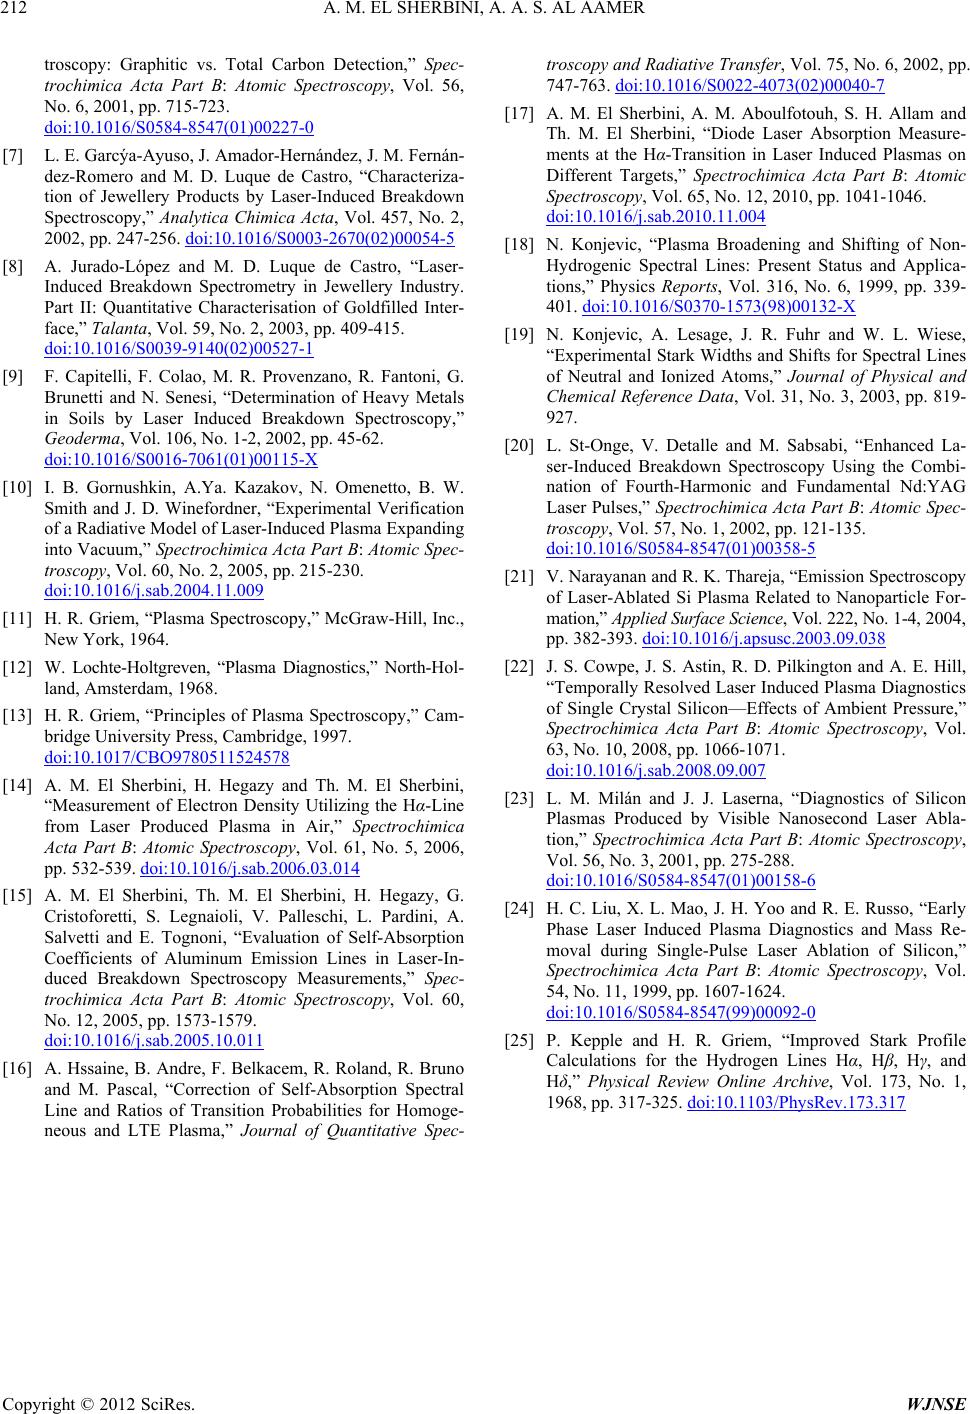 A. M. EL SHERBINI, A. A. S. AL AAMER Copyright © 2012 SciRes. WJNSE 212 troscopy: Graphitic vs. Total Carbon Detection,” Spec- trochimica Acta Part B: Atomic Spectroscopy, Vol. 56, No. 6, 2001, pp. 715-723. doi:10.1016/S0584-8547(01)00227-0 [7] L. E. Garcýa-Ayuso, J. Amador-Hernández, J. M. Fernán- dez-Romero and M. D. Luque de Castro, “Characteriza- tion of Jewellery Products by Laser-Induced Breakdown Spectroscopy,” Analytica Chimica Acta, Vol. 457, No. 2, 2002, pp. 247-256. doi:10.1016/S0003-2670(02)00054-5 [8] A. Jurado-López and M. D. Luque de Castro, “Laser- Induced Breakdown Spectrometry in Jewellery Industry. Part II: Quantitative Characterisation of Goldfilled Inter- face,” Talanta, Vol. 59, No. 2, 2003, pp. 409-415. doi:10.1016/S0039-9140(02)00527-1 [9] F. Capitelli, F. Colao, M. R. Provenzano, R. Fantoni, G. Brunetti and N. Senesi, “Determination of Heavy Metals in Soils by Laser Induced Breakdown Spectroscopy,” Geoderma, Vol. 106, No. 1-2, 2002, pp. 45-62. doi:10.1016/S0016-7061(01)00115-X [10] I. B. Gornushkin, A.Ya. Kazakov, N. Omenetto, B. W. Smith and J. D. Winefordner, “Experimental Verification of a Radiative Model of Laser-Induced Plasma Expanding into Vacuum,” Spectrochimica Acta Part B: Atomic Spec- troscopy, Vol. 60, No. 2, 2005, pp. 215-230. doi:10.1016/j.sab.2004.11.009 [11] H. R. Griem, “Plasma Spectroscopy,” McGraw-Hill, Inc., New York, 1964. [12] W. Lochte-Holtgreven, “Plasma Diagnostics,” North-Hol- land, Amsterdam, 1968. [13] H. R. Griem, “Principles of Plasma Spectroscopy,” Cam- bridge University Press, Cambridge, 1997. doi:10.1017/CBO9780511524578 [14] A. M. El Sherbini, H. Hegazy and Th. M. El Sherbini, “Measurement of Electron Density Utilizing the Hα-Line from Laser Produced Plasma in Air,” Spectrochimica Acta Part B: Atomic Spectroscopy, Vol. 61, No. 5, 2006, pp. 532-539. doi:10.1016/j.sab.2006.03.014 [15] A. M. El Sherbini, Th. M. El Sherbini, H. Hegazy, G. Cristoforetti, S. Legnaioli, V. Palleschi, L. Pardini, A. Salvetti and E. Tognoni, “Evaluation of Self-Absorption Coefficients of Aluminum Emission Lines in Laser-In- duced Breakdown Spectroscopy Measurements,” Spec- trochimica Acta Part B: Atomic Spectroscopy, Vol. 60, No. 12, 2005, pp. 1573-1579. doi:10.1016/j.sab.2005.10.011 [16] A. Hssaine, B. Andre, F. Belkacem, R. Roland, R. Bruno and M. Pascal, “Correction of Self-Absorption Spectral Line and Ratios of Transition Probabilities for Homoge- neous and LTE Plasma,” Journal of Quantitative Spec- troscopy and Radiative Transfer, Vol. 75, No. 6, 2002, pp. 747-763. doi:10.1016/S0022-4073(02)00040-7 [17] A. M. El Sherbini, A. M. Aboulfotouh, S. H. Allam and Th. M. El Sherbini, “Diode Laser Absorption Measure- ments at the Hα-Transition in Laser Induced Plasmas on Different Targets,” Spectrochimica Acta Part B: Atomic Spectroscopy, Vol. 65, No. 12, 2010, pp. 1041-1046. doi:10.1016/j.sab.2010.11.004 [18] N. Konjevic, “Plasma Broadening and Shifting of Non- Hydrogenic Spectral Lines: Present Status and Applica- tions,” Physics Reports, Vol. 316, No. 6, 1999, pp. 339- 401. doi:10.1016/S0370-1573(98)00132-X [19] N. Konjevic, A. Lesage, J. R. Fuhr and W. L. Wiese, “Experimental Stark Widths and Shifts for Spectral Lines of Neutral and Ionized Atoms,” Journal of Physical and Chemical Reference Data, Vol. 31, No. 3, 2003, pp. 819- 927. [20] L. St-Onge, V. Detalle and M. Sabsabi, “Enhanced La- ser-Induced Breakdown Spectroscopy Using the Combi- nation of Fourth-Harmonic and Fundamental Nd:YAG Laser Pulses,” Spectrochimica Acta Part B: Atomic Spec- troscopy, Vol. 57, No. 1, 2002, pp. 121-135. doi:10.1016/S0584-8547(01)00358-5 [21] V. Narayanan and R. K. Thareja, “Emission Spectroscopy of Laser-Ablated Si Plasma Related to Nanoparticle For- mation,” Applied Surface Science, Vol. 222, No. 1-4, 2004, pp. 382-393. doi:10.1016/j.apsusc.2003.09.038 [22] J. S. Cowpe, J. S. Astin, R. D. Pilkington and A. E. Hill, “Temporally Resolved Laser Induced Plasma Diagnostics of Single Crystal Silicon—Effects of Ambient Pressure,” Spectrochimica Acta Part B: Atomic Spectroscopy, Vol. 63, No. 10, 2008, pp. 1066-1071. doi:10.1016/j.sab.2008.09.007 [23] L. M. Milán and J. J. Laserna, “Diagnostics of Silicon Plasmas Produced by Visible Nanosecond Laser Abla- tion,” Spectrochimica Acta Part B: Atomic Spectroscopy, Vol. 56, No. 3, 2001, pp. 275-288. doi:10.1016/S0584-8547(01)00158-6 [24] H. C. Liu, X. L. Mao, J. H. Yoo and R. E. Russo, “Early Phase Laser Induced Plasma Diagnostics and Mass Re- moval during Single-Pulse Laser Ablation of Silicon,” Spectrochimica Acta Part B: Atomic Spectroscopy, Vol. 54, No. 11, 1999, pp. 1607-1624. doi:10.1016/S0584-8547(99)00092-0 [25] P. Kepple and H. R. Griem, “Improved Stark Profile Calculations for the Hydrogen Lines Hα, Hβ, Hγ, and Hδ,” Physical Review Online Archive, Vol. 173, No. 1, 1968, pp. 317-325. doi:10.1103/PhysRev.173.317 |