

Paper Menu >>
Journal Menu >>
 Journal of Service Science and Management, 2012, 5, 313-317 http://dx.doi.org/10.4236/jssm.2012.54037 Published Online December 2012 (http://www.SciRP.org/journal/jssm) When Reaching Our Potential Predicts Low Values: A Longitudinal Study about Performance and Organizational Values at Call Centres Danilo Garcia1,2*, Trevor Archer3,4 1Centre for Ethics, Law and Mental Health (CELAM), University of Gothenburg, Gothenburg, Sweden; 2Institute of Neuroscience and Physiology, The Sahlgrenska Academy , University of Gothenburg, Gothenburg, Sweden; 3Departmet of Psyc hology, Unive rsity of Goth - enburg, Goth enburg , Sweden; 4Department of Psychology, Education and Sport Science, Linneaus University, Kalmar, Sweden. Email: *[email protected] Received September 5th, 2012; revised October 7th, 2012; accepted October 20th, 2012 ABSTRACT The present study was executed using data from a call centre in Sweden in which ag ents answered questions regarding financial advice. The aim of the study was to investigate the relationship of call centre agents’ perceptions about the work climate and the organizational values to their performance, as measured by the organization. In Study 1, agents (N = 106) reported their experience about the work climate and organizational values. Performance (i.e., percent of time on the phone for each work day) was then assessed for the next six consecutive months. In Study 2, agents’ perceptions of organizational values were measured among a new sample (N = 262) from the same call centre. Performance was measured during the next two consecutive years. With regard to the working climate, workers’ autonomy was nega- tively related to their own performance. The resu lts show also a negative relationship between organizational values and performance during the two following years. Agents seem to maintain high productivity levels at the cost of organiza- tional core values, perhaps due to the visible and rewarding nature of productivity. Keywords: Call Centre; Organizational Values; Performance; Time Schedule 1. Introduction Organizations that work with specific values are more successful than the ones that do not emphasize values [1]. These core values need to be explicitly declared and lived by the organizations leaders and employees [2], and should reflect the organizations business plan and mar- keting strategy [3]. Moreover, it might be crucial for the organization to integrate the values into all management process, such as, performance assessment, rewards, and punishments [3,4]. If organizational values and measures of performance don’t fit, the organization risks either low productivity or that workers perceive valu es as shallow. The call centre environment is a compelling and spe- cial environment in which this hypothesis could be tested, mainly due to high performance monitoring [5,6]. Most call centres define performance as quantitative indicator s such as length of call, number of calls, and the percent- age of the scheduled “time on the phone” [5]. This spe- cific type of work design might imply unfavourable working conditions that might affect employees’ ability to learn how to cope with the rapid external and internal changes in working life. This work design perhaps even minimize employees’ opportunities to org anize their own work, diminish their sense of freedom for making deci- sions and initiatin g actio n, and limit th eir opp ortunities to learn from supportive colleagues with expertise. Indeed, Taylor and Bain ([5], p. 102) suggest that “call centre managements face a plethora of problems concerning motivation and commitment, labour turnover, the effec- tiveness of supervision and the delivery of quality and quantity performance”. The work climate (i.e., employees’ perceptions of how they are treated and managed in their organization) is important when the organizations try to motivate em- ployees to allocate and enhance their efforts into their work [7,8]. The effectiveness of an organization in cre- ating a climate in which employees are able to learn from each other or/and new experiences is crucial for the ef- fectiveness of the development of the organization but also for the well-being of employees [9]. Call centre agents who experience less autonomy (e.g., follow with- out deviations a scripted dialog, intensive performance monitoring), for example, show higher levels of strain [10]. *Corresponding author. Copyright © 2012 SciRes. JSSM  When Reaching Our Potential Predicts Low Values: A Longitudinal Study about Performance and Organizational Values at Call Centres 314 The present study was executed using data from a call centre in Sweden in which agents answered questions regarding financial advice. The aim of the present set of studies is to investigate the relationship of call centre agents’ perceptions of organisational values, their work climate, and their performance measured by the organi- zation as percentage of “time on the phone” over a six- month-period in Study 1 and two-year-period in Study 2. This specific performance measure was used by the or- ganization as the most important part of the reward sys- tem, that is, agents that performed the best got, for ex- ample, higher payments—a common reward system among call centres [5]. It is plausible to suggest that the core values might not be integrated in the reward system in this specific case. Hence, although a positive working climate was expected to be related to a positive view of organizational values, performance was expected to be negatively related to both variables. Due to the working design of call centres, this negative relationship between work climate and performance was particularly expected with regard to workers’ experience of autonomy, that is, opportunities for employees to organize their own work and the opportunities given for making decisions and initiating action. 2. Study 1: Learning Work Climate, Values, and Performance 2.1. Method 2.1.1. P a rticipa nts and Procedure The whole popu lation consisted of 135 call cen tre agents who were invited to self-report their perception of the work climate and organizational values. All agents, no supervisors were invited to participate, were informed that their participation was voluntary and confidential. Agents were instructed to provide their “worker number” in order to trace responses from the first and second part of Study 1. All agents participated in the first part of the Study and received cinema tickets for their collaboration. Participants’ performance was then assessed for the next six consecutive months by the same system handling the calls. At the end of the six months, participants were asked to retrieve their performance and to report it di- rectly to one of the research ers along their “worker num- ber”. Agents who provided their performance at the sec- ond part of the study received a cinema ticket for their collaboration. A total of 106 (mean age = 43.07 SD = 12.68) agents, 84 females and 25 males, retrieved this information successfully. 2.1.2. Measures 2.1.2.1. Wo r king Climat e The Learning Climate Questionnaire (LCQ) [11] was used to measure agents’ experience of the working cli- mate. The LCQ comprises 70 items (1 = extremely dis- agree, 5 = extremely agree), organized in seven sub- scales that provide means for looking at the working cli- mate in more detail: Management Relations and Style (e.g., “My immediate manager makes me feel like a valuable member of the team”), Time (e.g., “I have time to do my job properly” ), Autonomy and Responsibility (e.g., “I feel free to organize my work the way I want to”), Team Style (e.g., “If we ask each other for help it is given”), Opportunities to Develop (e.g., “There are lots of different ways to learn new jobs here”), Guidelines on How to Do the Job (e.g., “Information relevant to my job is kept up-to-date”), and Contentedness (e.g., “People tend to put each othe r down”). 2.1.2. 2. Pe rception o f Organizational Values The agents’ perception of organizational values was as- sessed by simply asking agents to rate to what ex tent (1 = not at all, 5 = extremely good) they thought th e organiza- tion lived up to the three core values explicitly stated by the managers and the organization: proactive, trustful, and helpful. 2.1.2. 3. Pe rforma nce Each worker’s performance was assessed by the same system handling the calls each day over a six month pe- riod. Basically each worker has a minimum of five hours schedule each day for being logged in the system waiting and handling inbound- and outbound phone calls (i.e., “time on the phone”). The system monitors these actions and divides the cumulated “time on the phone” by the time the agent was originally schedule to be on the phon e. In other words, the performance measure is a percentage of the time the organization expects the agents to be working on calls or being ready to receive calls and the actual time agents deliver. The system handles absentee- ism, caused by sickness or other type of absenteeism accepted by the organization, by simply not taking those days or hours into account when the performance meas- ure is computed. 2.2. Results and Discussion All work climate subscales of the LCQ were positively related to agents’ perception of the organizational values. As predicted, the sub-scale of Autonomy was negatively correlated to performance over the six month period (see Table 1). In other words, low perceptions of control over how one organizes one’s work and the opportunities given for making decisions and initiating action were related to high levels of “time on the phone”. These agents do not see themselves as encouraged to take re- sponsibility for learning and lack freedom to experiment Copyright © 2012 SciRes. JSSM 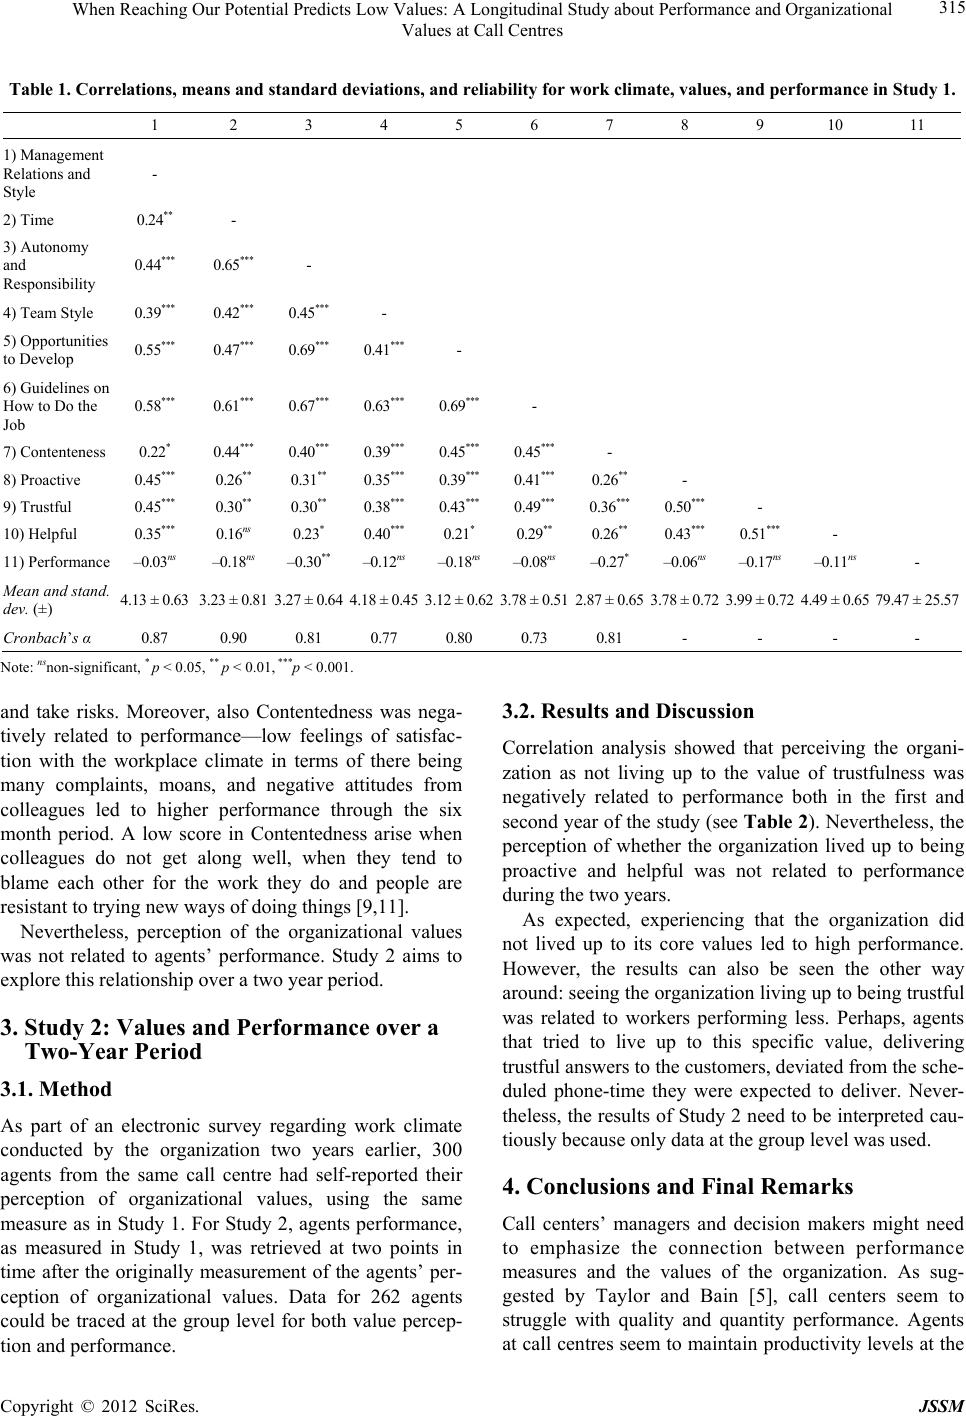 When Reaching Our Potential Predicts Low Values: A Longitudinal Study about Performance and Organizational Values at Call Centres Copyright © 2012 SciRes. JSSM 315 Table 1. Correlations, means and standard deviations, and reliability for work climate, values, and performance in Study 1. 1 2 3 4 5 6 7 8 9 10 11 1) Management Relations and Style - 2) Time 0.24** - 3) Autonomy and Responsibility 0.44*** 0.65*** - 4) Team Style 0.39*** 0.42*** 0.45*** - 5) Opportunities to Develop 0.55*** 0.47*** 0.69*** 0.41*** - 6) Guidelines on How to Do the Job 0.58*** 0.61*** 0.67*** 0.63*** 0.69*** - 7) Contenteness 0.22* 0.44*** 0.40*** 0.39*** 0.45*** 0.45*** - 8) Proactive 0.45*** 0.26** 0.31** 0.35*** 0.39*** 0.41*** 0.26** - 9) Trustful 0.45*** 0.30** 0.30** 0.38*** 0.43*** 0.49*** 0.36*** 0.50*** - 10) Helpful 0.35*** 0.16ns 0.23* 0.40*** 0.21* 0.29** 0.26** 0.43*** 0.51*** - 11) Performa nce –0.03ns –0.18ns –0.30** –0.12ns –0.18ns –0.08ns –0.27* –0.06ns –0.17ns –0.11ns - M ean and stand. dev. (±) 4.13 ± 0.63 3.2 3 ± 0.81 3.27 ± 0.64 4.18 ± 0. 453.12 ± 0. 623.78 ± 0. 512.87 ± 0. 653.78 ± 0.723.99 ± 0.72 4.49 ± 0.65 79.4 7 ± 25.5 7 Cronbach’s α 0.8 7 0.90 0.81 0.77 0.80 0.73 0.81 - - - - Note: nsnon-significant, * p < 0.05, ** p < 0.01, ***p < 0.001. and take risks. Moreover, also Contentedness was nega- tively related to performance—low feelings of satisfac- tion with the workplace climate in terms of there being many complaints, moans, and negative attitudes from colleagues led to higher performance through the six month period. A low score in Contentedness arise when colleagues do not get along well, when they tend to blame each other for the work they do and people are resistant to trying new ways of doing things [9,11]. Nevertheless, perception of the organizational values was not related to agents’ performance. Study 2 aims to explore t hi s re l ationship over a two ye ar pe riod. 3. Study 2: Values and Performance over a Two-Year Period 3.1. Method As part of an electronic survey regarding work climate conducted by the organization two years earlier, 300 agents from the same call centre had self-reported their perception of organizational values, using the same measure as in Study 1. For Study 2, agents performance, as measured in Study 1, was retrieved at two points in time after the originally measurement of the agents’ per- ception of organizational values. Data for 262 agents could be traced at the group level for both value percep- tion and performance. 3.2. Results and Discussion Correlation analysis showed that perceiving the organi- zation as not living up to the value of trustfulness was negatively related to performance both in the first and second year of the study (see Table 2). Nevertheless, the perception of whether the organization lived up to being proactive and helpful was not related to performance during the two years. As expected, experiencing that the organization did not lived up to its core values led to high performance. However, the results can also be seen the other way around: seeing the organization living up to being trustful was related to workers performing less. Perhaps, agents that tried to live up to this specific value, delivering trustful answers to the custo mers, deviated from the sche- duled phone-time they were expected to deliver. Never- theless, the results of Study 2 need to be interpreted cau- tiously because only data at the group level was used. 4. Conclusions and Final Remarks Call centers’ managers and decision makers might need to emphasize the connection between performance measures and the values of the organization. As sug- gested by Taylor and Bain [5], call centers seem to struggle with quality and quantity performance. Agents at call centres seem to maintain productivity levels at the 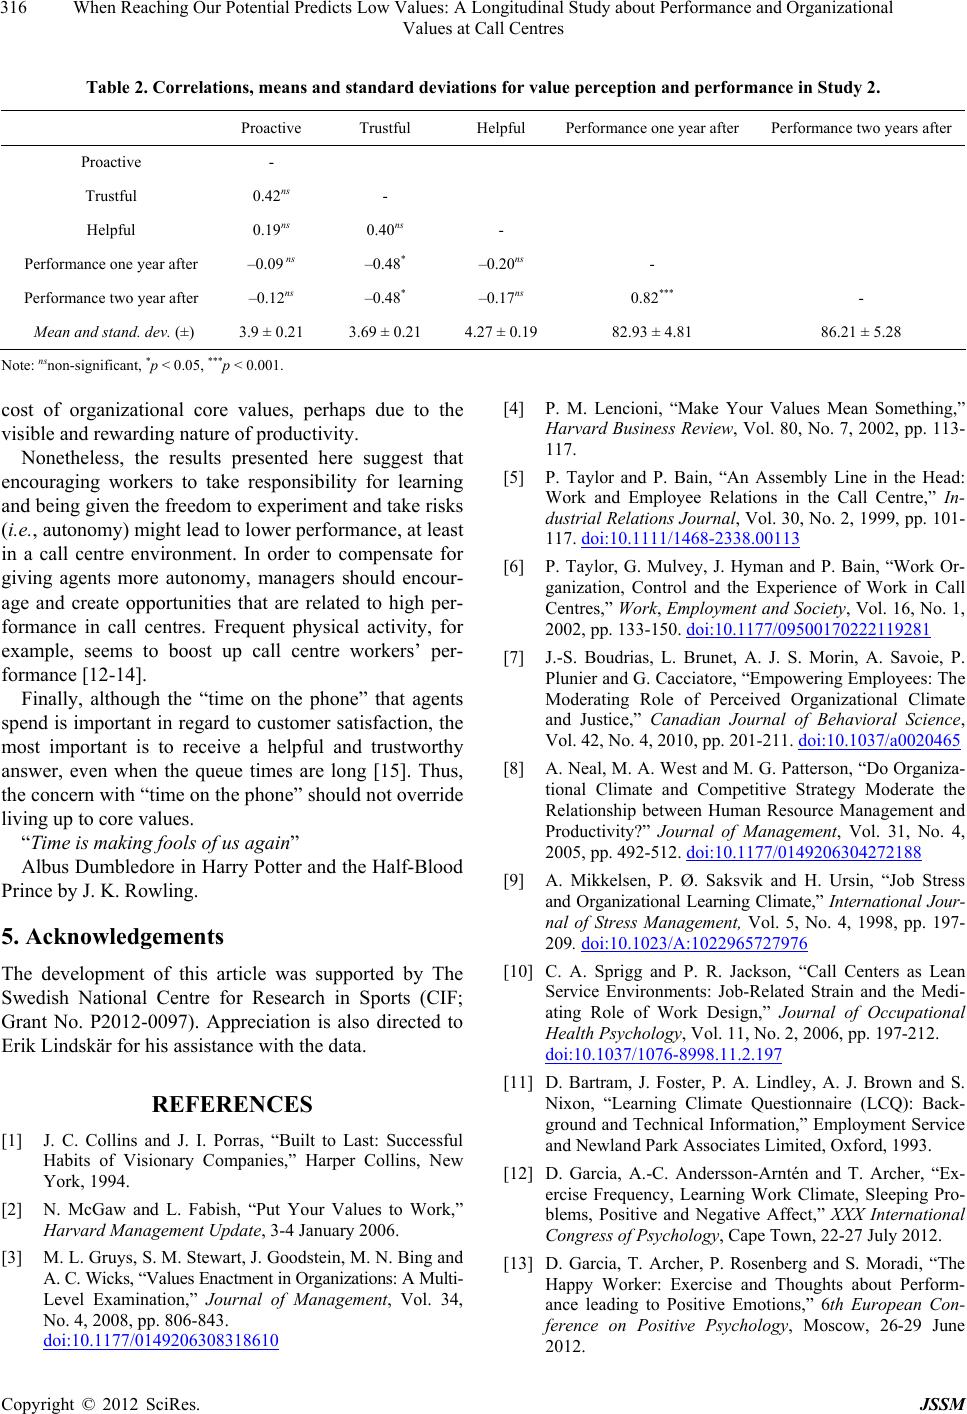 When Reaching Our Potential Predicts Low Values: A Longitudinal Study about Performance and Organizational Values at Call Centres 316 Table 2. Correlations, means and standard deviations for value perception and performance in Study 2. Proactive Trustful Helpful Performance one year after Performance two years after Proactive - Trustful 0.42ns - Helpful 0.19ns 0.40ns - Performance one year after –0.09 ns –0.48* –0.20ns - Performance two year after –0.12ns –0.48* –0.17ns 0.82*** - Mean and stand. dev. (±) 3.9 ± 0.21 3.69 ± 0.21 4.27 ± 0.1982.93 ± 4.81 86.21 ± 5.28 Note: nsnon-significant, *p < 0.05, ***p < 0.001. cost of organizational core values, perhaps due to the visible and rewarding nature of productivity. Nonetheless, the results presented here suggest that encouraging workers to take responsibility for learning and being given the freedom to experiment and take risks (i.e., autonomy) might lead to lower performance, at least in a call centre environment. In order to compensate for giving agents more autonomy, managers should encour- age and create opportunities that are related to high per- formance in call centres. Frequent physical activity, for example, seems to boost up call centre workers’ per- formance [12-14]. Finally, although the “time on the phone” that agents spend is important in regard to customer satisfaction, the most important is to receive a helpful and trustworthy answer, even when the queue times are long [15]. Thus, the concern with “time on the phone” should not override living up to core va lues. “Time is making fools of us again” Albus Dumbledore in Harry Potter and the Half-Blood Prince by J. K. Rowling. 5. Acknowledgements The development of this article was supported by The Swedish National Centre for Research in Sports (CIF; Grant No. P2012-0097). Appreciation is also directed to Erik Lindskär for his assistance with the data. REFERENCES [1] J. C. Collins and J. I. Porras, “Built to Last: Successful Habits of Visionary Companies,” Harper Collins, New York, 1994. [2] N. McGaw and L. Fabish, “Put Your Values to Work,” Harvard Management Update, 3-4 January 2006. [3] M. L. Gruys, S. M. Stewart, J. Goodstein, M. N. Bing and A. C. Wicks, “Values Enactment in Organizations: A Multi- Level Examination,” Journal of Management, Vol. 34, No. 4, 2008, pp. 806-843. doi:10.1177/0149206308318610 [4] P. M. Lencioni, “Make Your Values Mean Something,” Harvard Business Review, Vol. 80, No. 7, 2002, pp. 113- 117. [5] P. Taylor and P. Bain, “An Assembly Line in the Head: Work and Employee Relations in the Call Centre,” In- dustrial Relations Journal, Vol. 30, No. 2, 1999, pp. 101- 117. doi:10.1111/1468-2338.00113 [6] P. Taylor, G. Mulvey, J. Hyman and P. Bain, “Work Or- ganization, Control and the Experience of Work in Call Centres,” Work, Employment and Society, Vol. 16, No. 1, 2002, pp. 133-150. doi:10.1177/09500170222119281 [7] J.-S. Boudrias, L. Brunet, A. J. S. Morin, A. Savoie, P. Plunier and G. Cacciatore, “Empowering Employees: The Moderating Role of Perceived Organizational Climate and Justice,” Canadian Journal of Behavioral Science, Vol. 42, No. 4, 2010, pp. 201-211. doi:10.1037/a0020465 [8] A. Neal, M. A. West a nd M. G. Patterson, “Do Organiza- tional Climate and Competitive Strategy Moderate the Relationship between Human Resource Management and Productivity?” Journal of Management, Vol. 31, No. 4, 2005, pp. 492-512. doi:10.1177/0149206304272188 [9] A. Mikkelsen, P. Ø. Saksvik and H. Ursin, “Job Stress and Organizational Learning Climate,” International Jour- nal of Stress Management, Vol. 5, No. 4, 1998, pp. 197- 209. doi:10.1023/A:1022965727976 [10] C. A. Sprigg and P. R. Jackson, “Call Centers as Lean Service Environments: Job-Related Strain and the Medi- ating Role of Work Design,” Journal of Occupational Health Psychology, Vol. 11, No. 2, 2006, pp. 197-212. doi:10.1037/1076-8998.11.2.197 [11] D. Bartram, J. Foster, P. A. Lindley, A. J. Brown and S. Nixon, “Learning Climate Questionnaire (LCQ): Back- ground and Technical Information,” Employment Service and Newland Park Associates Limited, Oxford, 1993. [12] D. Garcia, A.-C. Andersson-Arntén and T. Archer, “Ex- ercise Frequency, Learning Work Climate, Sleeping Pro- blems, Positive and Negative Affect,” XXX International Congress of Psychology, Cape Town, 22-27 July 2012. [13] D. Garcia, T. Archer, P. Rosenberg and S. Moradi, “The Happy Worker: Exercise and Thoughts about Perform- ance leading to Positive Emotions,” 6th European Con- ference on Positive Psychology, Moscow, 26-29 June 2012. Copyright © 2012 SciRes. JSSM  When Reaching Our Potential Predicts Low Values: A Longitudinal Study about Performance and Organizational Values at Call Centres 317 [14] D. Garcia, P. Rosenberg, T. Archer and S. Moradi, “Ex- ercise Frequency Predicts Performance among White- Collar Workers,” 24rd Association for Psychological Sci- ence Annual Convention, Chicago, 24-27 May 2012. [15] D. Garcia, T. Archer, S. Moradi and B. Ghiabi, “Waiting in Vain: Managing Time and Customer Satisfaction at Call Centres,” Psychology, Vol. 3, No. 2, 2012, pp. 213- 216. doi:10.4236/psych.2012.32030 Copyright © 2012 SciRes. JSSM |