

Paper Menu >>
Journal Menu >>
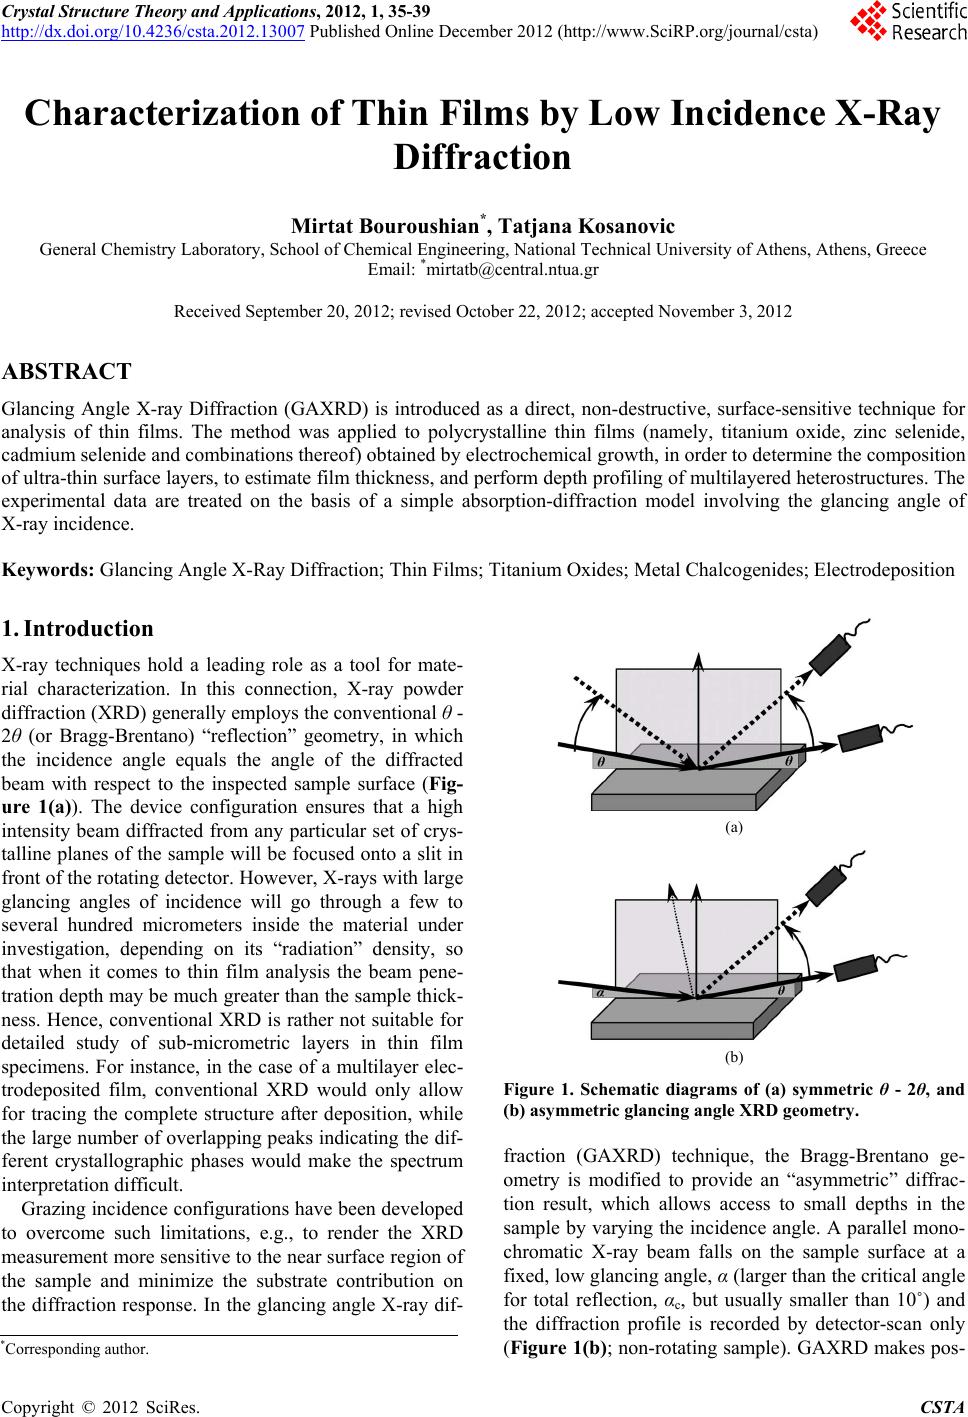 Crystal Structure Theory and Applications, 2012, 1, 35-39 http://dx.doi.org/10.4236/csta.2012.13007 Published Online December 2012 (http://www.SciRP.org/journal/csta) Characterization of Thin Films by Low Incidence X-Ray Diffraction Mirtat Bouroushian*, Tatjana Kosanovic General Chemistry Laboratory, School of Chemical Engineering, National Technical University of Athens, Athens, Greece Email: *[email protected] Received September 20, 2012; revised October 22, 2012; accepted November 3, 2012 ABSTRACT Glancing Angle X-ray Diffraction (GAXRD) is introduced as a direct, non-destructive, surface-sensitive technique for analysis of thin films. The method was applied to polycrystalline thin films (namely, titanium oxide, zinc selenide, cadmium selenide and combinations thereof) obtained by electrochemical growth, in order to determine the composition of ultra-thin surface layers, to estimate film thickness, and perform depth profiling of multilayered heterostructures. The experimental data are treated on the basis of a simple absorption-diffraction model involving the glancing angle of X-ray incidence. Keywords: Glancing Angle X-Ray Diffraction; Thin Films; Titanium Oxides; Metal Chalcogenides; Electrodeposition 1. Introduction X-ray techniques hold a leading role as a tool for mate- rial characterization. In this connection, X-ray powder diffraction (XRD) generally employs the conventional θ - 2θ (or Bragg-Brentano) “reflection” geometry, in which the incidence angle equals the angle of the diffracted beam with respect to the inspected sample surface (Fig- ure 1(a)). The device configuration ensures that a high intensity beam diffracted from any particular set of crys- talline planes of the sample will be focused onto a slit in front of the rotating detector. However, X-rays with large glancing angles of incidence will go through a few to several hundred micrometers inside the material under investigation, depending on its “radiation” density, so that when it comes to thin film analysis the beam pene- tration depth may be much greater than the sample thick- ness. Hence, conventional XRD is rather not suitable for detailed study of sub-micrometric layers in thin film specimens. For instance, in the case of a multilayer elec- trodeposited film, conventional XRD would only allow for tracing the complete structure after deposition, while the large number of overlapping peaks indicating the dif- ferent crystallographic phases would make the spectrum interpretation difficult. Grazing incidence configurations have been developed to overcome such limitations, e.g., to render the XRD measurement more sensitive to the near surface region of the sample and minimize the substrate contribution on the diffraction response. In the glancing angle X-ray dif- (a) (b) Figure 1. Schematic diagrams of (a) symmetric θ - 2θ, and (b) asymmetric glancing angle XRD geometry. fraction (GAXRD) technique, the Bragg-Brentano ge- ometry is modified to provide an “asymmetric” diffrac- tion result, which allows access to small depths in the sample by varying the incidence angle. A parallel mono- chromatic X-ray beam falls on the sample surface at a fixed, low glancing angle, α (larger than the critical angle for total reflection, αc, but usually smaller than 10˚) and the diffraction profile is recorded by detector-scan only (Figure 1(b); non-rotating sample). GAXRD makes pos- *Corresponding author. C opyright © 2012 SciRes. CSTA 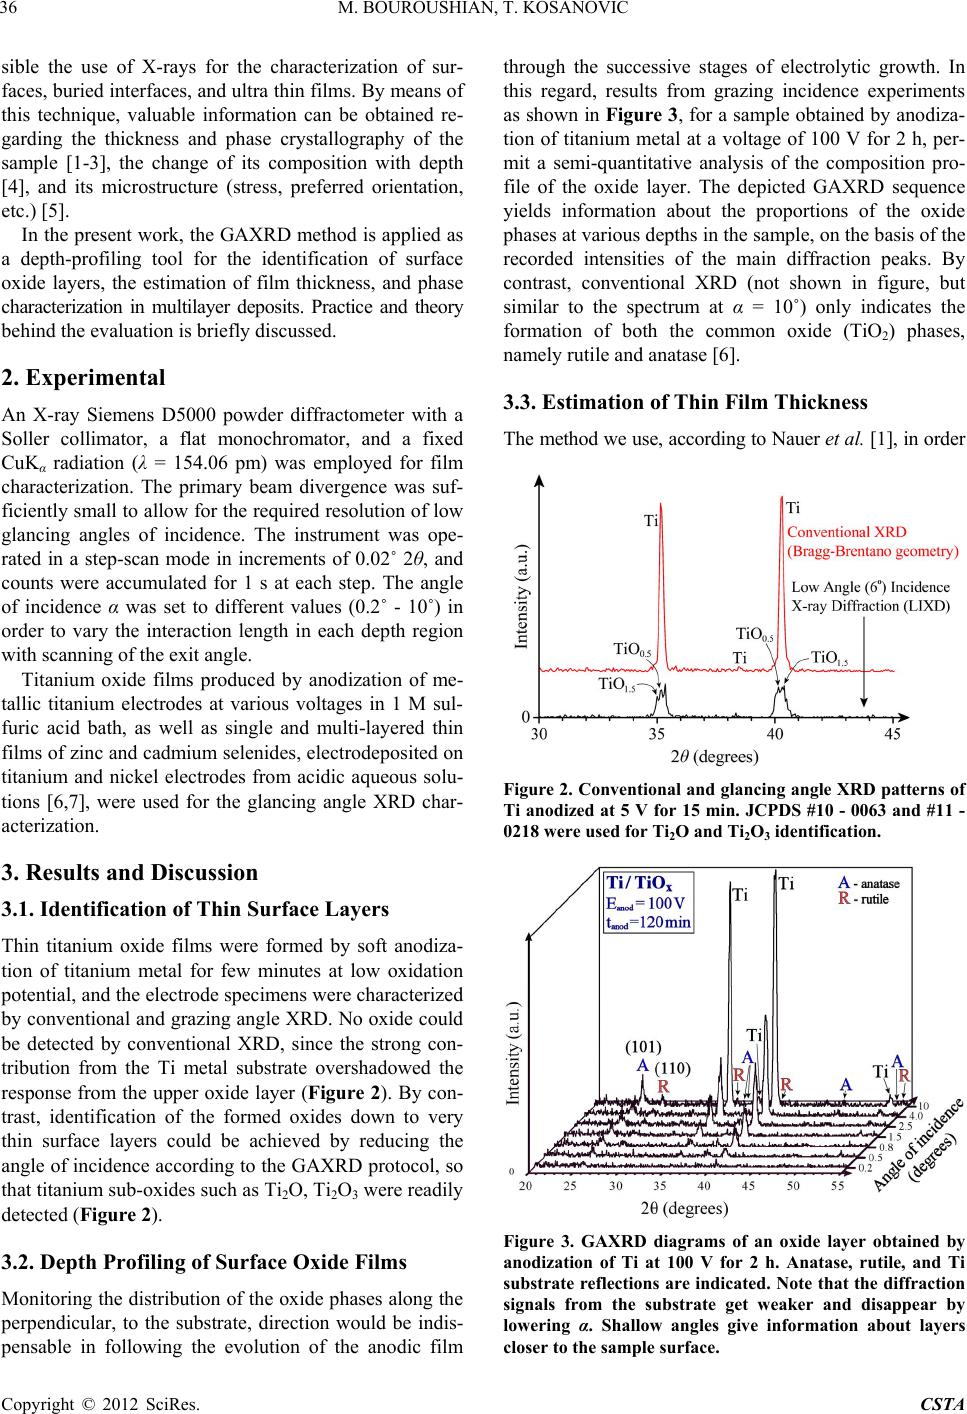 M. BOUROUSHIAN, T. KOSANOVIC 36 sible the use of X-rays for the characterization of sur- faces, buried interfaces, and ultra thin films. By means of this technique, valuable information can be obtained re- garding the thickness and phase crystallography of the sample [1-3], the change of its composition with depth [4], and its microstructure (stress, preferred orientation, etc.) [5]. In the present work, the GAXRD method is applied as a depth-profiling tool for the identification of surface oxide layers, the estimation of film thickness, and phase characterization in multilayer deposits. Practice and theory behind the evaluation is briefly discussed. 2. Experimental An X-ray Siemens D5000 powder diffractometer with a Soller collimator, a flat monochromator, and a fixed CuΚα radiation (λ = 154.06 pm) was employed for film characterization. The primary beam divergence was suf- ficiently small to allow for the required resolution of low glancing angles of incidence. The instrument was ope- rated in a step-scan mode in increments of 0.02˚ 2θ, and counts were accumulated for 1 s at each step. The angle of incidence α was set to different values (0.2˚ - 10˚) in order to vary the interaction length in each depth region with scanning of the exit angle. Titanium oxide films produced by anodization of me- tallic titanium electrodes at various voltages in 1 M sul- furic acid bath, as well as single and multi-layered thin films of zinc and cadmium selenides, electrodeposited on titanium and nickel electrodes from acidic aqueous solu- tions [6,7], were used for the glancing angle XRD char- acterization. 3. Results and Discussion 3.1. Identification of Thin Surface Layers Thin titanium oxide films were formed by soft anodiza- tion of titanium metal for few minutes at low oxidation potential, and the electrode specimens were characterized by conventional and grazing angle XRD. No oxide could be detected by conventional XRD, since the strong con- tribution from the Ti metal substrate overshadowed the response from the upper oxide layer (Figure 2). By con- trast, identification of the formed oxides down to very thin surface layers could be achieved by reducing the angle of incidence according to the GAXRD protocol, so that titanium sub-oxides such as Ti2O, Ti2O3 were readily detected (Figure 2). 3.2. Depth Profiling of Surface Oxide Films Monitoring the distribution of the oxide phases along the perpendicular, to the substrate, direction would be indis- pensable in following the evolution of the anodic film through the successive stages of electrolytic growth. In this regard, results from grazing incidence experiments as shown in Figure 3, for a sample obtained by anodiza- tion of titanium metal at a voltage of 100 V for 2 h, per- mit a semi-quantitative analysis of the composition pro- file of the oxide layer. The depicted GAXRD sequence yields information about the proportions of the oxide phases at various depths in the sample, on the basis of the recorded intensities of the main diffraction peaks. By contrast, conventional XRD (not shown in figure, but similar to the spectrum at α = 10˚) only indicates the formation of both the common oxide (TiO2) phases, namely rutile and anatase [6]. 3.3. Estimation of Thin Film Thickness The method we use, according to Nauer et al. [1], in order Figure 2. Conventional and glancing angle XRD patterns of Ti anodized at 5 V for 15 min. JCPDS #10 - 0063 and #11 - 0218 were used for Ti2O and Ti2O3 identification. Figure 3. GAXRD diagrams of an oxide layer obtained by anodization of Ti at 100 V for 2 h. Anatase, rutile, and Ti substrate reflections are indicated. Note that the diffraction signals from the substrate get weaker and disappear by lowering α. Shallow angles give information about layers closer to the sample surface. Copyright © 2012 SciRes. CSTA 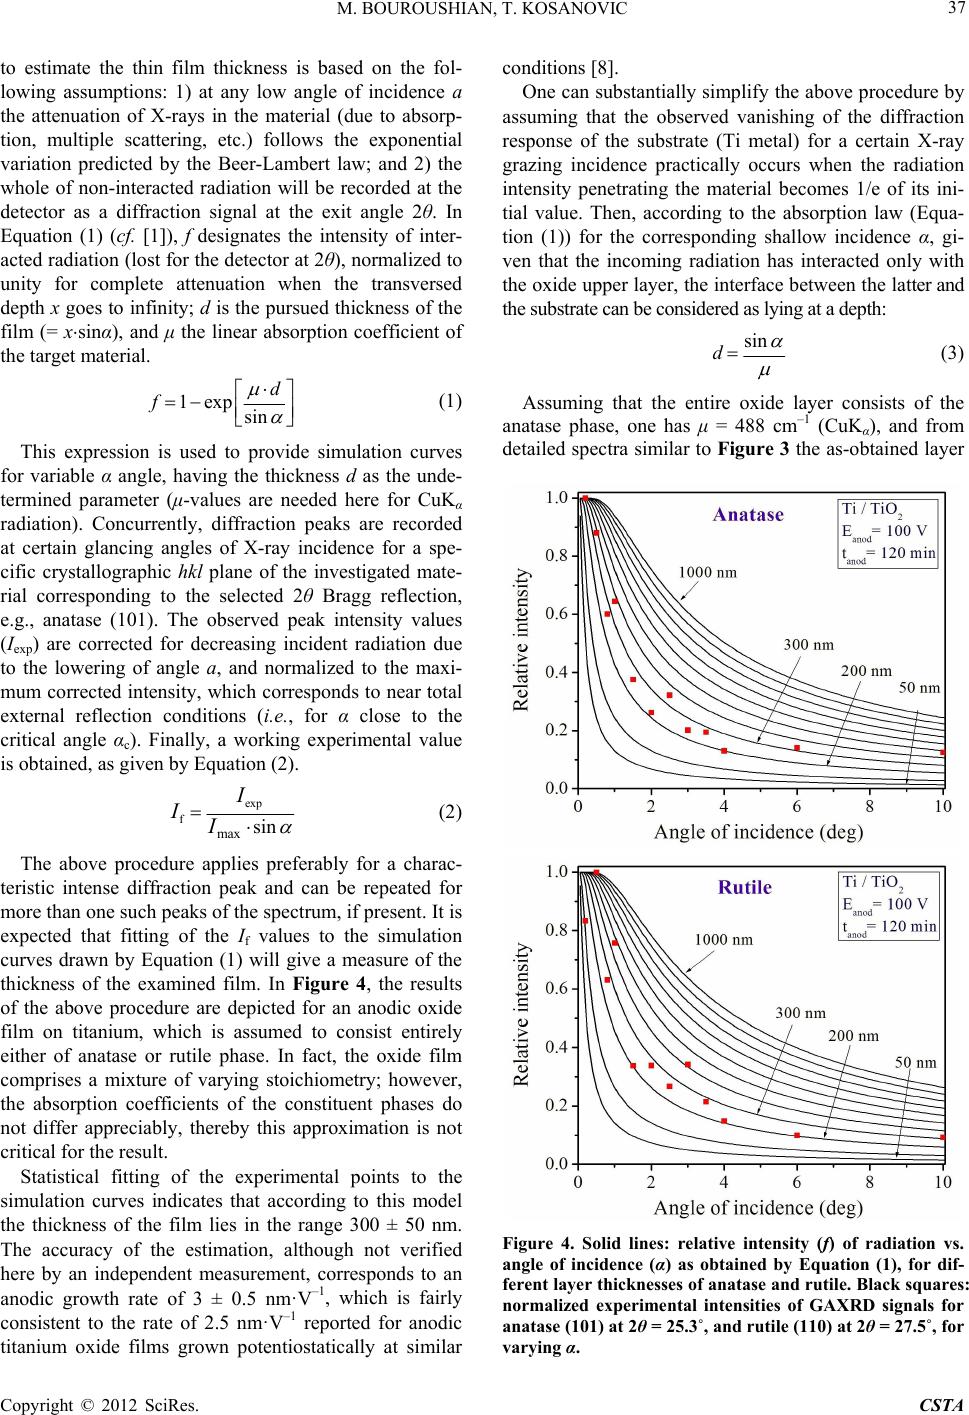 M. BOUROUSHIAN, T. KOSANOVIC 37 to estimate the thin film thickness is based on the fol- lowing assumptions: 1) at any low angle of incidence a the attenuation of X-rays in the material (due to absorp- tion, multiple scattering, etc.) follows the exponential variation predicted by the Beer-Lambert law; and 2) the whole of non-interacted radiation will be recorded at the detector as a diffraction signal at the exit angle 2θ. In Equation (1) (cf. [1]), f designates the intensity of inter- acted radiation (lost for the detector at 2θ), normalized to unity for complete attenuation when the transversed depth x goes to infinity; d is the pursued thickness of the film (= xsinα), and μ the linear absorption coefficient of the target material. 1exp sin d f (1) This expression is used to provide simulation curves for variable α angle, having the thickness d as the unde- termined parameter (μ-values are needed here for CuKα radiation). Concurrently, diffraction peaks are recorded at certain glancing angles of X-ray incidence for a spe- cific crystallographic hkl plane of the investigated mate- rial corresponding to the selected 2θ Bragg reflection, e.g., anatase (101). The observed peak intensity values (Iexp) are corrected for decreasing incident radiation due to the lowering of angle a, and normalized to the maxi- mum corrected intensity, which corresponds to near total external reflection conditions (i.e., for α close to the critical angle αc). Finally, a working experimental value is obtained, as given by Equation (2). exp f max sin I II (2) The above procedure applies preferably for a charac- teristic intense diffraction peak and can be repeated for more than one such peaks of the spectrum, if present. It is expected that fitting of the If values to the simulation curves drawn by Equation (1) will give a measure of the thickness of the examined film. In Figure 4, the results of the above procedure are depicted for an anodic oxide film on titanium, which is assumed to consist entirely either of anatase or rutile phase. In fact, the oxide film comprises a mixture of varying stoichiometry; however, the absorption coefficients of the constituent phases do not differ appreciably, thereby this approximation is not critical for the result. Statistical fitting of the experimental points to the simulation curves indicates that according to this model the thickness of the film lies in the range 300 ± 50 nm. The accuracy of the estimation, although not verified here by an independent measurement, corresponds to an anodic growth rate of 3 ± 0.5 nm·V–1, which is fairly consistent to the rate of 2.5 nm·V–1 reported for anodic titanium oxide films grown potentiostatically at similar conditions [8]. One can substantially simplify the above procedure by assuming that the observed vanishing of the diffraction response of the substrate (Ti metal) for a certain X-ray grazing incidence practically occurs when the radiation intensity penetrating the material becomes 1/e of its ini- tial value. Then, according to the absorption law (Equa- tion (1)) for the corresponding shallow incidence α, gi- ven that the incoming radiation has interacted only with the oxide upper layer, the interface between the latter and the substrate can be considered as lying at a depth: sin d (3) Assuming that the entire oxide layer consists of the anatase phase, one has μ = 488 cm–1 (CuKα), and from detailed spectra similar to Figure 3 the as-obtained layer Figure 4. Solid lines: relative intensity (f) of radiation vs. angle of incidence (α) as obtained by Equation (1), for dif- ferent layer thicknesses of anatase and rutile. Black squares: normalized experimental intensities of GAXRD signals for anatase (101) at 2θ = 25.3˚, and rutile (110) at 2θ = 27.5˚, for varying α. Copyright © 2012 SciRes. CSTA 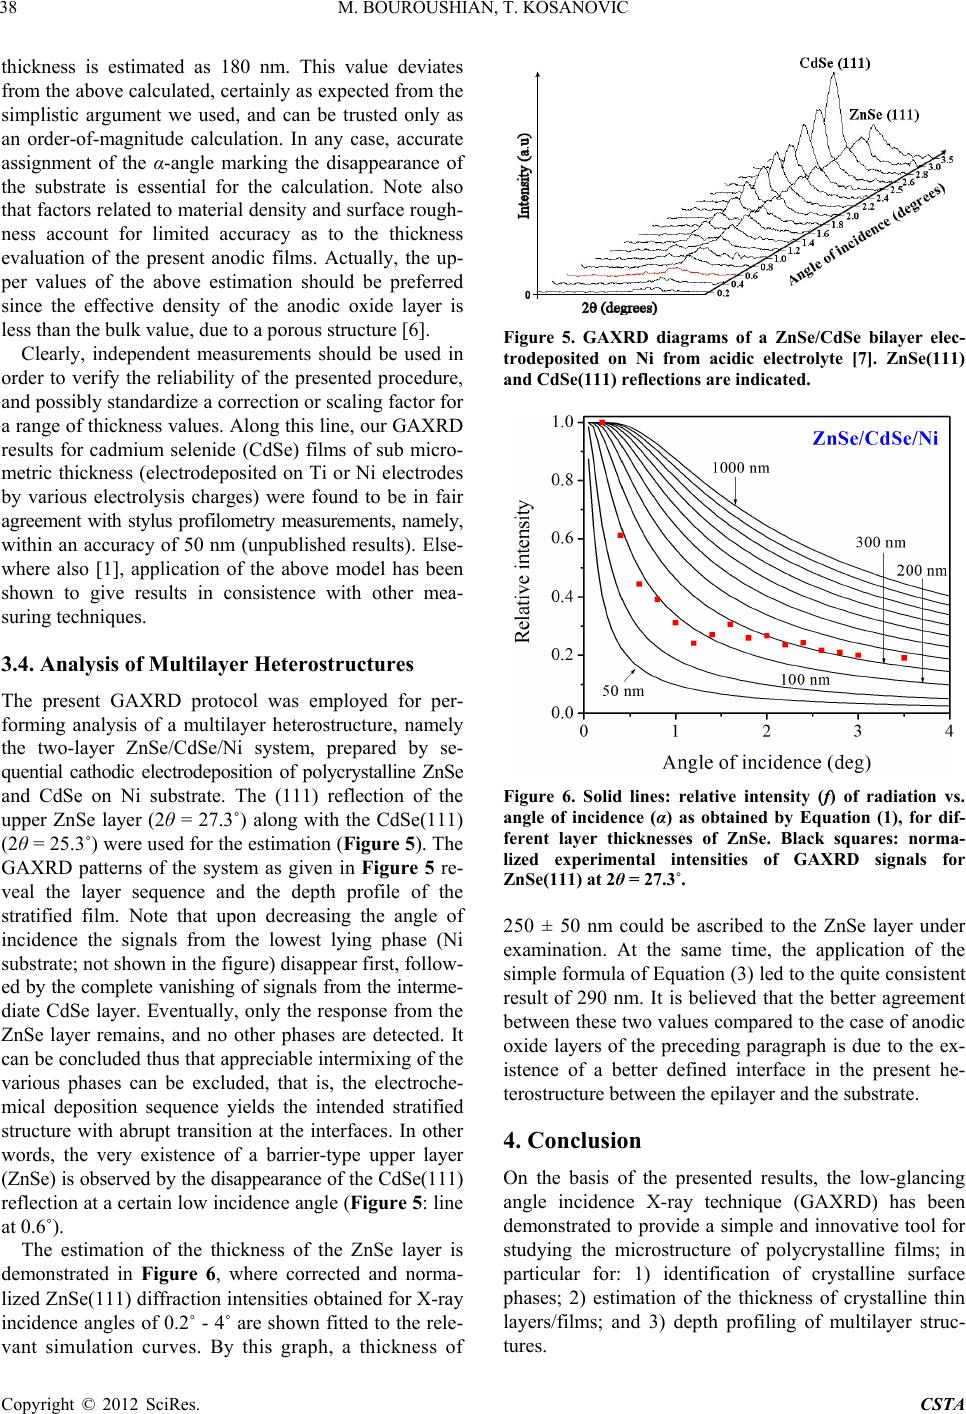 M. BOUROUSHIAN, T. KOSANOVIC 38 thickness is estimated as 180 nm. This value deviates from the above calculated, certainly as expected from the simplistic argument we used, and can be trusted only as an order-of-magnitude calculation. In any case, accurate assignment of the α-angle marking the disappearance of the substrate is essential for the calculation. Note also that factors related to material density and surface rough- ness account for limited accuracy as to the thickness evaluation of the present anodic films. Actually, the up- per values of the above estimation should be preferred since the effective density of the anodic oxide layer is less than the bulk value, due to a porous structure [6]. Clearly, independent measurements should be used in order to verify the reliability of the presented procedure, and possibly standardize a correction or scaling factor for a range of thickness values. Along this line, our GAXRD results for cadmium selenide (CdSe) films of sub micro- metric thickness (electrodeposited on Ti or Ni electrodes by various electrolysis charges) were found to be in fair agreement with stylus profilometry measurements, namely, within an accuracy of 50 nm (unpublished results). Else- where also [1], application of the above model has been shown to give results in consistence with other mea- suring techniques. 3.4. Analysis of Multilayer Heterostructures The present GAXRD protocol was employed for per- forming analysis of a multilayer heterostructure, namely the two-layer ZnSe/CdSe/Ni system, prepared by se- quential cathodic electrodeposition of polycrystalline ZnSe and CdSe on Ni substrate. The (111) reflection of the upper ZnSe layer (2θ = 27.3˚) along with the CdSe(111) (2θ = 25.3˚) were used for the estimation (Figure 5). The GAXRD patterns of the system as given in Figure 5 re- veal the layer sequence and the depth profile of the stratified film. Note that upon decreasing the angle of incidence the signals from the lowest lying phase (Ni substrate; not shown in the figure) disappear first, follow- ed by the complete vanishing of signals from the interme- diate CdSe layer. Eventually, only the response from the ZnSe layer remains, and no other phases are detected. It can be concluded thus that appreciable intermixing of the various phases can be excluded, that is, the electroche- mical deposition sequence yields the intended stratified structure with abrupt transition at the interfaces. In other words, the very existence of a barrier-type upper layer (ZnSe) is observed by the disappearance of the CdSe(111) reflection at a certain low incidence angle (Figure 5: line at 0.6˚). The estimation of the thickness of the ZnSe layer is demonstrated in Figure 6, where corrected and norma- lized ZnSe(111) diffraction intensities obtained for X-ray incidence angles of 0.2˚ - 4˚ are shown fitted to the rele- vant simulation curves. By this graph, a thickness of Figure 5. GAXRD diagrams of a ZnSe/CdSe bilayer elec- trodeposited on Ni from acidic electrolyte [7]. ZnSe(111) and CdSe(111) reflections are indicated. Figure 6. Solid lines: relative intensity (f) of radiation vs. angle of incidence (α) as obtained by Equation (1), for dif- ferent layer thicknesses of ZnSe. Black squares: norma- lized experimental intensities of GAXRD signals for ZnSe(111) at 2θ = 27.3˚. 250 ± 50 nm could be ascribed to the ZnSe layer under examination. At the same time, the application of the simple formula of Equation (3) led to the quite consistent result of 290 nm. It is believed that the better agreement between these two values compared to the case of anodic oxide layers of the preceding paragraph is due to the ex- istence of a better defined interface in the present he- terostructure between the epilayer and the substrate. 4. Conclusion On the basis of the presented results, the low-glancing angle incidence X-ray technique (GAXRD) has been demonstrated to provide a simple and innovative tool for studying the microstructure of polycrystalline films; in particular for: 1) identification of crystalline surface phases; 2) estimation of the thickness of crystalline thin layers/films; and 3) depth profiling of multilayer struc- tures. Copyright © 2012 SciRes. CSTA  M. BOUROUSHIAN, T. KOSANOVIC Copyright © 2012 SciRes. CSTA 39 REFERENCES [1] M. Nauer, K. Ernst, W. Kautek and M. Neumann-Spallart, “Depth Profile Characterization of Electrodeposited Multi- Thin-Film Structures by Low Angle of Incidence X-Ray Diffractometry,” Thin Solid Films, Vol. 489, No. 1-2, 2005, pp. 86-93. doi:10.1016/j.tsf.2005.05.008 [2] K. Wang, C. Steimer, D. Wamwangi, S. Ziegler and M. Wuttig, “Effect of Indium Doping on Ge2Sb2Te5 Thin Films for Phase-Change Optical Storage,” Applied Phy- sics A: Materials Science & Processing, Vol. 80, No. 8, 2005, pp. 1611-1616. doi:10.1007/s00339-005-3232-2 [3] P. Colombi, P. Zanola, E. Bontempi, R. Roberti, M. Gelfi and L. E. Depero, “Glancing-Incidence X-Ray Diffraction for Depth Profiling of Polycrystalline Layers,” Journal of Applied Crystallography, Vol. 39, Part 2, 2006, pp. 176- 179. doi:10.1107/S0021889805042779 [4] S. Debnath, P. Predecki and R. Suryanarayanan, “Use of Glancing Angle X-Ray Powder Diffractometry to Depth- Profile Phase Transformations during Dissolution of In- domethacin and Theophylline Tablets,” Pharmaceutical Research, Vol. 21, No. 1, 2004, pp. 149-159. doi:10.1023/B:PHAM.0000012163.89163.f8 [5] A. A. Williams, J. M. C. Thornton, J. E. Macdonald, R. G. Vansilfhout, J. F. Vanderveen, M. S. Finney, A. D. John- son and C. Norris, “Strain Relaxation during the Initial Stages of Growth in Ge/Si(001),” Physical Review B, Vol. 43, No. 6, 1991, pp. 5001-5011. doi:10.1103/PhysRevB.43.5001 [6] T. Kosanovic, D. Karoussos and M. Bouroushian, “CdSe Electrodeposition on Anodic, Barrier or Porous Ti Oxides. A Sensitization Effect,” Journal of Solid State Electro- chemistry, Vol. 14, No. 2, 2010, pp. 241-248. doi:10.1007/s10008-009-0806-5 [7] M. Bouroushian, T. Kosanovic and N. Spyrellis, “Ori- ented ZnSe Electrodeposits Grown on Polycrystalline CdSe Substrates,” Journal of Crystal Growth, Vol. 277, No. 1-4, 2005, pp. 335-344. doi:10.1016/j.jcrysgro.2005.01.053 [8] K. Leitner, J. W. Schultze and U. Stimming, “Photoelec- trochemical Investigations of Passive Films on Titanium Electrodes,” Journal of the Electrochemical Society, Vol. 133, No. 8, 1986, pp. 1561-1568. doi:10.1149/1.2108969 |