

Paper Menu >>
Journal Menu >>
 Journal of Sensor Technology, 2012, 2, 196-205 http://dx.doi.org/10.4236/jst.2012.24027 Published Online December 2012 (http://www.SciRP.org/journal/jst) Nonlinear Response of Multi-Segmented Photodetectors Used for Measurements of Microcantilever Motion over Large Dynamic Ranges Asit Kar, Mi c hae l George Laboratory for Materials and Surface Science, Department of Chemistry, University of Alabama in Huntsville, Huntsville, USA Email: [email protected] Received September 8, 2012; revised October 10, 2012; accepted November 12, 2012 ABSTRACT The use of multi-segmented Position Sensitive Photodiodes (PSD) to measure microcantilever deflections have been found to produce nonlinear signal output, especially when the dynamic range is large. The reflected beam of the micro- cantilever may undergo intensity and shape modifications prior to reaching the PSD. In a multi-microcantilever sensor system the variation in the size of the individual spots plays an additional role contributing to the nonlinearities of de- tector output. Irrespective of the range of operation the merits of intensity normalization have been discussed. We show that the output is proportional to the width of the spot along the split line of the detector. This enables the determination of the shape of a spot. We show that the microcantilever vibrational spectrum can be obtained just using a single seg- ment photodetector instead of using multiple segmented PSDs. These concepts will greatly facilitate interpretation of sensor data acquired from either single or multi-microcantilever experimental platforms. Keywords: Photodetectors; Microcantilever Sensors; Signal Artifacts; Laser Spot Shape; AFM 1. Introduction The use of a reflected laser spot from the microcantilever to a PSD [1,2] to measure microcantilever motion has been one of the established techniques for the study of chemical [3-9], biological [10-13] and physical [14-18] processes for scanning force microscopy [19,20] as well as microcantilever sensors. In recent years, the necessity of the use of a multi-microcantilever readout system as a sensing device has been realized. [21] A number of re- search teams has come up with possible solutions to de- velop a sensor device containing multiple microcanti- levers working on the principle of optical beam deflec- tion [3,22,23]. In usual scanning force microscopes the deflection of the cantilever beam is small and is limited within a few tens of nanometers depending on the rough- ness of the sample surface. While in microcantilever based sensor experiments, the cantilever can deflect extending from a few hundred nanometers [24-27] to several mi- crometers. [28] With the intrinsic sensitivity of micro- cantilever chemical and biological sensors, it is vital to maintain the linearity of the differential deflection of microcantilever systems, especially where identical mi- crocantilevers are employed for sensor and reference sig- nals [21]. Calibration or the position sensitivity of a two segment PSD is changed if the size and shape of the spot are al- tered depending on optical alignment, shape of the free end of a microcantilever or any random factor. For any shape other than a rectangle, the signal output varies with the geometry of the spot and its location on the detector. With a few nanometers of deflection, an oval shaped spot can approximately behave like a rectangle thus producing a near linear output signal as is the case for SFM. This is usually not the case for microcantilever based sensor experiments where the spot can move much more due to considerable changes in surface stress and free energy during the sensing event. Therefore, when calibrating the detector, the full range of spot displacement must be measured and recorded. Lack of prior knowledge about the nature of spot shapes and concurrent photodiode out- put may lead to misinterpretation of the readout signals. The effect of noise in an optical deflection technique with respect to the minimum detectable displacement has been discussed before [29-31]. Gustafsson and Clarke [32] have demonstrated that appropriate design of cantilevers results in lower shot-noise improving performance. Schäf- fer [33] has discussed the aspects of linearity and dyna- mic range at large cantilever deflections. It has been shown that a detector made of a linear arrangement of multiple photodiode segments [34] can provide a large dynamical range. D’Costa and Hoh [35] have experienced the effect C opyright © 2012 SciRes. JST 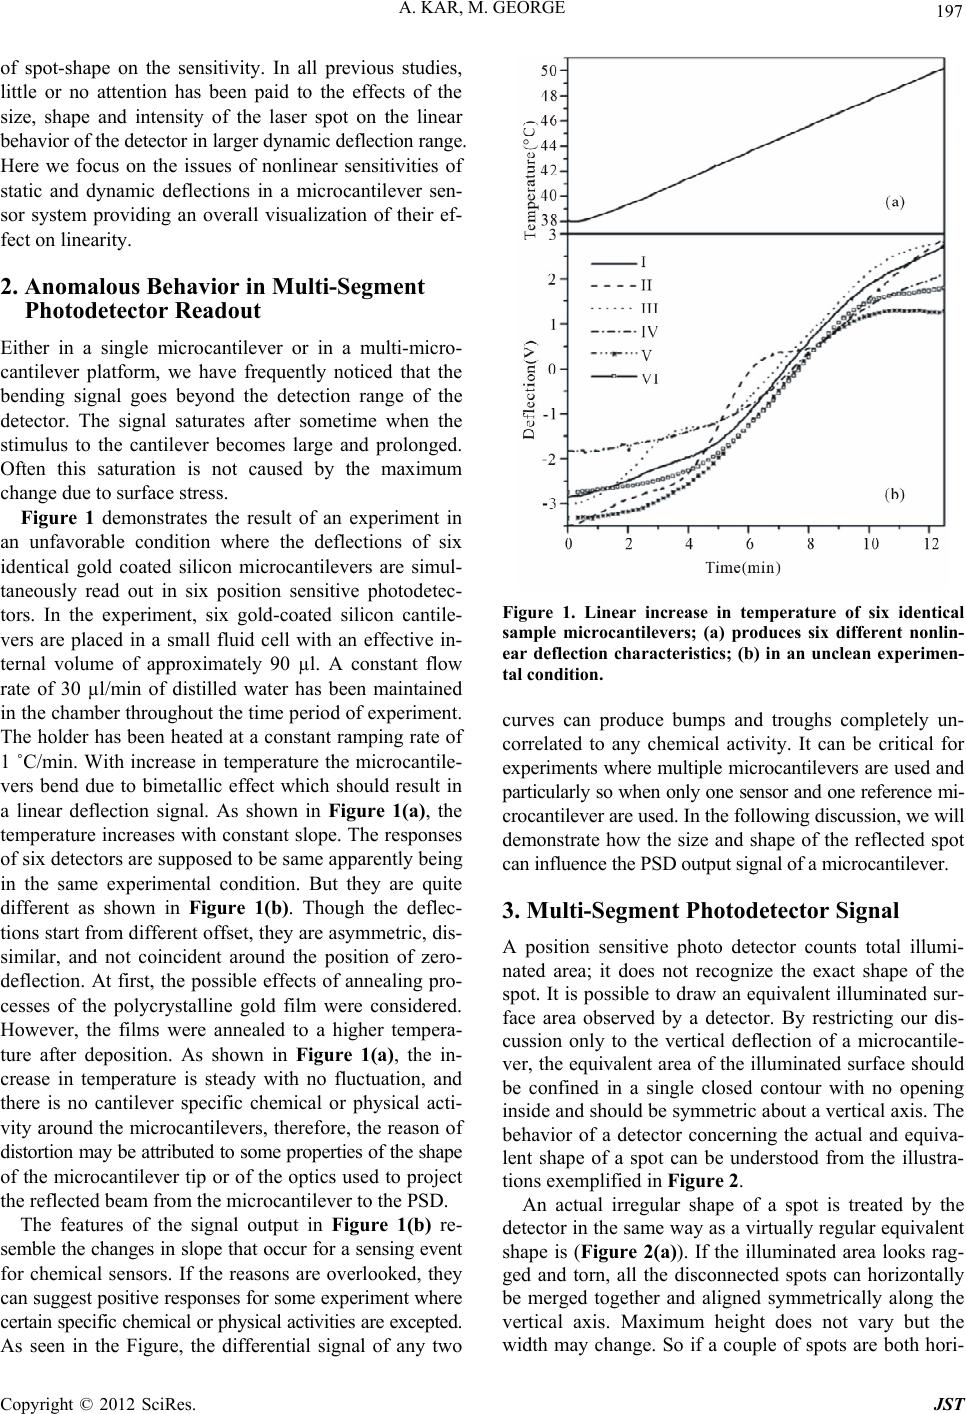 A. KAR, M. GEORGE 197 of spot-shape on the sensitivity. In all previous studies, little or no attention has been paid to the effects of the size, shape and intensity of the laser spot on the linear behavior of the detector in larger dynamic deflection range. Here we focus on the issues of nonlinear sensitivities of static and dynamic deflections in a microcantilever sen- sor system providing an overall visualization of their ef- fect on linearity. 2. Anomalous Behavior in Multi-Segment Photodetector Readout Either in a single microcantilever or in a multi-micro- cantilever platform, we have frequently noticed that the bending signal goes beyond the detection range of the detector. The signal saturates after sometime when the stimulus to the cantilever becomes large and prolonged. Often this saturation is not caused by the maximum change due to surface stress. Figure 1 demonstrates the result of an experiment in an unfavorable condition where the deflections of six identical gold coated silicon microcantilevers are simul- taneously read out in six position sensitive photodetec- tors. In the experiment, six gold-coated silicon cantile- vers are placed in a small fluid cell with an effective in- ternal volume of approximately 90 µl. A constant flow rate of 30 µl/min of distilled water has been maintained in the chamber throughout the time period of experiment. The holder has been heated at a constant ramping rate of 1 ˚C/min. With increase in temperature the microcantile- vers bend due to bimetallic effect which should result in a linear deflection signal. As shown in Figure 1(a), the temperature increases with constant slope. The responses of six detectors are supposed to be same apparently being in the same experimental condition. But they are quite different as shown in Figure 1(b). Though the deflec- tions start from different offset, they are asymmetric, dis- similar, and not coincident around the position of zero- deflection. At first, the possible effects of annealing pro- cesses of the polycrystalline gold film were considered. However, the films were annealed to a higher tempera- ture after deposition. As shown in Figure 1(a), the in- crease in temperature is steady with no fluctuation, and there is no cantilever specific chemical or physical acti- vity around the microcantilevers, therefore, the reason of distortion may be attributed to some properties of the shape of the microcantilever tip or of the optics used to project the reflected beam from the microcantilever to the PSD. The features of the signal output in Figure 1(b) re- semble the changes in slope that occur for a sensing event for chemical sensors. If the reasons are overlooked, they can suggest positive responses for some experiment where certain specific chemical or physical activities are excepted. As seen in the Figure, the differential signal of any two Figure 1. Linear increase in temperature of six identical sample microcantilevers; (a) produces six different nonlin- ear deflection characteristics; (b) in an unclean experimen- tal condition. curves can produce bumps and troughs completely un- correlated to any chemical activity. It can be critical for experiments where multiple microcantilevers are used and particularly so when only one sensor and one reference mi- crocantilever are used. In the following discussion, we will demonstrate how the size and shape of the reflected spot can influence the PSD output signal of a microcantilever. 3. Multi-Segment Photodetector Signal A position sensitive photo detector counts total illumi- nated area; it does not recognize the exact shape of the spot. It is possible to draw an equivalent illuminated sur- face area observed by a detector. By restricting our dis- cussion only to the vertical deflection of a microcantile- ver, the equivalent area of the illuminated surface should be confined in a single closed contour with no opening inside and should be symmetric about a vertical axis. The behavior of a detector concerning the actual and equiva- lent shape of a spot can be understood from the illustra- tions exemplified in Figure 2. An actual irregular shape of a spot is treated by the detector in the same way as a virtually regular equivalent shape is (Figure 2(a)). If the illuminated area looks rag- ged and torn, all the disconnected spots can horizontally be merged together and aligned symmetrically along the vertical axis. Maximum height does not vary but the width may change. So if a couple of spots are both hori- Copyright © 2012 SciRes. JST 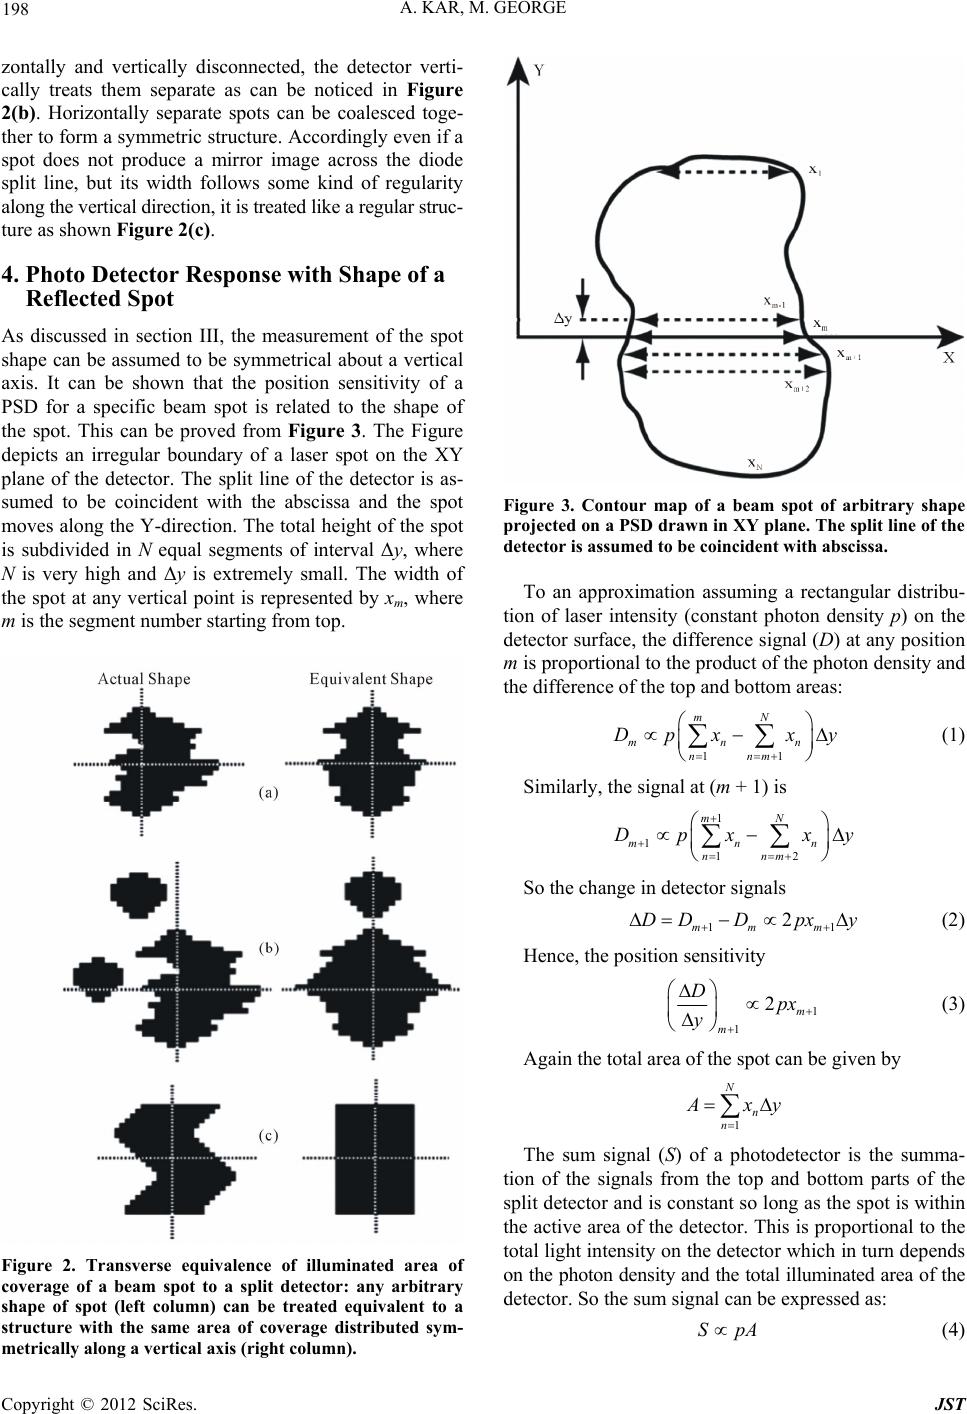 A. KAR, M. GEORGE 198 zontally and vertically disconnected, the detector verti- cally treats them separate as can be noticed in Figure 2(b). Horizontally separate spots can be coalesced toge- ther to form a symmetric structure. Accordingly even if a spot does not produce a mirror image across the diode split line, but its width follows some kind of regularity along the vertical direction, it is treated like a regular struc- ture as shown Figure 2(c). 4. Photo Detector Response with Shape of a Reflected Spot As discussed in section III, the measurement of the spot shape can be assumed to be symmetrical about a vertical axis. It can be shown that the position sensitivity of a PSD for a specific beam spot is related to the shape of the spot. This can be proved from Figure 3. The Figure depicts an irregular boundary of a laser spot on the XY plane of the detector. The split line of the detector is as- sumed to be coincident with the abscissa and the spot moves along the Y-direction. The total height of the spot is subdivided in N equal segments of interval Δy, where N is very high and Δy is extremely small. The width of the spot at any vertical point is represented by xm, where m is the segment number starting from top. Figure 2. Transverse equivalence of illuminated area of coverage of a beam spot to a split detector: any arbitrary shape of spot (left column) can be treated equivalent to a structure with the same area of coverage distributed sym- Figure 3. Contour map of a beam spot of arbitrary shap To an approximation assuming a rectangular distribu- tio y e projected on a PSD draw n in XY plane. The split line of the detector is assumed to be coincide nt w ith absc issa. n of laser intensity (constant photon density p) on the detector surface, the difference signal (D) at any position m is proportional to the product of the photon density and the difference of the top and bottom areas: mN 11 mnn nnm Dpx x (1) Similarly, the signal at (m + 1) is y 1mN 1 12 mn n nnm Dpx x So the change in detector signals 11 2 mm DD Dm px y (2) Hence, the position sensitivity 1 1 2m m D px y (3) Again the total area of the spot can be given by 1 n n N A xy The sum signal (S) of a photodetector is the summa- tion of the signals from the top and bottom parts of the split detector and is constant so long as the spot is within the active area of the detector. This is proportional to the total light intensity on the detector which in turn depends on the photon density and the total illuminated area of the detector. So the sum signal can be expressed as: SpA (4) metrically along a vertical axis (right column). Copyright © 2012 SciRes. JST  A. KAR, M. GEORGE 199 The difference signal of a P by SD is usually normalized the sum signal. If D is sum-normalized, Equation (1) takes the form, Sum Norm11 1mN mn nnm n xxy A (5) So if we consider the sensitivity of sum-no di D rmalized fference signal, Equation (3) becomes, 1 1Sum Norm 2Dm m x yA (6) Equations (3) and (6) imply that, at any position of the sp determining the shape of r Spot a simplified form of an elliptical or ot the sensitivity of the detector is proportional to the width of the spot along the split line. So if the sensitivity profile of a PSD for an unknown beam is known, one can approximate the possible equivalent shape of the beam spot. The sensitivity curve is directly obtained from the positional derivative of the bending profile. 5. Shape Determination To have an intuitive idea about a spot, in the following we consider three simple fre- quently encountered ideal geometric structures presum- ably produced by the similar shaped free ends of micro- cantilevers. 5.1. Circula A circular structure is oval spot shape where both width and slope of the boun- dary-line of the spot change along vertical direction. This is presented in Figure 4. Figure 4(a) shows a circular spot of radius r. Vertical displacement of the spot is repre- sented by the variable y; it signifies the coordinate of the center C of the circle with respect to an origin on the split line OX. The difference signal of the circle can be ex- pressed by: 2 221 π2cos1 yy Dpr ryr rr (7) A graphical presentation of the above equation is shown in Figure 4(b) in arbitrary units assuming the radius of the circle to be 1 unit. From top to bottom total dis- placement of the circle is 2 units. Data have been plotted with the displacement axis horizontally aligned. A slightly S-shape of the deflection curve is characteristic of any oval shaped illumination spot. Figure 4(c) shows the nu- merical derivative of the deflection curve in Figure 4(b). This gives the PSD sensitivity characteristic of a circular spot. It is clear from this Figure that the position sensiti- vity is never constant for an elliptical spot. It has a mini- mum at the top and bottom and goes to a maximum along the diameter. The extremes correspond to the minimum and maximum width of the circle. Dif- ferentiating Equa- tion (7) with respect to y and simplifying give, 22 2 1d 1 d Dy yr a (8) where a is a constant. This is the equatio the curve of Figure 4(c) shows. Substituting y with x (the n of an ellipse as width of the circle at any point along vertical direction) gives, dD2 dpx y (9) Equation (9) is exactly the sam rived for a generalized shape. s half of the original sh iangle as shown in Figure 5(a). of the spot changes along ver- e as Equation (3) de- The semi-oval shaped curve is an indication of the shape of the spot. But it appears a ape. The reason has been explained before. The detec- tor does not recognize the exact shape but an equivalent shape. To get back the original shape it is necessary to redistribute the sensitivity values symmetrically along the displacement axis. As the sensitivity values are not ab- solute, the same task can be performed by taking a mirror image of the profile and viewing both together. Finally it is necessary to rotate the whole image by –90˚ to have the displacement axis vertical and the original orientation of the spot. The operations yield an ellipse instead of a circle due to the unknown proportionality constant. 5.2. Triangular Spot We consider a bilateral tr In this example the width tical direction but the slope of the tangent at any point on the boundary remains constant. Figure 4. Spot shape determi nation from PSD out put for; (a) Circular spot; (b) Deflection characteristic and; (c) Sensiti- vity profile. Sensitivity curve in conjunction with its mirror reflection produces an elliptical shape imitating the spot shape. Upward movement of spot in (a) corresponds to a right- ward movement in (b). Copyright © 2012 SciRes. JST 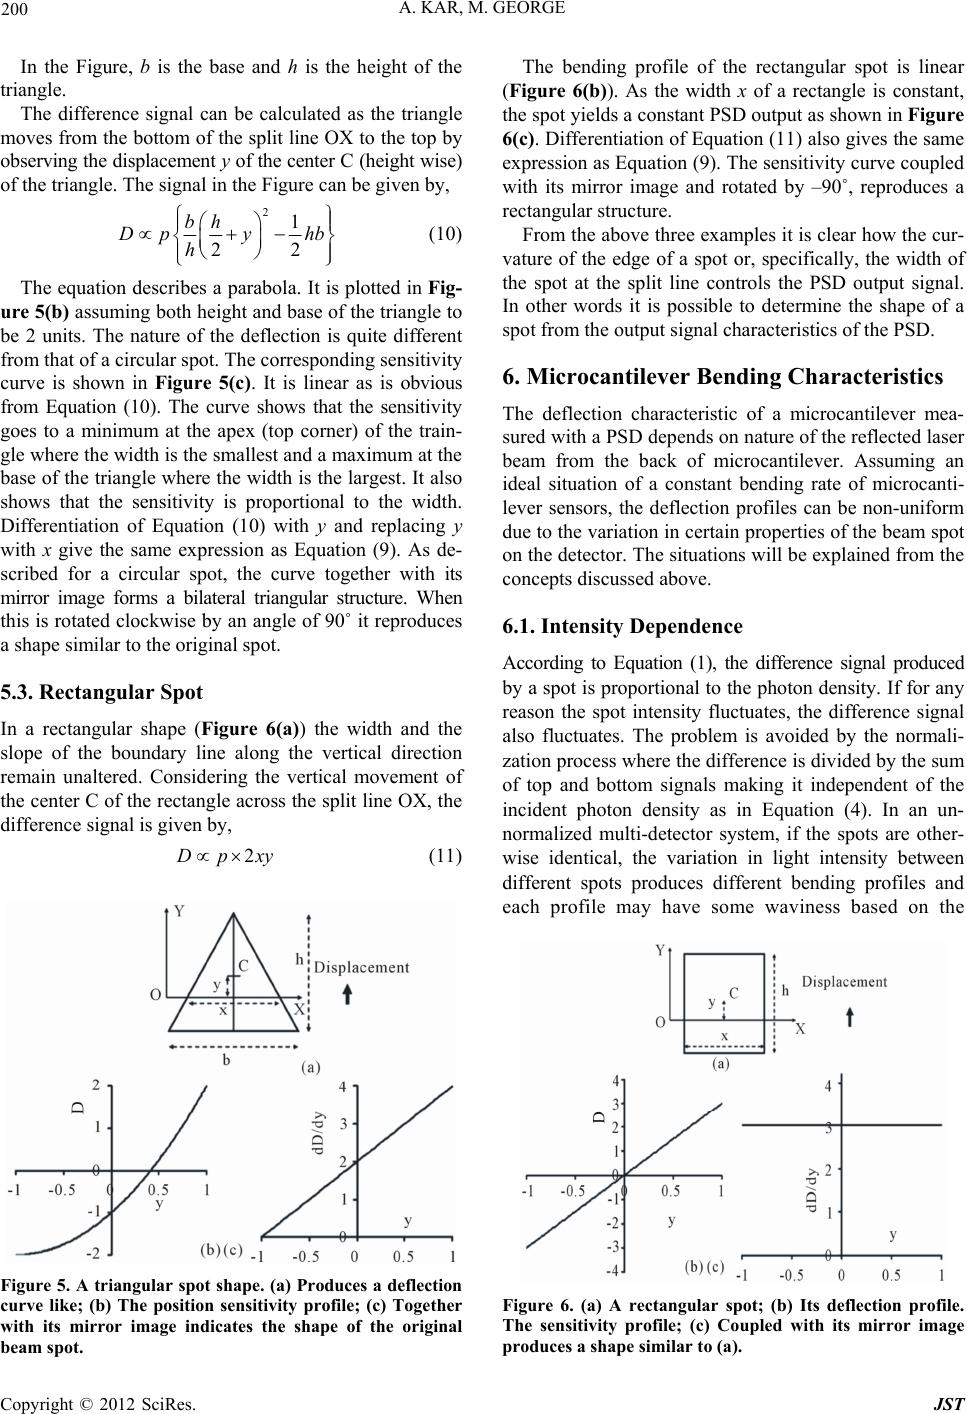 A. KAR, M. GEORGE 200 In the Figure, b is the base and h is the height of the triangle. The difference signal can be calculated as the triangle moves from the bottom of the split line OX to the top by observing the displacement y of the center C (height wise) of the triangle. The signal in the Figure can be given by, 21 22 bh Dpy hb h (10) The equation describes a parabola. It i ure 5(b) assuming both height and base of th be In a rectangular shape (Figure 6(a)) the width and the e along the vertical direction s plotted in Fig- e triangle to 2 units. The nature of the deflection is quite different from that of a circular spot. The corresponding sensitivity curve is shown in Figure 5(c). It is linear as is obvious from Equation (10). The curve shows that the sensitivity goes to a minimum at the apex (top corner) of the train- gle where the width is the smallest and a maximum at the base of the triangle where the width is the largest. It also shows that the sensitivity is proportional to the width. Differentiation of Equation (10) with y and replacing y with x give the same expression as Equation (9). As de- scribed for a circular spot, the curve together with its mirror image forms a bilateral triangular structure. When this is rotated clockwise by an angle of 90˚ it reproduces a shape similar to the original spot. 5.3. Rectangular Spot slope of the boundary lin remain unaltered. Considering the vertical movement of the center C of the rectangle across the split line OX, the difference signal is given by, 2Dpxy (11) Figure 5. A triangular spot shape. (a) Produces a deflection curve like; (b) The position sensitivity profile; (c) Togethe with its mirror image indicates the shape of the origina The deflection characteristic of a microcantilever mea- r According to Equation (1), the difference signal produced photon density. If for any r l beam spot. The bending profile of the rectangular spot is linear (Figure 6(b)). As the width x of a rectangle is constant, the spot yields a constant PSD output as shown in Figure 6(c). Differentiation of Equation (11) also gives the same expression as Equation (9). The sensitivity curve coupled with its mirror image and rotated by –90˚, reproduces a rectangular structure. From the above three examples it is clear how the cur- vature of the edge of a spot or, specifically, the width of the spot at the split line controls the PSD output signal. In other words it is possible to determine the shape of a spot from the output signal characteristics of the PSD. 6. Microcantilever Bending Characteristics sured with a PSD depends on nature of the reflected lase beam from the back of microcantilever. Assuming an ideal situation of a constant bending rate of microcanti- lever sensors, the deflection profiles can be non-uniform due to the variation in certain properties of the beam spot on the detector. The situations will be explained from the concepts discussed above. 6.1. Intensity Dependence by a spot is proportional to the reason the spot intensity fluctuates, the difference signal also fluctuates. The problem is avoided by the normali- zation process where the difference is divided by the sum of top and bottom signals making it independent of the incident photon density as in Equation (4). In an un- normalized multi-detector system, if the spots are other- wise identical, the variation in light intensity between different spots produces different bending profiles and each profile may have some waviness based on the Figure 6. (a) A rectangular spot; (b) Its deflection profile. The sensitivity profile; (c) Coupled with its mirror imae produces a shape similar to (a). g Copyright © 2012 SciRes. JST 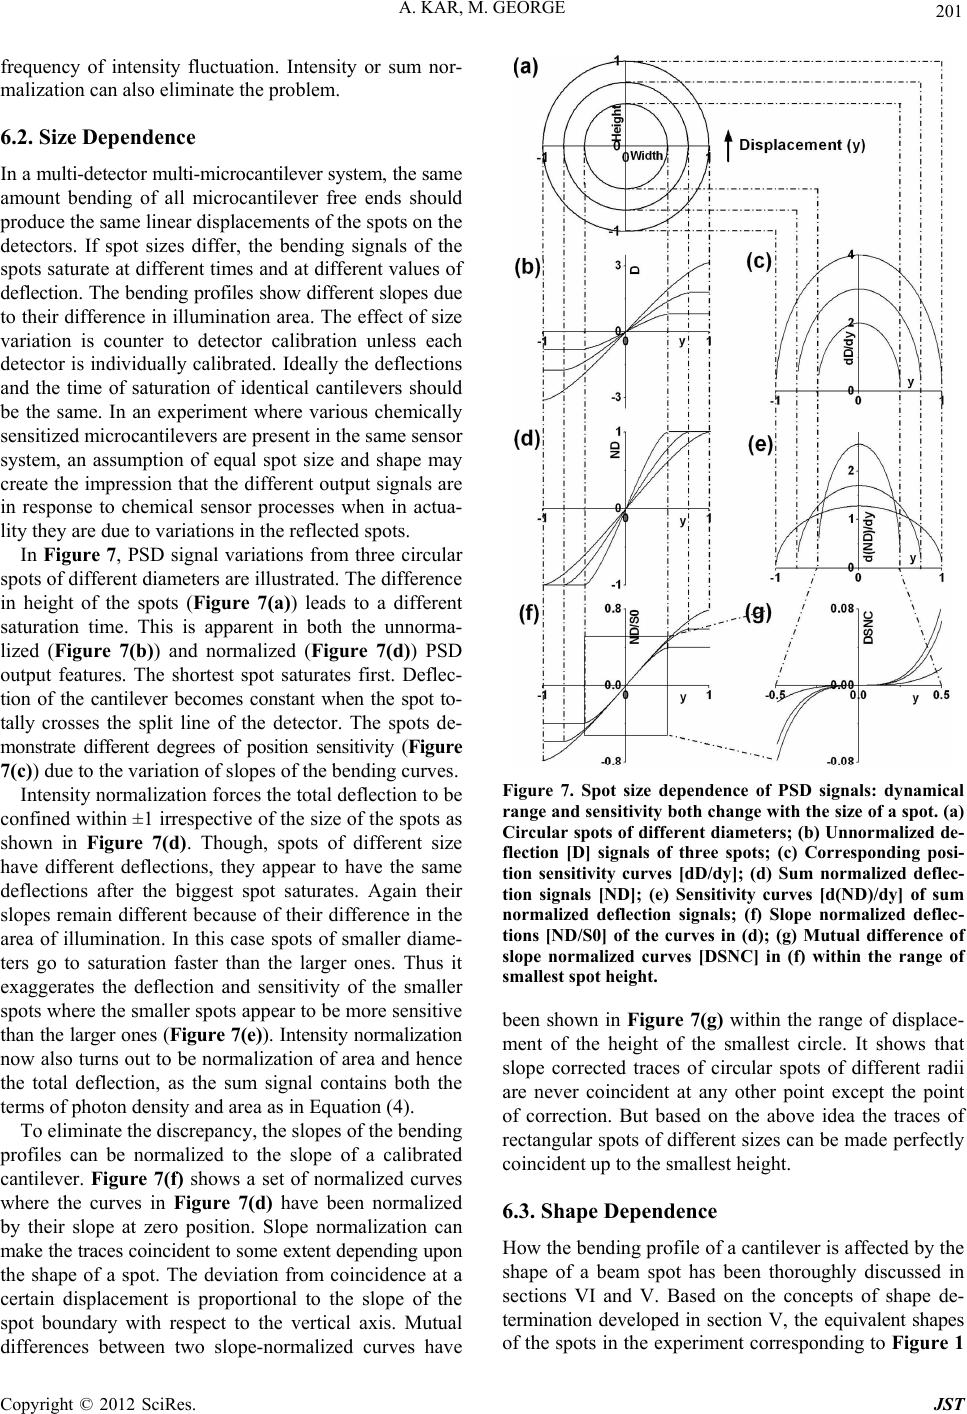 A. KAR, M. GEORGE 201 frequency of intensity fluctuation. Intensity or sum nor- malization can also eliminate the problem. 6.2. Size Dependence In a multi-detector multi-microcantilever system, the same free ends should amount bending of all microcantilever produce the same linear displacements of the spots on the detectors. If spot sizes differ, the bending signals of the spots saturate at different times and at different values of deflection. The bending profiles show different slopes due to their difference in illumination area. The effect of size variation is counter to detector calibration unless each detector is individually calibrated. Ideally the deflections and the time of saturation of identical cantilevers should be the same. In an experiment where various chemically sensitized microcantilevers are present in the same sensor system, an assumption of equal spot size and shape may create the impression that the different output signals are in response to chemical sensor processes when in actua- lity they are due to variations in the reflected spots. In Figure 7, PSD signal variations from three circular spots of different diameters are illustrated. The difference in height of the spots (Figure 7(a)) leads to a different saturation time. This is apparent in both the unnorma- lized (Figure 7(b)) and normalized (Figure 7(d)) PSD output features. The shortest spot saturates first. Deflec- tion of the cantilever becomes constant when the spot to- tally crosses the split line of the detector. The spots de- monstrate different degrees of position sensitivity (Figure 7(c)) due to the variation of slopes of the bending curves. Intensity normalization forces the total deflection to be confined within ±1 irrespective of the size of the spots as shown in Figure 7(d). Though, spots of different size have different deflections, they appear to have the same deflections after the biggest spot saturates. Again their slopes remain different because of their difference in the area of illumination. In this case spots of smaller diame- ters go to saturation faster than the larger ones. Thus it exaggerates the deflection and sensitivity of the smaller spots where the smaller spots appear to be more sensitive than the larger ones (Figure 7(e)). Intensity normalization now also turns out to be normalization of area and hence the total deflection, as the sum signal contains both the terms of photon density and area as in Equation (4). To eliminate the discrepancy, the slopes of the bending profiles can be normalized to the slope of a calibrated cantilever. Figure 7(f) shows a set of normalized curves where the curves in Figure 7(d) have been normalized by their slope at zero position. Slope normalization can make the traces coincident to some extent depending upon the shape of a spot. The deviation from coincidence at a certain displacement is proportional to the slope of the spot boundary with respect to the vertical axis. Mutual differences between two slope-normalized curves have Figure 7. Spot size dependence of PSD signals: dynamical range and sensitivity both change with the size of a spot. (a) Circular spots of different diameters; (b) Unnormalized d lope corrected traces of circular spots of different radii er is affected by the een thoroughly discussed in n the concepts of shape de- e- flection [D] signals of three spots; (c) Corresponding posi- tion sensitivity curves [dD/dy]; (d) Sum normalized deflec- tion signals [ND]; (e) Sensitivity curves [d(ND)/dy] of sum normalized deflection signals; (f) Slope normalized deflec- tions [ND/S0] of the curves in (d); (g) Mutual difference of slope normalized curves [DSNC] in (f) within the range of smallest spot height. been shown in Figure 7(g) within the range of displace- ment of the height of the smallest circle. It shows that s are never coincident at any other point except the point of correction. But based on the above idea the traces of rectangular spots of different sizes can be made perfectly coincident up to the smallest height. 6.3. Shape Dependence How the bending profile of a cantilev shape of a beam spot has b sections VI and V. Based o termination developed in section V, the equivalent shapes of the spots in the experiment corresponding to Figure 1 Copyright © 2012 SciRes. JST 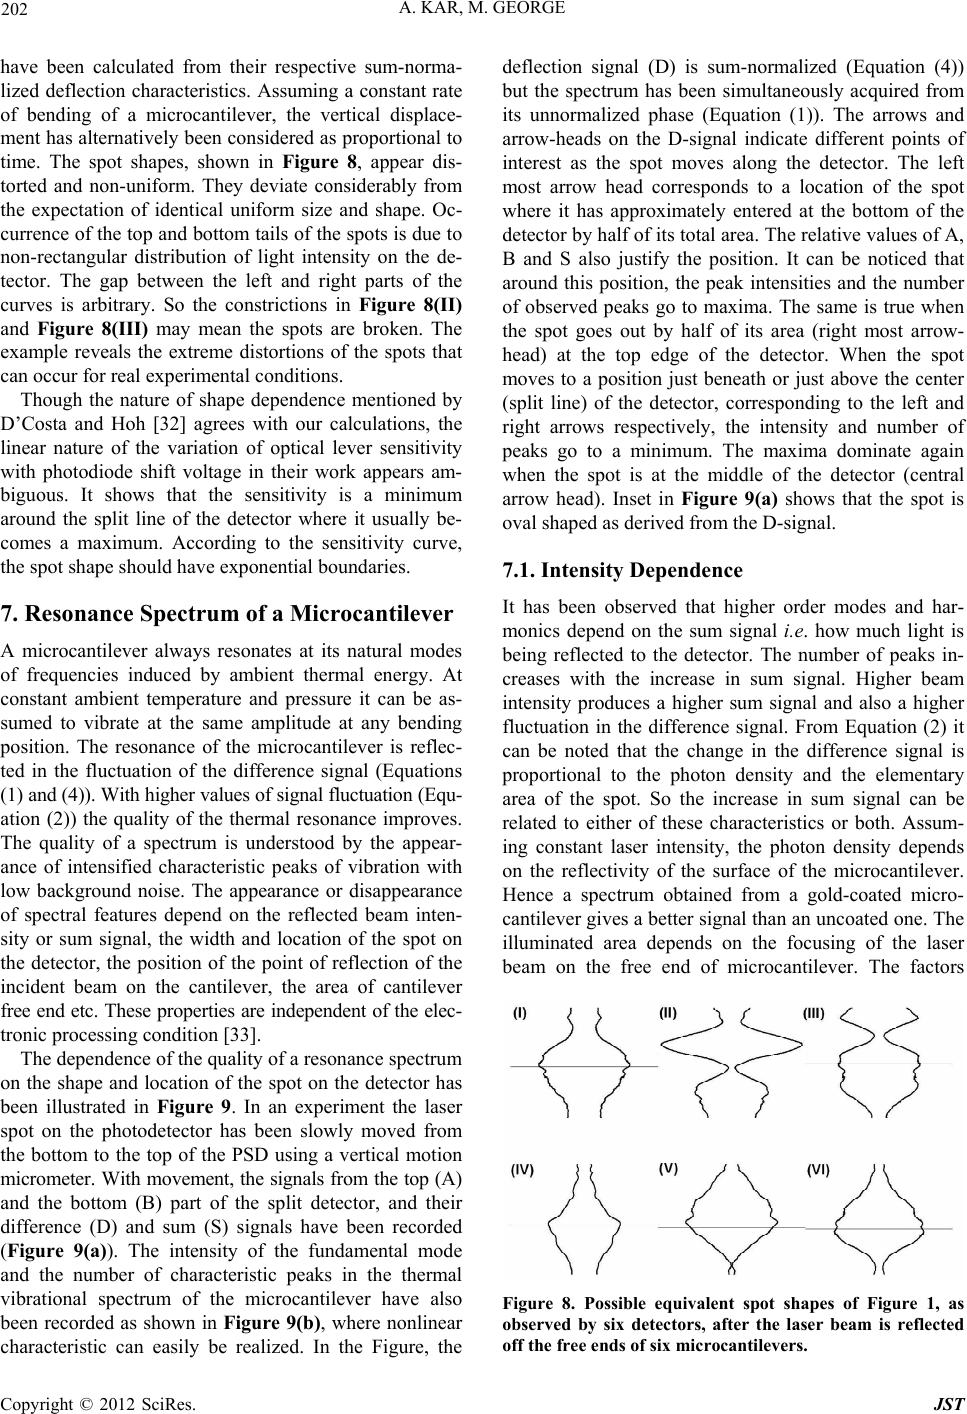 A. KAR, M. GEORGE 202 have been calculated from their respective sum-norma- lized deflection characteristics. Assuming a constant rate of bending of a microcantilever, the vertical displace- ment has alternatively been considered as proportional to time. The spot shapes, shown in Figure 8, appear dis- torted and non-uniform. They deviate considerably from the expectation of identical uniform size and shape. Oc- currence of the top and bottom tails of the spots is due to non-rectangular distribution of light intensity on the de- tector. The gap between the left and right parts of the curves is arbitrary. So the constrictions in Figure 8(II) and Figure 8(III) may mean the spots are broken. The example reveals the extreme distortions of the spots that can occur for real experimental conditions. Though the nature of shape dependence mentioned by D’Costa and Hoh [32] agrees with our calculations, the linear nature of the variation of optical lever sensitivity w odes n experiment the laser sp odes and har- nal i.e. how much light is e number of peaks in- ith photodiode shift voltage in their work appears am- biguous. It shows that the sensitivity is a minimum around the split line of the detector where it usually be- comes a maximum. According to the sensitivity curve, the spot shape should have exponential boundaries. 7. Resonance Spectrum of a Microcantilever A microcantilever always resonates at its natural m of frequencies induced by ambient thermal energy. At constant ambient temperature and pressure it can be as- sumed to vibrate at the same amplitude at any bending position. The resonance of the microcantilever is reflec- ted in the fluctuation of the difference signal (Equations (1) and (4)). With higher values of signal fluctuation (Equ- ation (2)) the quality of the thermal resonance improves. The quality of a spectrum is understood by the appear- ance of intensified characteristic peaks of vibration with low background noise. The appearance or disappearance of spectral features depend on the reflected beam inten- sity or sum signal, the width and location of the spot on the detector, the position of the point of reflection of the incident beam on the cantilever, the area of cantilever free end etc. These properties are independent of the elec- tronic processing condition [33]. The dependence of the quality of a resonance spectrum on the shape and location of the spot on the detector has been illustrated in Figure 9. In a ot on the photodetector has been slowly moved from the bottom to the top of the PSD using a vertical motion micrometer. With movement, the signals from the top (A) and the bottom (B) part of the split detector, and their difference (D) and sum (S) signals have been recorded (Figure 9(a)). The intensity of the fundamental mode and the number of characteristic peaks in the thermal vibrational spectrum of the microcantilever have also been recorded as shown in Figure 9(b), where nonlinear characteristic can easily be realized. In the Figure, the deflection signal (D) is sum-normalized (Equation (4)) but the spectrum has been simultaneously acquired from its unnormalized phase (Equation (1)). The arrows and arrow-heads on the D-signal indicate different points of interest as the spot moves along the detector. The left most arrow head corresponds to a location of the spot where it has approximately entered at the bottom of the detector by half of its total area. The relative values of A, B and S also justify the position. It can be noticed that around this position, the peak intensities and the number of observed peaks go to maxima. The same is true when the spot goes out by half of its area (right most arrow- head) at the top edge of the detector. When the spot moves to a position just beneath or just above the center (split line) of the detector, corresponding to the left and right arrows respectively, the intensity and number of peaks go to a minimum. The maxima dominate again when the spot is at the middle of the detector (central arrow head). Inset in Figure 9(a) shows that the spot is oval shaped as derived from the D-signal. 7.1. Intensity Dependence It has been observed that higher order m monics depend on the sum sig being reflected to the detector. Th creases with the increase in sum signal. Higher beam intensity produces a higher sum signal and also a higher fluctuation in the difference signal. From Equation (2) it can be noted that the change in the difference signal is proportional to the photon density and the elementary area of the spot. So the increase in sum signal can be related to either of these characteristics or both. Assum- ing constant laser intensity, the photon density depends on the reflectivity of the surface of the microcantilever. Hence a spectrum obtained from a gold-coated micro- cantilever gives a better signal than an uncoated one. The illuminated area depends on the focusing of the laser beam on the free end of microcantilever. The factors Figure 8. Possible equivalent spot shapes of Figure 1, as observed by six detectors, after the laser beam is reflected off the free ends of six microcantilevers. Copyright © 2012 SciRes. JST 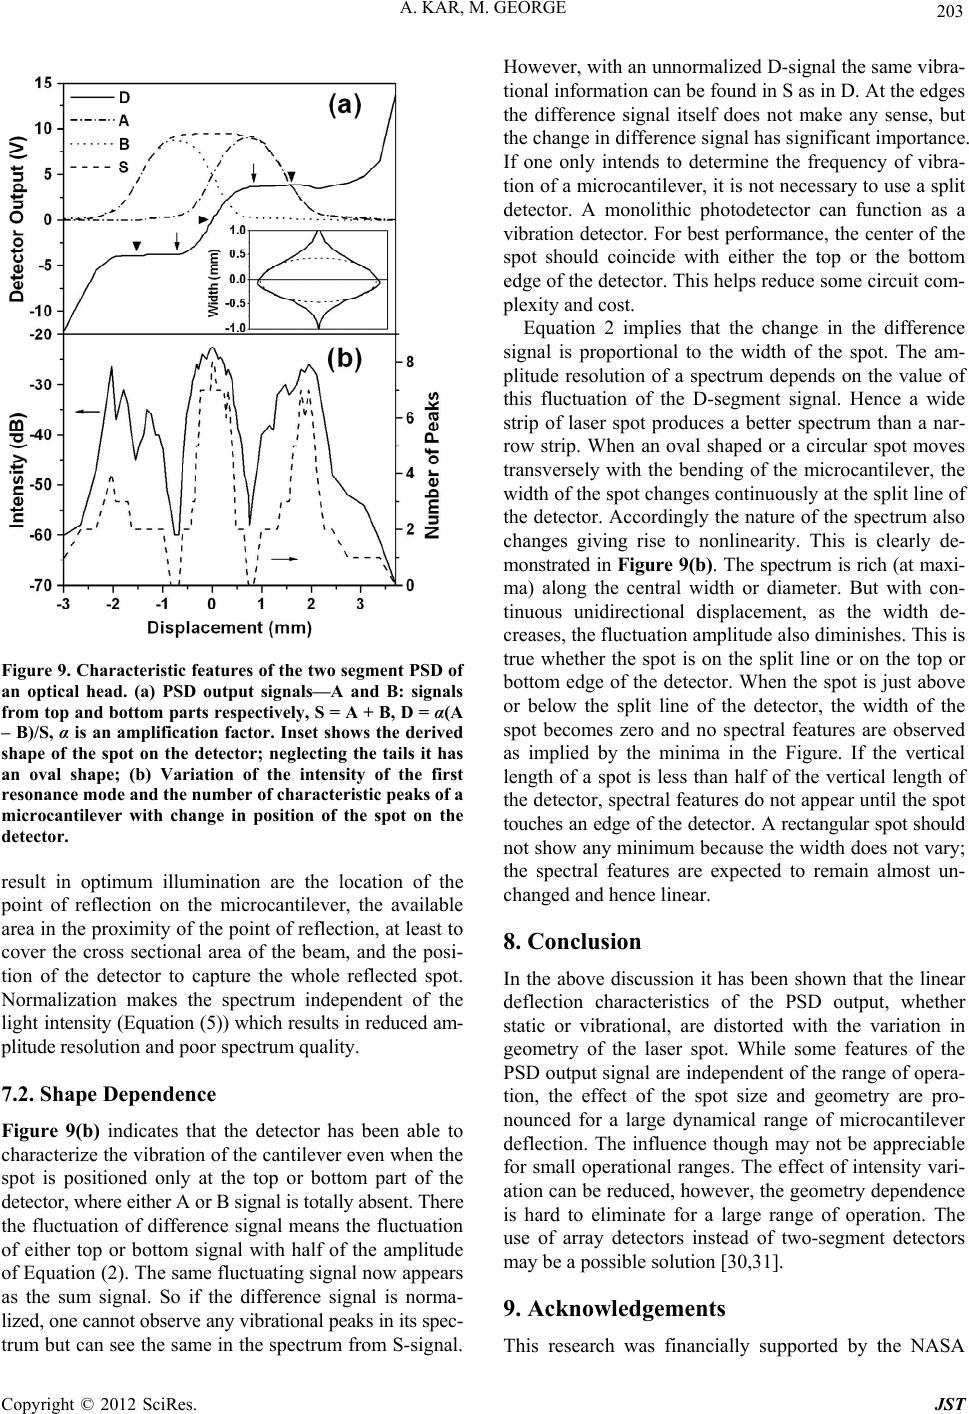 A. KAR, M. GEORGE 203 Figure 9. Characteristic features of the two segment PSD of an optical head. (a) PSD output signals—A and B: signals from top and bottom parts respectively, S = A + B, D = α( n on the microcantilever, the available Figure 9(b) indicates that the detector has been able to the cantilever even when the of a spectrum depends on the value of th s been shown that the linear eristics of the PSD output, whether al, are distorted with the variation in rted by the NASA A – B)/S, α is an amplification factor. Inset shows the derived shape of the spot on the detector; neglecting the tails it has an oval shape; (b) Variation of the intensity of the first resonance mode and the number of characteristic peaks of a microcantilever with change in position of the spot on the detector. result in optimum illumination are the location of the point of reflectio area in the proximity of the point of reflection, at least to cover the cross sectional area of the beam, and the posi- tion of the detector to capture the whole reflected spot. Normalization makes the spectrum independent of the light intensity (Equation (5)) which results in reduced am- plitude resolution and poor spectrum quality. 7.2. Shape Dependence characterize the vibration of spot is positioned only at the top or bottom part of the detector, where either A or B signal is totally absent. There the fluctuation of difference signal means the fluctuation of either top or bottom signal with half of the amplitude of Equation (2). The same fluctuating signal now appears as the sum signal. So if the difference signal is norma- lized, one cannot observe any vibrational peaks in its spec- trum but can see the same in the spectrum from S-signal. However, with an unnormalized D-signal the same vibra- tional information can be found in S as in D. At the edges the difference signal itself does not make any sense, but the change in difference signal has significant importance. If one only intends to determine the frequency of vibra- tion of a microcantilever, it is not necessary to use a split detector. A monolithic photodetector can function as a vibration detector. For best performance, the center of the spot should coincide with either the top or the bottom edge of the detector. This helps reduce some circuit com- plexity and cost. Equation 2 implies that the change in the difference signal is proportional to the width of the spot. The am- plitude resolution is fluctuation of the D-segment signal. Hence a wide strip of laser spot produces a better spectrum than a nar- row strip. When an oval shaped or a circular spot moves transversely with the bending of the microcantilever, the width of the spot changes continuously at the split line of the detector. Accordingly the nature of the spectrum also changes giving rise to nonlinearity. This is clearly de- monstrated in Figure 9(b). The spectrum is rich (at maxi- ma) along the central width or diameter. But with con- tinuous unidirectional displacement, as the width de- creases, the fluctuation amplitude also diminishes. This is true whether the spot is on the split line or on the top or bottom edge of the detector. When the spot is just above or below the split line of the detector, the width of the spot becomes zero and no spectral features are observed as implied by the minima in the Figure. If the vertical length of a spot is less than half of the vertical length of the detector, spectral features do not appear until the spot touches an edge of the detector. A rectangular spot should not show any minimum because the width does not vary; the spectral features are expected to remain almost un- changed and hence linear. 8. Conclusion In the above discussion it ha deflection charact static or vibration geometry of the laser spot. While some features of the PSD output signal are independent of the range of opera- tion, the effect of the spot size and geometry are pro- nounced for a large dynamical range of microcantilever deflection. The influence though may not be appreciable for small operational ranges. The effect of intensity vari- ation can be reduced, however, the geometry dependence is hard to eliminate for a large range of operation. The use of array detectors instead of two-segment detectors may be a possible solution [30,31]. 9. Acknowledgements This research was financially suppo Copyright © 2012 SciRes. JST  A. KAR, M. GEORGE 204 EPSCOR project contract number NCC5-580. We thank [1] B. Culshaw, “Photodetectors and Photodetection,” sors and Actua986, pp. 263-285. doi:10.1016/02 Ashwini Kadam for coating the microcantilevers with gold. We also sincerely acknowledge the helpful discus- sion with Greg Nordin and Thomas Thundat during con- struction of a microcantilever array sensor system. REFERENCES Sen- tors, Vol. 10, No. 3-4, 1 50-6874(86)80050-6 [2] A. Toneva and D. Sueva, “A Comparison of Schottky Bar- rier Position-Sensitive Detectors as a Function of Light Wavelength,” Se nsors an d Actuators, Vol. 73, No. 4, 1999, pp. 210-214. doi:10.1016/S0924-4247(98)00244-1 [3] H. P. Lang, R. Berger, F. Battiston, J.-P. Ramseyer, E. Meyer, C. Andreoli, J. Brugger, P. Vettiger, M. Despont, T. Mezzacasa, L. Scandella, H.-J. Güntherodt, Ch. Ger- ze ber and J. K. Gimzewski, “A Chemical Sensor Based on a Micromechanical Cantilever Array for the Identification of Gases and Vapors,” Applied Physics A-Materials Sci- ence & Processing, Vol. 66, No. 7, 1998, pp. S61-S64. [4] B. C. Fagan, C. A. Tipple, Z. Xue, M. J. Sepaniak and P. G. Datskos, “Modification of Micro-Cantilever Sensors with Sol-Gels to Enhance Performance and Immobili Chemically Selective Phases,” Talanta, Vol. 53, No. 3, 2000, pp. 599-608. doi:10.1016/S0039-9140(00)00533-6 [5] Y. J. Wright, A. K. Kar, Y. W. Kim, C. Scholz and M. A. George, “Determination of Glass Transition of Polymers using Microcantilever Sensors,” Sensors and Actuators, B, 2011, in preparation. [6] J. Malo and J. I. Izpura “Feedback-Induced Phase Noise in Microcantilever-Based Oscillators,” Sensors and Actu- ators A: Physical, Vol. 155, No. 1, 2009, pp. 188-194. doi:10.1016/j.sna.2009.08.001 [7] Z. Hu, T. Thundat and R. J. Warmack, “Investigation of Adsorption and Absorption-Induced Stresses Using M crocantilever Sensors,” Journai- l of Applied Physics , Vol. 90, No. 1, 2001, pp. 427-432. doi:10.1063/1.1378333 [8] M. K. Baller, H. P. Lang, H. Rothuizen, P. Vettiger, E. Meyer, H.-J. Güntherodt, Ch. Gerber and J. K. Gimzewski, “Translating Biomolecular Recognition into Nanome- chanics,” Science, Vol. 288, No. 5464, 2000, pp. 316-318. doi:10.1126/science.288.5464.316 [9] G. Wu, R. H. Datar, K. M. Hansen, T. Thundat, R. J. Cote and A. Majum, “Bioassay of Prostate-Specific Antigen (PSA) Using Microcantilevers,” Nature Biotechnology, Vol. 19, No. 9, 2001, pp. 856-860. doi:10.1038/nbt0901-856 [10] N. Hilal and D. Johnson “The Use of Atomic Force Mi- croscopy in Membrane Characterization, Membrane Science and En” Comprehensive gineering, Vol. 1, No. 16, 2010, tary Illiumination Noise,” Sensors and Ac- d pp. 337-354. [11] S. Iqbal, M. M. S. Gualini and A. Asundi, “Measurement Accuracy of Lateral-Effect Position-Sensitive Devices in Presence of S tuators A: Physical, Vol. 143, No. 2, 2008, pp. 286-292. [12] G. H. Wu, H. F. Ji, K. Hansen, T. Thundat, R. Datar, R. Cote, M. F. Hagan, A. K. Chakraborty and A. Majumdar, “Origin of Nanomechanical Cantilever Motion Generate from Biomolecular Interactions,” Proceedings of the Na- tional Acad emy of Sciences, Vol. 98, No. 4, 2001, pp. 1560- 1564. doi:10.1073/pnas.98.4.1560 [13] K. M. Hansen, H.-F. Ji, G. Wu, R. Datar, R. Cote, A. Ma- jumdar and T. Thundat, “Cantilever-Based Optical De- flection Assay for Discrimination of DNA Single-Nu- cleotide Mismatches,” Analytical Chemistry, Vol. 73, No. 7, 2001, pp. 1567-1571. doi:10.1021/ac0012748 [14] A. M. Moulin, S. J. O'Shea, and M. E. Welland, “Micro- cantilever-Based Biosensors,” Ultramicroscopy, Vol. 82, 2000, pp. 23-31. doi:10.1016/S0304-3991(99)00145-X o. [15] J. K. Gimzewski, Ch. Gerber, E. Meyer and R. R. Schlit- tler, “Observation of a Chemical Reaction Using a Micro- cantilever Sensor,” Chemical Phy sics Letters, Vol. 217, N 5-6, 1994, pp. 589-594. doi:10.1016/0009-2614(93)E1419-H [16] P. I. Oden, G. Y. Chen, R. A. Steele, R. J. Warmack and T. Thundat, “Viscous Dra crofabricated Cantilevers,” Applied P g Measurements Utilizing Mi- hysics Letters, Vol. 68, No. 26, 1996, pp. 3814-3817. doi:10.1063/1.116626 [17] J. R. Barnes, R. J. Stephenson, M. E. Welland, Ch. Ger- ber and J. K. Gimzewski, “Photothermal Spectroscopy with Femtojoule Sensitivity Using a Microcantilever Device,” Nature, Vol. 372, 1994, pp. 79-81. doi:10.1038/372079a0 [18] Z. Hu, T. Seeley, S. Kossek and T. Thundat, “Calibration of Optical Cantilever Deflection R Scientific Instrumentatioeaders,” Review of n, Vol. 75, No. 2, 2004, pp. 400- 404. doi:10.1063/1.1637457 [19] G. Meyer and N. M. Amer, “Novel Optical Approach to Atomic Force Microscopy,” Applied Physics Letters, Vol. 53, 1988, pp. 1045-1048. doi:10.1063/1.100061 Optical [20] S. Alexander, L. Hellemans, O. Marti, J. Schneir, V. El- ings and P. K. Hansma, “An Atomic—Resolution Ato- mic—Force Microscope Implemented Using an Lever,” Journal of Applied Physics, Vol. 65, No. 1, 1989, pp. 164-169. doi:10.1063/1.342563 [21] H. P. Lang, M. Hegner, E. Meyer and Ch. Gerber, “Na- nomechanics from Atomic Resolution to Molecular Re- cognition Based on Atomic Force Microscopy Techno- logy,” Nanotech nology, Vol. 13, No. 5, 2002, pp. R29-R36. doi:10.1088/0957-4484/13/5/202 [22] Protiveris Incorporated, Rockville, MD 20850, USA. [23] J. Mertens, M. Alvarez and J. Tamayo, “Real-Time Pro- file of Microcantilevers for Sensing Applications,” Applied Physics Letters, Vol. 87, No. 23, 2005, p. 234102. http://apl.aip.org/resource/1/applab/v87/i23/p234102_s1 doi:10.1063/1.2136410 [24] Y. Arntz, J. D. Seelig, H. P. Lang, J. Zhang, P. Hun J. P. Ramseyer, E. Meyer, M. Hegner and Ch. Gerber “Label-Free Protein Ass ziker, , ay Based on a Nanomechanical Cantilever Array,” Nanotechnology, Vol. 14, No. 1, 2003, p. 86. doi:10.1088/0957-4484/14/1/319 [25] R. McKendry, J. Zhang, Y. Arntz, T. Strunz, M. Hegner, H. P. Lang, M. K. Baller, U. Certa, E. Meyer, H.-J. Gün- therodt and Ch. Gerber, “Multiple Label-Free Biodetec- Copyright © 2012 SciRes. JST  A. KAR, M. GEORGE Copyright © 2012 SciRes. JST 205 tion and Quantitative DNA-Binding Assays on a Nano- mechanical Cantilever Array,” Proceedings of the Na- tional Academy of Science, Vol. 99, 2003, pp. 9783-9788. [26] J. Fritz, M. K. Baller, H. P. Lang, T. Strunz, E. Meyer, H.-J. Guntherodt, E. Delamarche, Ch. Gerber and J. K. Gimzewski, “Stress at the Solid-Liquid Interface of Self- Assembled Monolayers on Gold Investigated with a Na- nomechanical Sensor,” Langmuir, Vol. 16, No. 25, 2000, pp. 9694-9696. doi:10.1021/la000975x [27] F. M. Battiston, J.-P. Ramseyer, H. P. Lang, M. K. Baller, Ch. Gerber, J. K. Gimzewski, E. Meyer and H.-J. Gün- therodt, “A Chemical Sensor Based on a Microfabricated Cantilever Array with Simultaneous Resonance-Frequen- cy and Bending Readout,” Sensors and Actuators B, Vol. 77, No. 1-2, 2001, pp. 122-131. doi:10.1016/S0925-4005(01)00683-9 [28] M. K. Baller, H. P. Lang, J. Fritz, Ch. Gerber, J. K. Gim- zewski, U. Drechsler, H. Rothuizen, M tiger, F. M. Battiston, J. P. Ramsayer, . Despont, P. Vet- P. Foranaro, E . Me- yer and H.-J. Güntherodt, “A Cantilever Based Artificial Nose,” Ultramicroscopy, Vol. 82, No. 1-4, 2000, pp. 1-9. doi:10.1016/S0304-3991(99)00123-0 [29] C. A. J. Putman, B. G. D. Grooth, N. F. V. Hulst and J. Greve, “A Detailed Analysis of the Optical Beam Deflec- tion Technique for Use in Atomic Force Microscopy,” Journal of Applied Physics, Vol. 72, No. 1, 1992, pp. 6- 13. doi:10.1063/1.352149 [30] C. A. J. Putman, B. G. D. Grooth, N. F. V. Hulst and J. Greve, “A Theoretical Comparison Between Interfero- metric and Optical Beam Deflection Technique for the Mea- surement of Cantilever Displacement in AFM,” Ultrami- croscopy, Vol. 42-44, 1992, pp. 1509-1513. doi:10.1016/0304-3991(92)90474-X [31] A. Garcia-Valenzuela and J. Villatoro, “Noise in Optical Measurements of Cantilever Deflections,” Journal of Ap- plied Physics, Vol. 84, No. 1, 1998, pp. 58-64. doi:10.1063/1.368001 [32] M. G. L. Gustafsson and J. Clarke, “Scanning Force Micro- scope Springs Optimized for Optical—Beam Deflection and with Tips Made by Controlled Fracture,” Journal of Applied Physics, Vol. 76, No. 1, 1994, pp. 172-182. doi:10.1063/1.357124 [33] T. E. Schäffer, “Force Spectroscopy with a Large Dyna- mic Range Using Small Cantilevers and an Array Detec- tor,” Journal of Applied Physics, Vol. 91, No. 7, 2002, pp. 4739-4747. doi:10.1063/1.1450258 [34] T. E. Schäffer, M. Richter and M. B. Viani, “Array De- tector for the Atomic Force Microscope,” Applied Physics Letters, Vol. 76, No. 24, 2000, pp. 3644-3646. doi:10.1063/1.126734 [35] N. P. D’Costa and J. H. Hoh, “Calibration of Optical Lever Sensitivity for Atomic Force Microscopy,” Review of Sci- entific Instruments, Vol. 66, No. 10, 1995, pp. 5096-5097. doi:10.1063/1.1146135 [36] A. K. Kar and M. A. George, “Improved Detection of Ther- mally Induced Higher Resonance Modes and Harmonics of a Microcantilever,” Journal of Applied Physics, Vol. 94, No. 7, 2003, pp. 4626-4631. doi:10.1063/1.1604953 |