

Paper Menu >>
Journal Menu >>
 Journal of Water Resource and Protection, 2012, 4, 1071-1078 http://dx.doi.org/10.4236/jwarp.2012.412123 Published Online December 2012 (http://www.SciRP.org/journal/jwarp) Studies on Twin Micro-Watersheds, Melekote and Rajagatta Dodballapur Taluk, Bangalore Rural District, Karnataka State through Morphometry, Land Formation and Water Quality S. G. Ramachandraiah1, M. Inayathulla2, P. S. Nagaraj2, G. Ranganna3, R. Druvashree4 1Faculty in Civil Engineering, Dr. Ambedkar Institute of Technology, Bangalore, India 2Faculty in Civil Engineering, University Visvesvaraya College of Engineering, Bangalore, India 3UGC-CAS in Fluid Mechanics, Bangalore University, Bangalore, India 4University of Agricultural Sciences, Bangalore, India Email: [email protected] Received September 28, 2012; revised November 1, 2012; accepted November 10, 2012 ABSTRACT The paper discusses assessment of various chemical cons tituents present in groundwater besides morphology, and land form characteristics of twin micro-watersheds (viz., Melekote and Rajaghatta) Dodballapur Taluk, (Karnataka) coming under semi-arid climatic zone. Farmers who are mainly depending on agricultural yields for their living are disap- pointed due to vagaries of monsoons and undependable rainfall. This is particularly so in arid and semi-arid regions. These regions suffer from water scarcity, soil degradation, low crop yield, high soil erosion and gradual depletion of soil fertility. All these factors culminate in planning for conservation and sto r age of water in small watersheds fo r future needs, i.e., during drought con ditions. In many areas, it is observed that the water table levels are declining resulting in problems of increased concentration of solutes and deterioration of groundwater quality. All aspects of hydrological studies are covered in relation to watershed management in order to formulate strategies for sustainable agricultural development. Morphometry, landform and topography play an important role in understanding the hydrological re- sponse of any watershed. Quantitative morphometric analysis has been carried out on the watershed along with land- form and topographical study. Keywords: Water Quality; Morphometry; Groundwater; Land Form 1. Introduction The behavior of any watershed depends on interactions between the flow of matter and energy moving within limits and resistance to topographical surface [1]. There is need to bring together science, engineering, social sci- ences and humanities to achieve the goal of equitable water management. Here, our work concentrates on field-cum-office work concerning twin micro-watersheds falling within Arkavati river basin which originates from the foothills of Nandi hills. An attempt is also made to suggest steps to carry out economic management of available water, taking into consideration parameters of hydrology, soils and water. The rapid growth in water demand is due to the increasing reliance on irrigation to offset food security and increasing use for domestic pur- poses. Irrigated agriculture takes abou t 70 percent of wa- ter withdrawals and the figure rises to 90 percent in the dry tropics. This generally has low water use efficiency. The interrelation between morphometric parameters, landform and topography governs the existence and re- sponse of watershed to the surface as well as ground wa- ter movement [2]. Groundwater is an integral part of the hydrologic cycle. Ground water often consists of seven major chemical constituents namely: Ca2+, Mg2+, Cl–, 3 , Na+, K+ and 4 2 SOHCO . The chemical parameters of groundwater play a significant role in classifying and assessing the water quality. Considering the individual and paired ionic concentration, certain indices are pro- posed to determine the alkali hazards. Residual sodium carbonate (RSC) can be used as a criterion for finding the suitability of irrigation waters. Ten tiny dams with a catchment of 1 ha each will collect much more water than a larger dam with a catchment of 10 ha [3]. Several studies conducted in India also show a clear relationship between the size of catchment and amount of runoff that can be captured [4]. The two watersheds fall within the geographical bound ary of Dodballapur taluk (792 sq km), C opyright © 2012 SciRes. JWARP 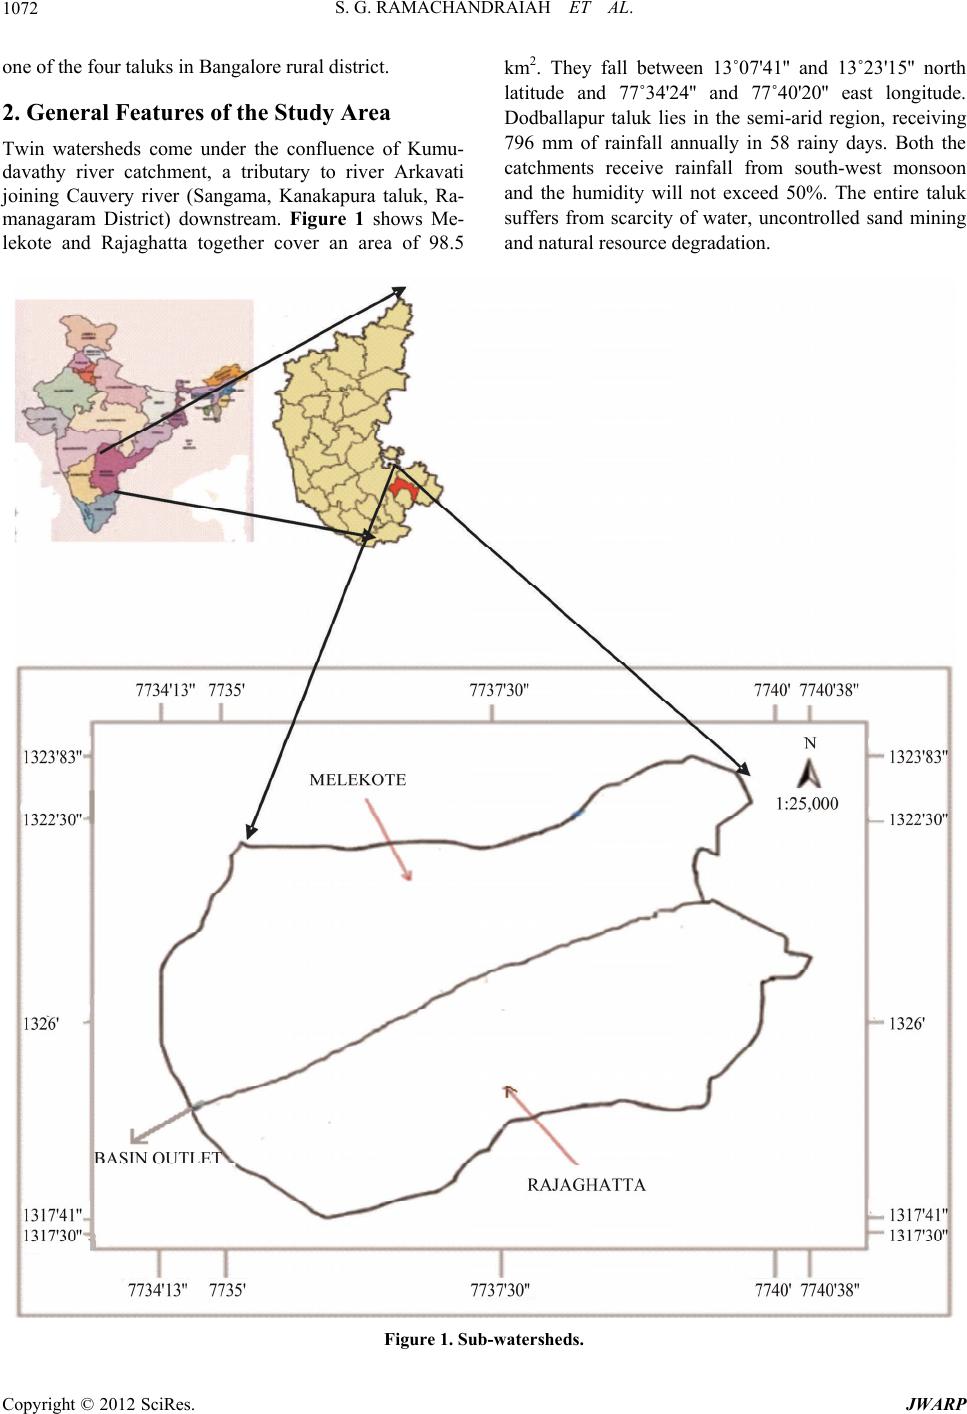 S. G. RAMACHANDRAIAH ET AL. 1072 one of the four taluks in Bangalore rural district. 2. General Features of the Study Area Twin watersheds come under the confluence of Kumu- davathy river catchment, a tributary to river Arkavati joining Cauvery river (Sangama, Kanakapura taluk, Ra- managaram District) downstream. Figure 1 shows Me- lekote and Rajaghatta together cover an area of 98.5 km2. They fall between 13˚07'41'' and 13˚23'15'' north latitude and 77˚34'24'' and 77˚40'20'' east longitude. Dodballapur taluk lies in the semi-arid region, receiving 796 mm of rainfall annually in 58 rainy days. Both the catchments receive rainfall from south-west monsoon and the humidity will not exceed 50%. The entire taluk suffers from scarcity of water, uncontrolled sand mining and natural resource degradation . Figure 1. Sub-water she ds. Copyright © 2012 SciRes. JWARP  S. G. RAMACHANDRAIAH ET AL. 1073 3. Methodology Quantitative analysis of morphometric parameters of the watershed enables 1) derivation of relationship between drainage patterns of the same watershed; 2) comparative studies of different watersheds developed in different environs and 3) identification of certain useful parame- ters of watersheds in numerical terms [5]. Within the boundary of twin watersheds the following are details of the field work carried out for water quality studies in Melekote—8 wells. Besides in Rajaghatta another 8 wells are explored for water quality, during three succes- sive seasons, viz., Pre-monsoon, monsoon and post mon- soon periods. The collected water samples were trans- ferred into precleaned polythene containers for analysis of chemical characteristics. Chemical analyses were car- ried out for the major ion concentrations of the water samples collected from different locations using standard procedures as recommended by APHA-1994. The data can be used for classification of water for different utility purposes and for ascertaining various factors on which the chemical characteristics of water depend. 4. Hydrogeology Occurrence, movement and storage of groundwater is influenced by lithology, thickness and structure of rock formations. Laterites overlying peninsular gneisses also form good aquifers. Groundwater in the district occurs in weathered crystalline rocks under unconfined conditions and in fractured rocks under semiconfined conditions. Large diameter shallow dug wells are the main ground- water structures. Due to increased demand for water most of the dug wells have dried up although some of them are revitalized by drilling bores at the bottom of the dug wells (Dug-cum-bore wells). General water table level has also fallen. Static water levels are recorded in the observation wells by the Dept. of Mines and Geology, GoK. By utilizing the data on water levels in the obser- vation wells, fluctuation of water table can be predicted, i.e., fluctuation varied from 0 - 55 m to 11.83 m below ground leve l. 5. Landform and Morphometric Analysis Morphometric parameters of the study area have been determined for the two twin watersheds in addition to general characteristics of the watersheds. The catchment area consists of dykes, lineaments and water bodies. The watersheds, form a gently sloping rolling topography with the slope from north to south amounting to 2.5%. There are 52 villages inside the catchment boundary and the population is 45,928 The entire population depends upon groundwater for domestic needs. The area consists of one of the oldest rock formations of Archaen age. Peninsular gneisses cover a large portion of Bangalore district. They are highly migmatitic in nature. Their composition is of granodioritic material. Gneisses are generally grey in color. They are jointed with sheet joints almost parallel to the ground surface. The granites are medium to coarse grained, and equigranular in texture. Dykes are oriented east west as well as north south. The study area has red loamy soils and they are fairly well drained. Slopes range from 1 to 3 percent, slightly mod- erately eroded. The major land use classification is agri- culture (95%) and forests (2%) and the alluvial deposits are noticed over a small area. Infiltration rates range from 8 to 12 mm/hour. Geomorphologically we find re- sidual hills of granites and charnockites with varying elevations, aerial extent and dissection. Pediplains are also found with gently undulating with fairly thick weathered mantle over granites and gneisses. Pediplains are also found with gently undulating with fairly thick weathered mantle over granites and gneisses. Quantita- tive analysis of morphimetric parameters is done for the watershed considered for study. The parameters so esti- mated are presented in Table 1. The adjoining water- sheds have developed 3rd order streams indicating similar level of maturity attained. The watersheds area and pe- rimeter for combined Melekote and Rajaghatta is 95.83 sq km and 43.62 km. The elevation of the Melekote is 968 m and Rajaghatta 911 m above msl. The watersheds relief ratio is less 0.017 resulting in low relief. The stream ranking is done on Strahlers [6] system. Table 2 shows that the total number of stream segments of a par- ticular order are smaller in number than for the immedi- ate lower order but larger in nu mber of segments than for the next higher order. Figure 2 suppor ts th e Str ahlers law . This relation leads to the definition of bifurcation ratio. Table 1 also shows bifurcation ratio for both the water- sheds. The average bifurcation ratio obtained for water- shed is 3.6. The bifurcation ratio is indicative of mild slope in the watersheds. Figure 3 the mean stream of a stream channel segment of certain order is a dimension property, which reveals the characteristic size of a drain- age network and its contributing basin surface. Figure 4 show that the watershed follows the Horton’s law [7] with perfect linear relation of all the orders. However elongation ratio shows the watersheds are attaining ma- ture and old stage topography. The drainage density in- dicates an expression of the closeness of spacing of channels, hence provides quantitativ e measure of averag e length of stream channel area of the whole watershed. The drainage density is estimated to be 2.41, which is a very useful index of catchment characteristics and it af- fects the magnitude of stream flow from a catchment. According to [8] the low drainage density is a character- istic of regions of highly resistant or highly permeable surface and low relief. High drainage density is found in Copyright © 2012 SciRes. JWARP  S. G. RAMACHANDRAIAH ET AL. 1074 Figure 2. Water bodies and lineaments. Copyright © 2012 SciRes. JWARP 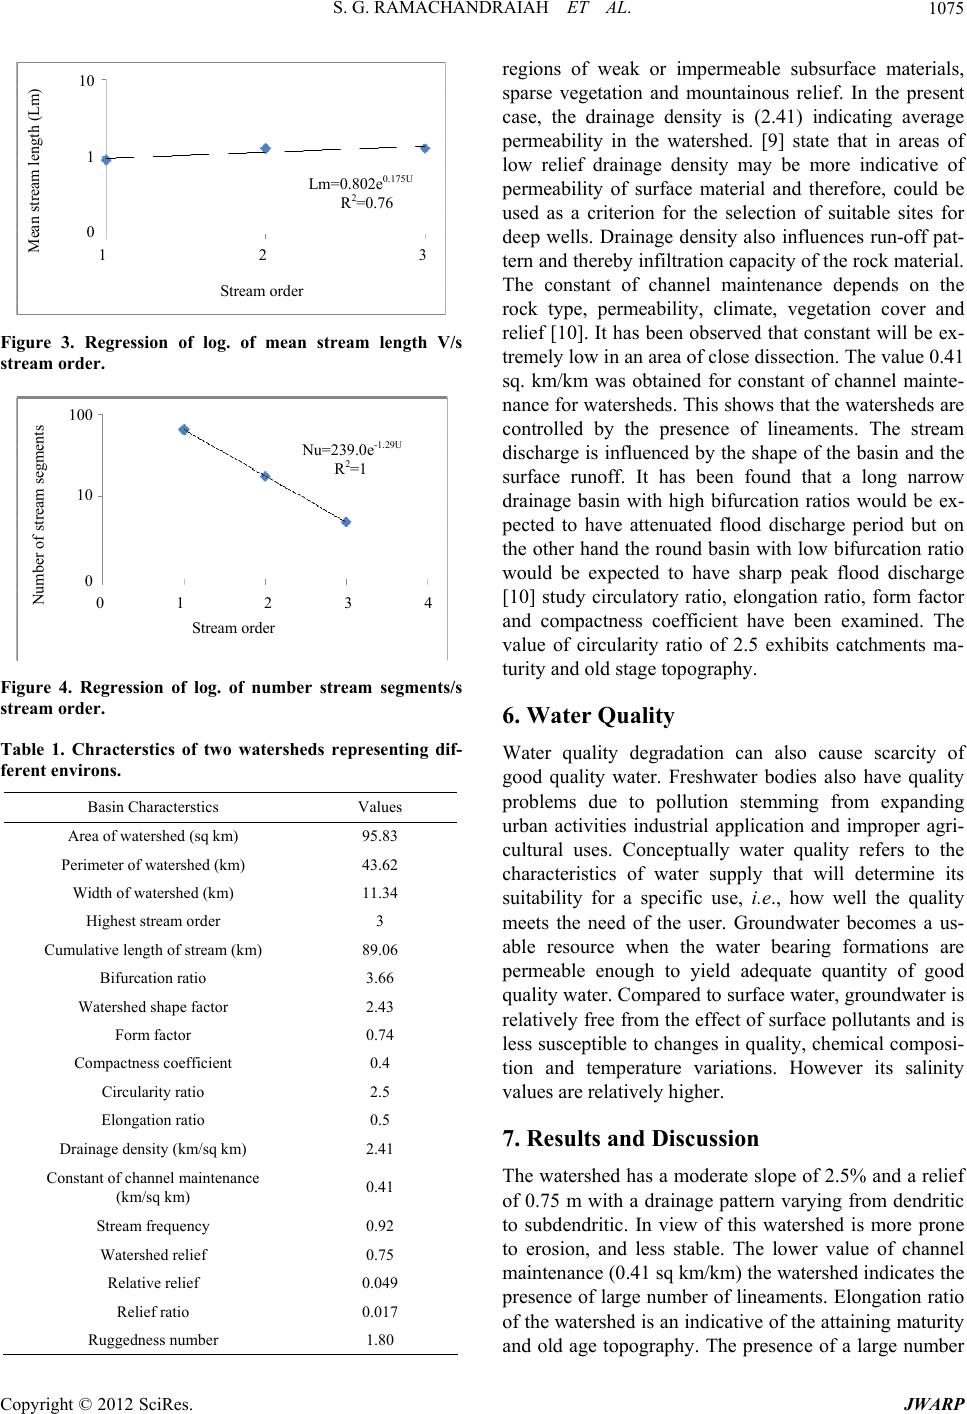 S. G. RAMACHANDRAIAH ET AL. 1075 Mean stream length (Lm) 10 1 0 Lm= 0.802e 0.175U R 2 =0.76 1 2 3 Stream order Figure 3. Regression of log. of mean stream length V/s stream order. Stream order 100 10 0 Number of stre am s eg me nts N u=23 9.0e -1.29U R 2 =1 0 1 2 3 4 Figure 4. Regression of log. of number stream segments/s stream order. Table 1. Chracterstics of two watersheds representing dif- ferent envi r o ns. Basin Characterstics Values Area of watershed (sq km) 95.83 Perimeter of waters hed (km) 43.62 Width of watershed (km) 11.34 Highest stream order 3 Cumulative length of stream (km) 89.06 Bifurcation rat io 3.66 Watershed shape factor 2.43 Form factor 0.74 Compactness coefficient 0.4 Circularity ratio 2.5 Elongation ratio 0.5 Drainage density (km/sq km) 2.41 Constant of channel maintenance (km/sq km) 0.41 Stream frequency 0.92 Watershed re l ie f 0.75 Relative relief 0.049 Relief ratio 0.017 Ruggedness number 1.80 regions of weak or impermeable subsurface materials, sparse vegetation and mountainous relief. In the present case, the drainage density is (2.41) indicating average permeability in the watershed. [9] state that in areas of low relief drainage density may be more indicative of permeability of surface material and therefore, could be used as a criterion for the selection of suitable sites for deep wells. Drainage density also influences run-off pat- tern and thereby infiltration capacity of the rock material. The constant of channel maintenance depends on the rock type, permeability, climate, vegetation cover and relief [10]. It has been observed that constant will be ex- tremely low in an area of close dissection. The value 0.41 sq. km/km was obtained for constant of channel mainte- nance for watersheds. This shows that the watersheds are controlled by the presence of lineaments. The stream discharge is influenced by the shape of the basin and the surface runoff. It has been found that a long narrow drainage basin with high bifurcation ratios would be ex- pected to have attenuated flood discharge period but on the other hand th e round basin with low bifurcation ratio would be expected to have sharp peak flood discharge [10] study circulatory ratio, elongation ratio, form factor and compactness coefficient have been examined. The value of circularity ratio of 2.5 exhibits catchments ma- turity and old stage topography. 6. Water Quality Water quality degradation can also cause scarcity of good quality water. Freshwater bodies also have quality problems due to pollution stemming from expanding urban activities industrial application and improper agri- cultural uses. Conceptually water quality refers to the characteristics of water supply that will determine its suitability for a specific use, i.e., how well the quality meets the need of the user. Groundwater becomes a us- able resource when the water bearing formations are permeable enough to yield adequate quantity of good quality water. Compared to surface water, groundwater is relatively free from the effect of surface pollutants and is less susceptible to chang es in quality, chemical composi- tion and temperature variations. However its salinity values are relatively higher. 7. Results and Discussion The watershed has a moderate slop e of 2.5% and a relief of 0.75 m with a drainage pattern varying from dendritic to subdendritic. In view of this watershed is more prone to erosion, and less stable. The lower value of channel maintenance (0.41 sq km/km) the watershed indicates the presence of large number of lineaments. Elongation ratio of the watershed is an indicative o f the attaining maturity and old age topography. The presence of a large number Copyright © 2012 SciRes. JWARP 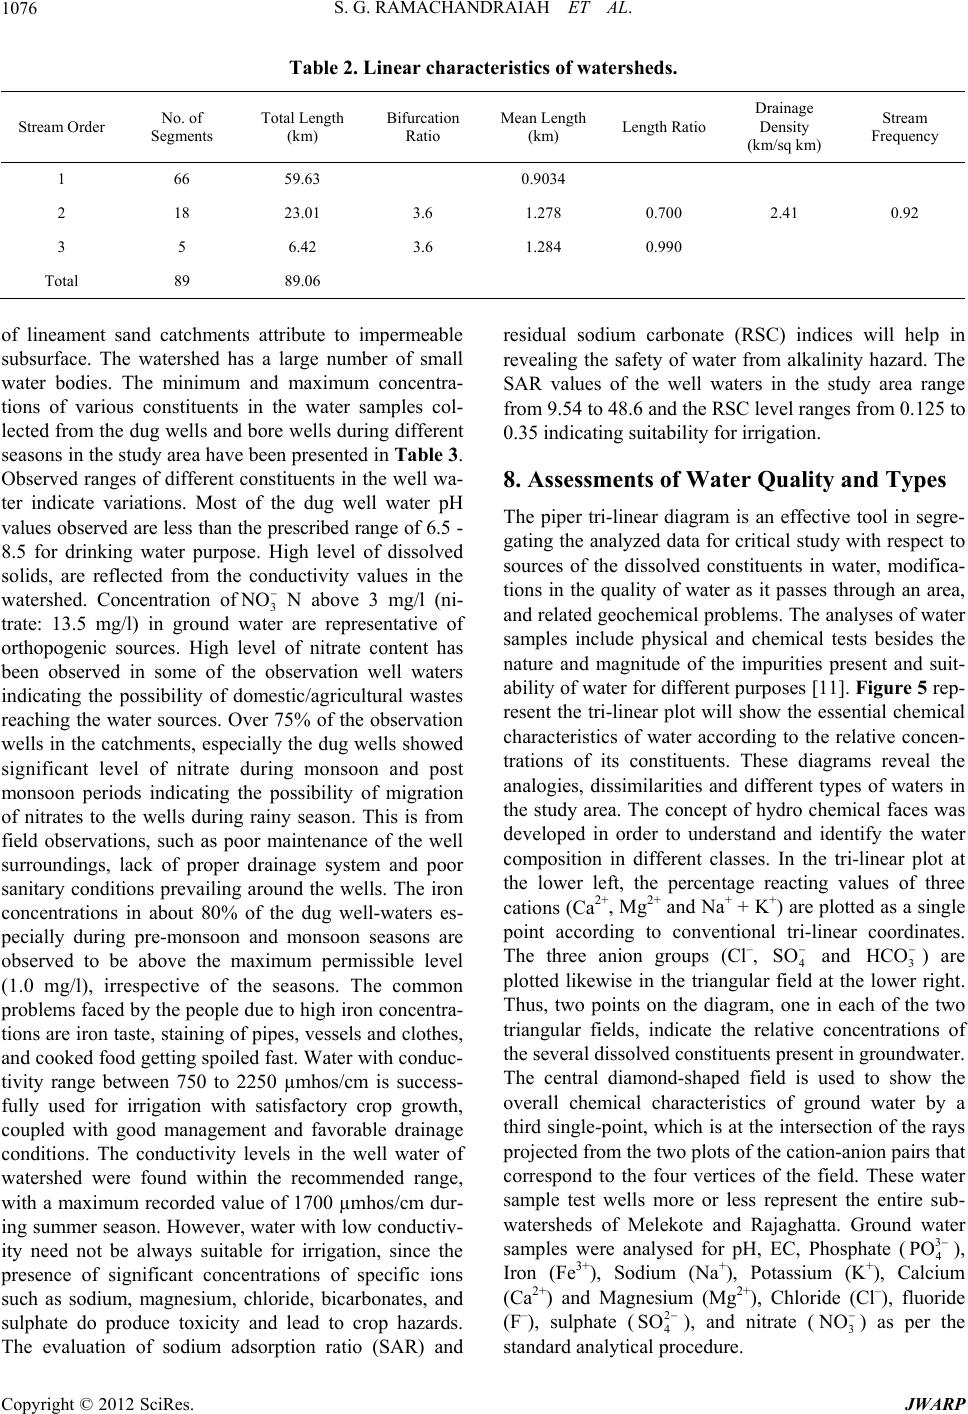 S. G. RAMACHANDRAIAH ET AL. 1076 Table 2. Linear characteristics of watersheds. Stream Order No. of Segments Total Length (km) Bifurcation Ratio Mean Length (km) Length Ratio Drainage Density (km/sq km) Stream Frequency 1 66 59.63 0.9034 2 18 23.01 3.6 1.278 0.700 3 5 6.42 3.6 1.284 0.990 2.41 0.92 Total 89 89.06 of lineament sand catchments attribute to impermeable subsurface. The watershed has a large number of small water bodies. The minimum and maximum concentra- tions of various constituents in the water samples col- lected from the dug wells and bore wells during different seasons in the study area have been presented in Table 3 . Observed ranges of different constituents in the well wa- ter indicate variations. Most of the dug well water pH values observed are less than the prescribed range of 6.5 - 8.5 for drinking water purpose. High level of dissolved solids, are reflected from the conductivity values in the watershed. Concentration of3 N above 3 mg/l (ni- trate: 13.5 mg/l) in ground water are representative of orthopogenic sources. High level of nitrate content has been observed in some of the observation well waters indicating the possibility of domestic/agricultural wastes reaching the water sources. Over 75% of the observation wells in the catchments, especially the dug wells showed significant level of nitrate during monsoon and post monsoon periods indicating the possibility of migration of nitrates to the wells during rainy season. This is from field observations, such as poor maintenance of the well surroundings, lack of proper drainage system and poor sanitary conditions prevailing around the wells. The iron concentrations in about 80% of the dug well-waters es- pecially during pre-monsoon and monsoon seasons are observed to be above the maximum permissible level (1.0 mg/l), irrespective of the seasons. The common problems faced by the people due to high iron concentra- tions are iron taste, staining of pipes, vessels and clothes, and cooked food gettin g sp oiled fast. Water with condu c- tivity range between 750 to 2250 µmhos/cm is success- fully used for irrigation with satisfactory crop growth, coupled with good management and favorable drainage conditions. The conductivity levels in the well water of watershed were found within the recommended range, with a maximum recorded value of 1700 µmhos/cm dur- ing summer season. However, water with low conductiv- ity need not be always suitable for irrigation, since the presence of significant concentrations of specific ions such as sodium, magnesium, chloride, bicarbonates, and sulphate do produce toxicity and lead to crop hazards. The evaluation of sodium adsorption ratio (SAR) and residual sodium carbonate (RSC) indices will help in revealing the safety of water from alkalinity hazard. The SAR values of the well waters in the study area range from 9.54 to 48.6 and the RSC level ranges from 0.125 to 0.35 indicating suitability for irrigation. 8. Assessments of Water Quality and Types NO SOHCO The piper tri-linear diagram is an effective tool in segre- gating the analyzed data for critical study with respect to sources of the dissolved constituents in water, modifica- tions in the quality of water as it passes through an area, and related geochemical problems. The analyses of water samples include physical and chemical tests besides the nature and magnitude of the impurities present and suit- ability of water for different purposes [11]. Figure 5 rep- resent the tri-linear plot will show the essential chemical characteristics of water according to the relative concen- trations of its constituents. These diagrams reveal the analogies, dissimilarities and different types of waters in the study area. The concept of hydro chemical faces was developed in order to understand and identify the water composition in different classes. In the tri-linear plot at the lower left, the percentage reacting values of three cations (Ca2+, Mg2+ and Na+ + K+) are plotted as a single point according to conventional tri-linear coordinates. The three anion groups (Cl–, 4 and 3 ) are plotted likewise in the triangular field at the lower right. Thus, two points on the diagram, one in each of the two triangular fields, indicate the relative concentrations of the several dissolved con s tituents present in groundwater. The central diamond-shaped field is used to show the overall chemical characteristics of ground water by a third single-point, which is at the intersection of the rays projected from the two plots of the cation-anion pairs that correspond to the four vertices of the field. These water sample test wells more or less represent the entire sub- watersheds of Melekote and Rajaghatta. Ground water samples were analysed for pH, EC, Phosphate (4 3 PO ), Iron (Fe3+), Sodium (Na+), Potassium (K+), Calcium (Ca2+) and Magnesium (Mg2+), Chloride (Cl–), fluoride (F–), sulphate (4 2 SO ), and nitrate () as per the standard analytical procedure. 3 NO Copyright © 2012 SciRes. JWARP 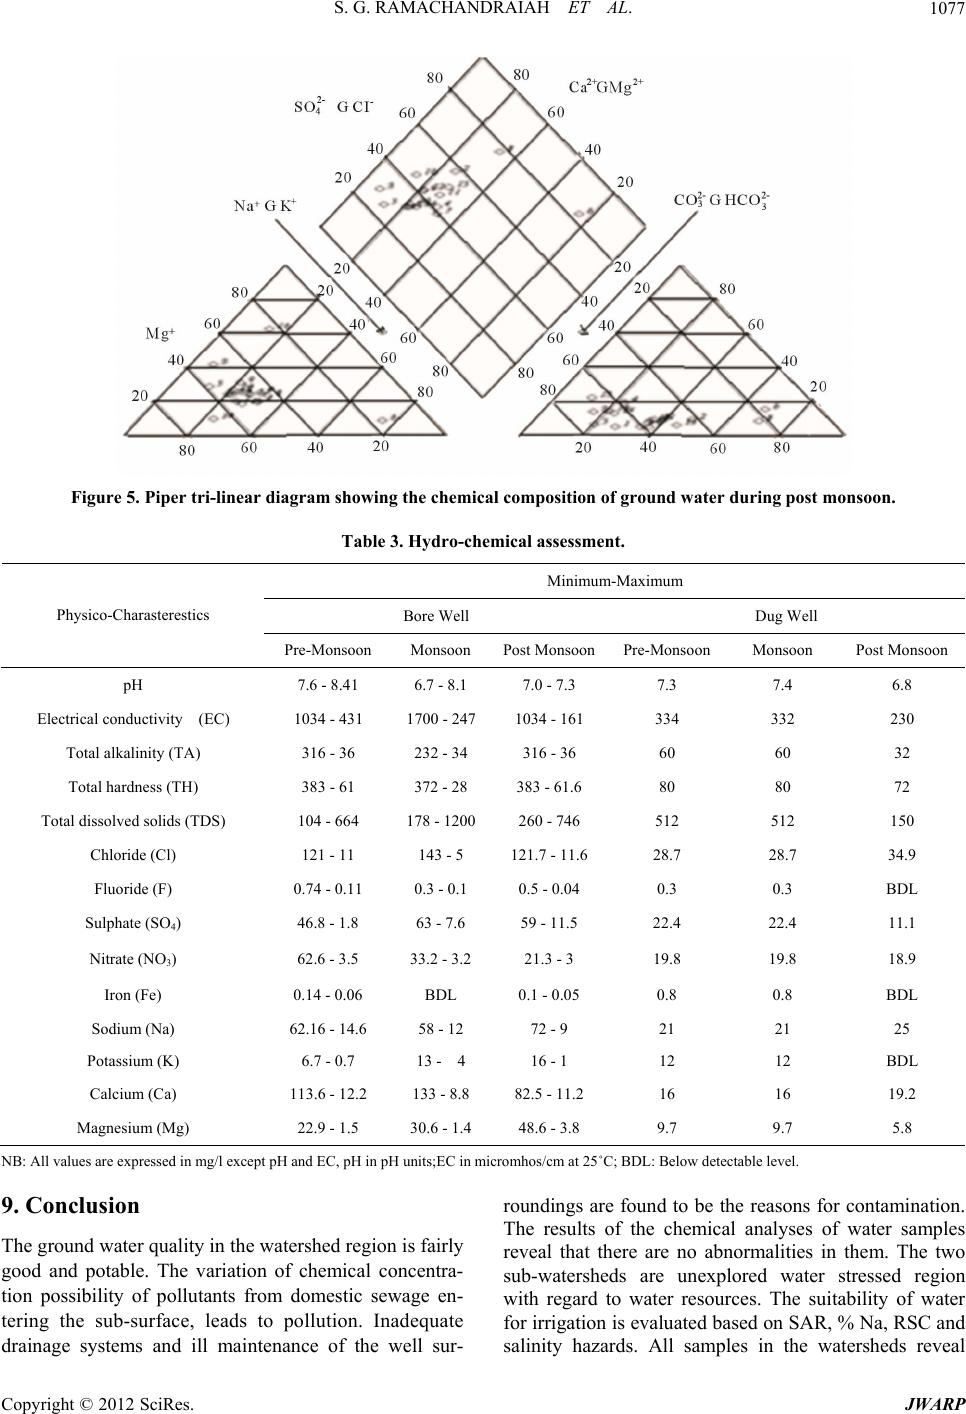 S. G. RAMACHANDRAIAH ET AL. 1077 Figure 5. Piper tri-linear diagram showing the chemical composition of ground water during post monsoon. Table 3. Hydro-chemical assessment. Minimum-Maximum Bore Well Dug Well Physico-Charasterestics Pre-Monsoon Monsoon Post MonsoonPre-MonsoonMonsoon Post Monsoon pH 7.6 - 8.41 6.7 - 8.1 7.0 - 7.3 7.3 7.4 6.8 Electrical conductivity (EC) 1034 - 431 1700 - 2471034 - 161 334 332 230 Total alkalinity (TA) 316 - 36 232 - 34 316 - 36 60 60 32 Total hardness (TH) 383 - 61 372 - 28 383 - 61. 6 80 80 72 Total dissolved solids (TDS) 104 - 664 178 - 1200260 - 746 512 512 150 Chloride (Cl) 121 - 11 143 - 5 121.7 - 11.6 28.7 28.7 34.9 Fluoride (F) 0.74 - 0.11 0 .3 - 0.1 0.5 - 0.04 0.3 0.3 BDL Sulphate (SO4) 46.8 - 1.8 63 - 7.6 59 - 11.5 22.4 22.4 11.1 Nitrate (NO3) 62.6 - 3.5 33.2 - 3.2 21.3 - 3 19.8 19.8 18.9 Iron (Fe) 0.14 - 0.06 BDL 0.1 - 0.05 0.8 0.8 BDL Sodium (Na) 62.16 - 14.6 58 - 12 72 - 9 21 21 25 Potassium (K) 6.7 - 0.7 13 - 4 16 - 1 12 12 BDL Calcium (Ca) 113.6 - 12.2 133 - 8.8 8 2.5 - 11.2 16 16 19.2 Magnesium (Mg) 22.9 - 1.5 30.6 - 1.4 48.6 - 3.8 9.7 9.7 5.8 NB: All values are expressed in mg/l ex cept pH and EC, pH in pH units;EC in micromhos/cm at 25˚C; BDL: Below detectable level. 9. Conclusion The ground water quality in the watershed region is fairly good and potable. The variation of chemical concentra- tion possibility of pollutants from domestic sewage en- tering the sub-surface, leads to pollution. Inadequate drainage systems and ill maintenance of the well sur- roundings are found to be the reasons for contamination. The results of the chemical analyses of water samples reveal that there are no abnormalities in them. The two sub-watersheds are unexplored water stressed region with regard to water resources. The suitability of water for irrigation is evaluated based on SAR, % Na, RSC and salinity hazards. All samples in the watersheds reveal Copyright © 2012 SciRes. JWARP 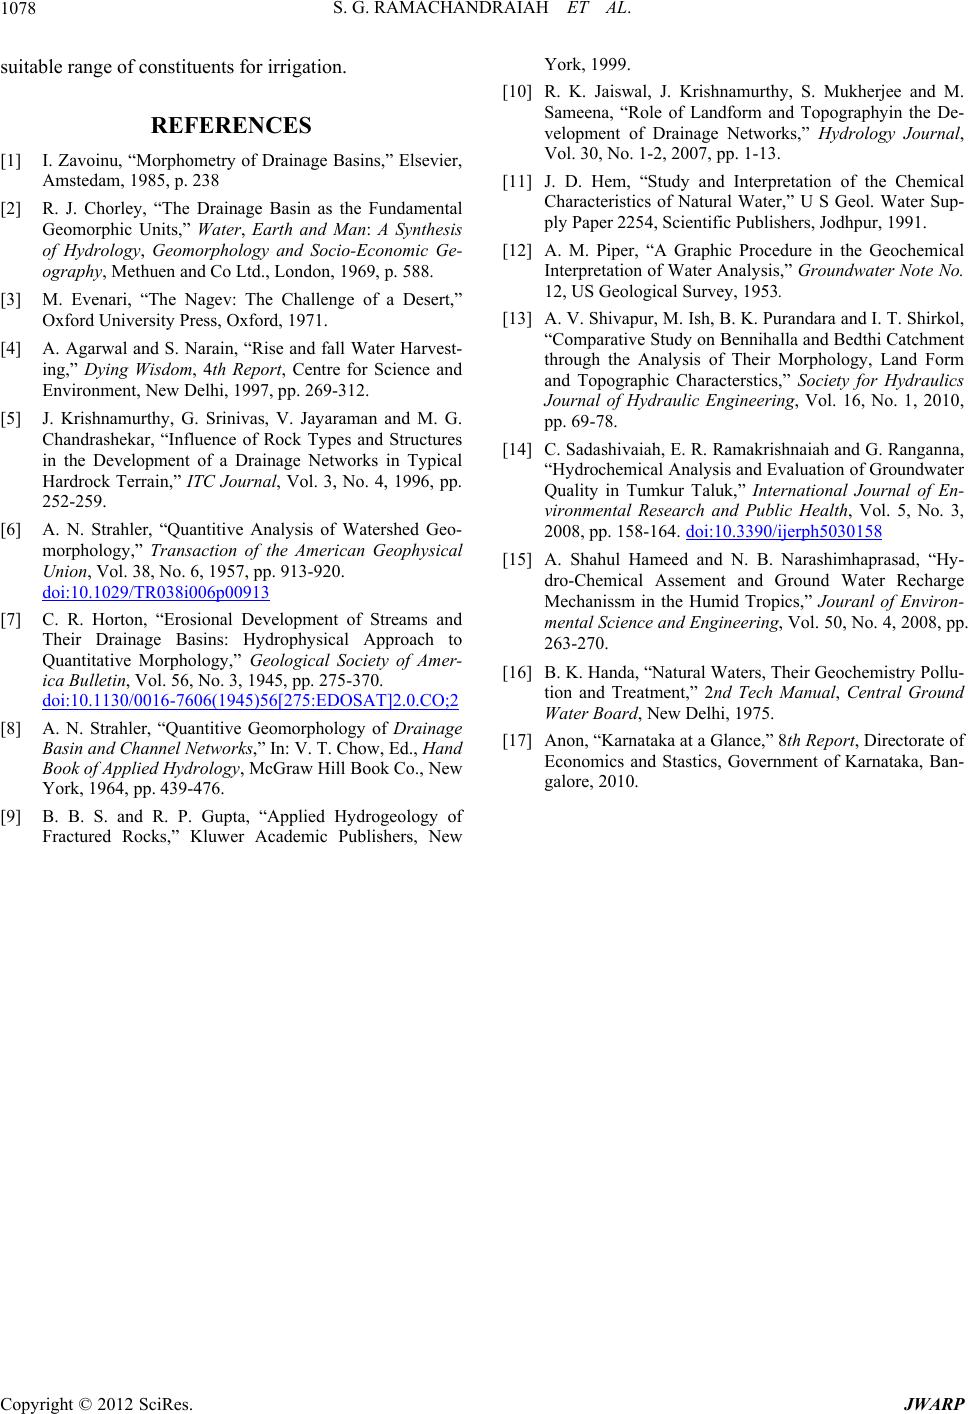 S. G. RAMACHANDRAIAH ET AL. 1078 suitable range of constituents for irrigation. REFERENCES [1] I. Zavoinu, “Morphometry of Drainage Basins,” Elsevier, Amstedam, 1985, p. 238 [2] R. J. Chorley, “The Drainage Basin as the Fundamental Geomorphic Units,” Water, Earth and Man: A Synthesis of Hydrology, Geomorphology and Socio-Economic Ge- ography, Methuen and Co Ltd., London, 1969, p. 588. [3] M. Evenari, “The Nagev: The Challenge of a Desert,” Oxford University Press, Oxford, 1971. [4] A. Agarwal and S. Narain, “Rise and fall Water Harvest- ing,” Dying Wisdom, 4th Report, Centre for Science and Environment, New Delhi, 1997, pp. 269-312. [5] J. Krishnamurthy, G. Srinivas, V. Jayaraman and M. G. Chandrashekar, “Influence of Rock Types and Structures in the Development of a Drainage Networks in Typical Hardrock Terrain,” ITC Journal, Vol. 3, No. 4, 1996, pp. 252-259. [6] A. N. Strahler, “Quantitive Analysis of Watershed Geo- morphology,” Transaction of the American Geophysical Union, Vol. 38, No. 6, 1957, pp. 913-920. doi:10.1029/TR038i006p00913 [7] C. R. Horton, “Erosional Development of Streams and Their Drainage Basins: Hydrophysical Approach to Quantitative Morphology,” Geological Society of Amer- ica Bulletin, Vol. 56, No. 3, 1945, pp. 275-370. doi:10.1130/0016-7606(1945)56[275:EDOSAT]2.0.CO;2 [8] A. N. Strahler, “Quantitive Geomorphology of Drainage Basin and Channel Networks,” In: V. T. Chow, Ed., Hand Book of Applied Hydrology, McGraw Hill Book Co., New York, 1964, pp. 439-476. [9] B. B. S. and R. P. Gupta, “Applied Hydrogeology of Fractured Rocks,” Kluwer Academic Publishers, New York, 1999. [10] R. K. Jaiswal, J. Krishnamurthy, S. Mukherjee and M. Sameena, “Role of Landform and Topographyin the De- velopment of Drainage Networks,” Hydrology Journal, Vol. 30, No. 1-2, 2007, pp. 1-13. [11] J. D. Hem, “Study and Interpretation of the Chemical Characteristics of Natural Water,” U S Geol. Water Sup- ply Paper 2254, Scientific Publishers, Jodhpur, 1991. [12] A. M. Piper, “A Graphic Procedure in the Geochemical Interpretation of Water Analysis,” Groundwater Note No. 12, US Geological Survey, 1953. [13] A. V. Shivapur, M. Ish, B. K. Purandara and I. T. Shirkol, “Comparative Study on Bennihalla and Bedthi Catchment through the Analysis of Their Morphology, Land Form and Topographic Characterstics,” Society for Hydraulics Journal of Hydraulic Engineering, Vol. 16, No. 1, 2010, pp. 69-78. [14] C. Sadashivaiah, E. R. Ramakrishnaiah and G. Ranganna, “Hydrochemical Analysis and Evaluation of Groundwater Quality in Tumkur Taluk,” International Journal of En- vironmental Research and Public Health, Vol. 5, No. 3, 2008, pp. 158-164. doi:10.3390/ijerph5030158 [15] A. Shahul Hameed and N. B. Narashimhaprasad, “Hy- dro-Chemical Assement and Ground Water Recharge Mechanissm in the Humid Tropics,” Jouranl of Environ- mental Science and Engineering, Vol. 50, No. 4, 2008, pp. 263-270. [16] B. K. Handa, “Natural Waters, Their Geochemistry Pollu- tion and Treatment,” 2nd Tech Manual, Central Ground Water Board, New Delhi, 1975. [17] Anon, “Karnataka at a Glance,” 8th Report, Directorate of Economics and Stastics, Government of Karnataka, Ban- galore, 2010. Copyright © 2012 SciRes. JWARP |