

Paper Menu >>
Journal Menu >>
 Journal of Water Resource and Protection, 2012, 4, 1051-1060 http://dx.doi.org/10.4236/jwarp.2012.412121 Published Online December 2012 (http://www.SciRP.org/journal/jwarp) Modeling the Mangla Dam Spillway for Cavitation and Aerators Optimization* Mohammad Rafi1, Akhtar Ali2#, Ghulam Qadir3, Rafaquat Ali1 1Water Resources Division, National Engineering Services of Pakistan (NESPAK), Lahore, Pakistan 2Asian Development Bank, Manila, Philippines 3WAPDA Model Study Cell, Irrigation Research Institute, Irrigation Secretariat, Lahore, Pakistan Email: #[email protected] Received September 15, 2012; revised October 16, 2012; accepted October 23, 2012 ABSTRACT This study evaluated the effects of increased reservoir conservation level by 40 ft (12.2 m), on spillway velocities; it’s discharging capacity and associated cavitation risk. The study optimized the aerators size and shape to avoid cavitations. The mathematical model was used to estimate the flow velocities and cavitation risk, when scale model study assessed the spillway discharging capacity and optimized the performance of the aerators for modified conditions. The mathe- matical model simulations showed increased flow velocities and damage index for modified conditions. The damage potential was 2 - 3 times higher with modifications and falls within the major to catastrophic region. The scale model study showed that discharging capacity of the spillway can effectively be restricted to original design by raising spill- way crest by 5.0 ft (1.52 m). The scale model study also showed that the two aerators near sluice and at the chute with an air duct pipe of 3.0 ft diameter can improve the free surface flow profile reducing the risks of cavitation. Simulations for several configurations demonstrated clearer affect of aerators ramps on flow trajectory and gate opening. It also de- picted that the height of the ramp of sluice aerator has a positive effect on the flow performance to about 7.5 inches (19 cm), when further increase in the ramp height reduced the flow performance. Keywords: Spillway; Model Studies; Discharging Capacity; Cavitation Risk; Aerators Optimization 1. Introduction High flow velocities can induce cavitations and cause serious damages to the spillways of high dams. Forma- tion of flow bubbles indicates spillway surface deforma- tion [1]. Increasing flow velocities and as a result de- creasing pressures may pass through a critical value ini- tiating cavitation, which is known as incipient cavitation. Conversely, decreasing velocity resulting in increasing pressure may arrive to a point to disappear cavitation and is called desinent cavitation. Surface roughness of spill- way floor and water impurities aggravate cavitations, accelerate damages and can result is spillway failure. Interactions between the flowing water and the at- mosphere may lead to significant air-water mixing and complex multiphase flow situation [2,3]. The cavitation can be prevented either reducing the flow velocity or increasing the flow pressure or with combination of both. The studies on the effect of variable spillway width and invert curvature on the flow pressure for Amaluza dam spillway in USA indicated that dispersion of a small amount of air through water prism can significantly re- duce for the risks of cavitation damage [4]. It was found that about 7.5% of air by volume was needed to stop cavitation damages in a 28-day concrete surface with a compressive strength of 17 mega-Pascals [5]. The re- quired air quantity to protect a spillway surface from cavitation increases with decrease in surface strength [6]. Application of aerators to prevent cavitation damage was successfully tested for Grand Coulee Dam in USA [7]. Bottom aerators are provided when natural aeration of the high velocity spillway chute does not satisfy the minimum air concentration requirements to develop posi- tive pressures. The aerators for the first time were tested at Yellowtail dam following high discharges in 1967 [8]. The minimum air concentration is function of Froude Number [9]. 0min 90 min0.015 2 C FF C (1) *Disclaimer: The ideas and finding presented in this paper are of the authors and do not necessarily reflect the views and policies of the organizations, they belong. #Corresponding author. where 90 min is minimum air concentration, F0 inflow Froude number and FCmin is Froude number at the incep- C tion point. C opyright © 2012 SciRes. JWARP  M. RAFI ET AL. 1052 Mangla dam reservoir in Pakistan has a gross storage capacity of 5.88 millions AF (7.25 km3), it supplies irri- gation water to over 4 million ha and can generate up to 1000 mega watt of electricity. The dam’s reservoir area of 100 mi2 (160 km2) creates a live storage capacity of 5.34 millions AF (6.58 km3). Since its inception in 1967, the reservoir sedimentation has reduced its storage ca- pacity by 20% or 1.15 MAF (1.42 km3). The reduced water storage implicated water shortages for irrigation and hydropower. The studies indicated that increasing the dam height by 30 ft (9.5 m) and the reservoir conser- vation level (RCL) by 40 ft from 1202 to 1242 ft is pos- sible and it can refurbish the lost capacity [10]. Never- theless, raising the dam height and RCL can increase the spillway discharge, discharge intensities and flow veloci- ties, which may cause spillway cavitations and structural damages. This study 1) checked the effect of raised dam height and the reservoir conservation level on the spill- way discharge, discharge intensities and velocities through hydraulic design computations; 2) tested the effect of different gate openings and reduced orifice areas on spillway discharge, discharge intensities and velocities on a scale model; 3) assessed the cavitation risk due to increased velocities by using a mathematical model and 4) optimized the size and shape of the bottom aerator for reduced cavitation risk by using the scale model. 2. Material and Methods 2.1. Mangla Dam Spillway The Mangla dam embankment is 380 ft (115.83 m) high above river bed and 10300 ft long (3140 m) long. It was proposed to raise the embankment height by 30 ft (9.14 m) and pool conservation level by 40 ft (12.20 m). The dam spillway is orifice type headworks, two-stage still- ing basin and sloping side walls. The headworks of the main spillway are 444 ft (135.33 m) long. It consists of three monoliths separated by 24 ft (7.3 m) wide piers. Each monolith comprised three orifices of 36 ft (10.97 m) width and 40 ft (12.2 m) height, which are equipped with radial gates. Each orifice within the monoliths is sepa- rated by 12 ft (3.66 m) wide pier. Parabolic chute follows the headworks crest. An intermediate weir divides the chute into two and creates a stilling basin and water pool at an elevation of 1000 ft (304.8 m). The spillway plan and the longitudinal sections are in Figure 1. 2.2. Spillway’s Hydraulic Design In the original design, the probable maximum flood (PMF) discharge was fixed as 1.01 million ft3·sec–1 (28,600 m3·sec–1) and the discharge intensities over the upper and lower chutes were fixed as 2275 ft3·sec–1·ft–1 (211.4 m3·sec–1·m–1) and 1443 ft3·sec–1·ft–1 (134 m3·sec–1·m–1), respectively. The hydraulic design computations showed that the raised dam height and RCL may increase the maximum discharge through the existing spillway to 1.31 million ft3·sec–1 (37,095 m3·sec–1)—27% higher than the original design discharge and corresponding increase in discharge intensities and flow velocities. The design con- sidered reducing the orifice area to restrict the spillway discharge and discharge intensities within the original design limits. The hydraulic computations showed that raising the floor level of the spillway crest by 5 ft (1.524 m) from 1086 to 1091 ft can reduce the orifice area to control the spillway discharge to original design limits. Therefore, the hydraulic design suggested raising the invert level by 5 ft to the end of gate piers with 2 ft high ramp at an angle of 10 degree from end (Figure 2). This modification1 may have only reduced the spillway dis- charge to the original design limit, but not the flow ve- locities, as the velocities are function of total head across. Hydraulic design computations for the proposed modifi- cations indicated that the flow velocities are likely to exceed from original designed velocity of 100 ft·sec–1 (30.48 m·sec–1). This increase in velocity could induce cavitation risk in the sluice bays and on the parabolic chute. 2.3. Mathematical Model and Cavitation Risks The cavitation risk due to increased flow velocities along the spillway chute were assessed by using a mathematic- cal model-USBR-EM42 [1]. The cavitation risk to a hy- draulic structure is function of flow velocities, hydrody- namic pressures and surface irregularities. Mathemati- cally, the pressure coefficient (Cp)—basis for the cavita- tion index, can be derived from the Bernoulli equation for conditions that reference elevation is equal to the elevation in question. 0 22 p PP CV 0 In ip DD tt (2) where P and P0 pressure intensity and reference pressure and Vo is reference velocity considering elevation differ- ence is negligible. The pressure coefficient or pressure parameter is also referred as Euler number. Damage in- dex was assumed as a quasi-quantitative measure of the severity of the cavitation damage as a function of dis- charge and time. It can be used to differentiate between minor and major damages. The model computes the cav- ity damage index from (3) 0 ip DD c tte (4) where, tc is cumulative time of operation, Di is damage 1The overall modifications include raising the dam height and reservoi r conservation level, raising the spillway invert level by 5 ft and intro- duction of bottom aerator. Copyright © 2012 SciRes. JWARP 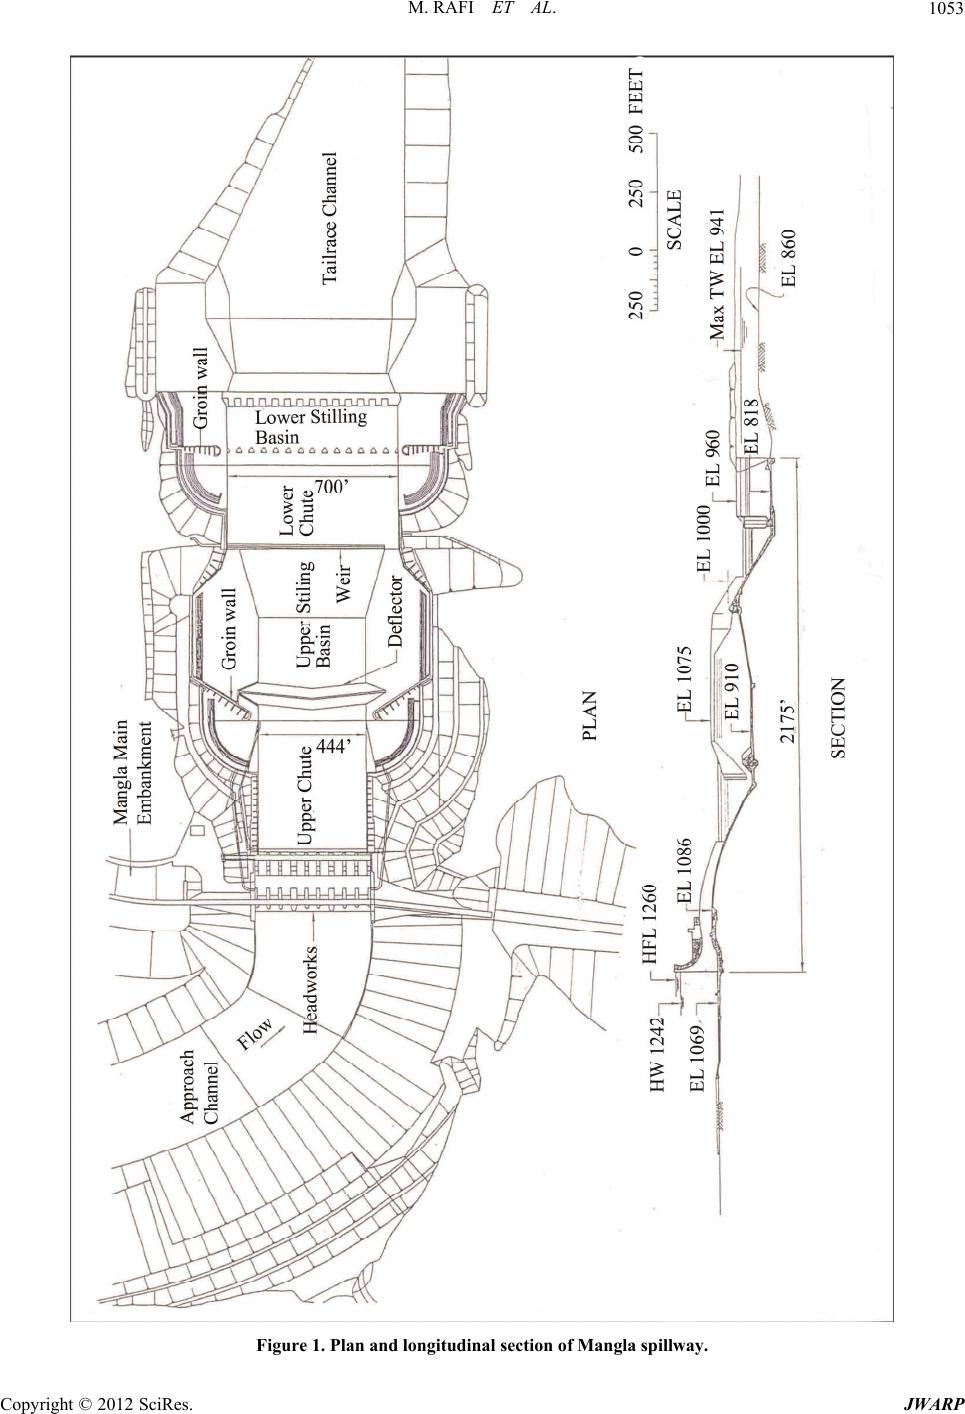 M. RAFI ET AL. Copyright © 2012 SciRes. JWARP 1053 Figure 1. Plan and longitudinal section of Mangla spillway. 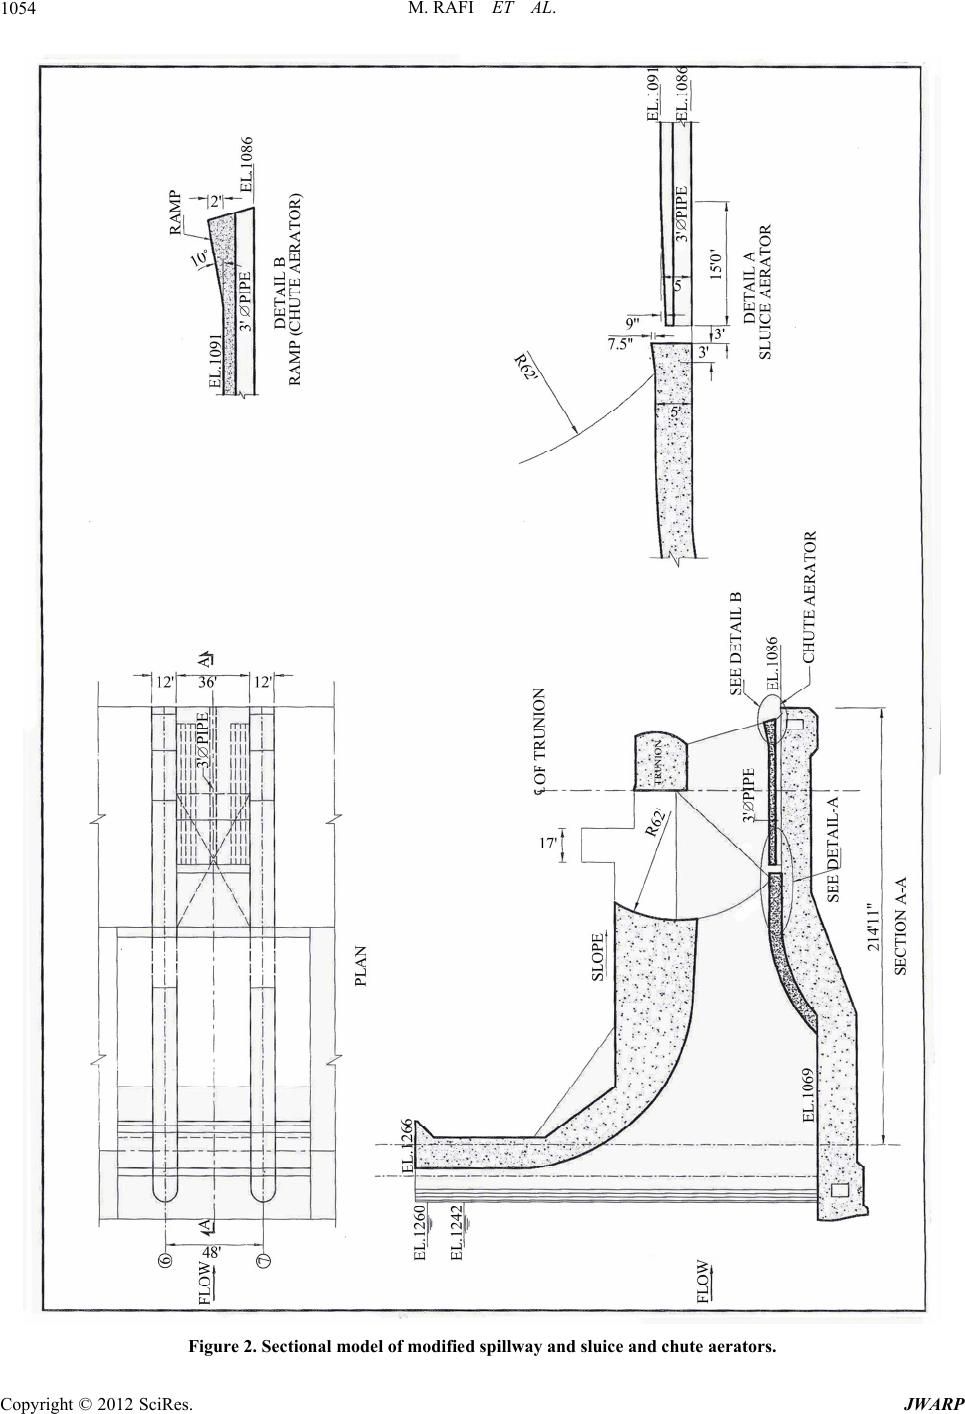 M. RAFI ET AL. 1054 Figure 2. Sectional model of modified spillway and sluice and chute ae r ators. Copyright © 2012 SciRes. JWARP 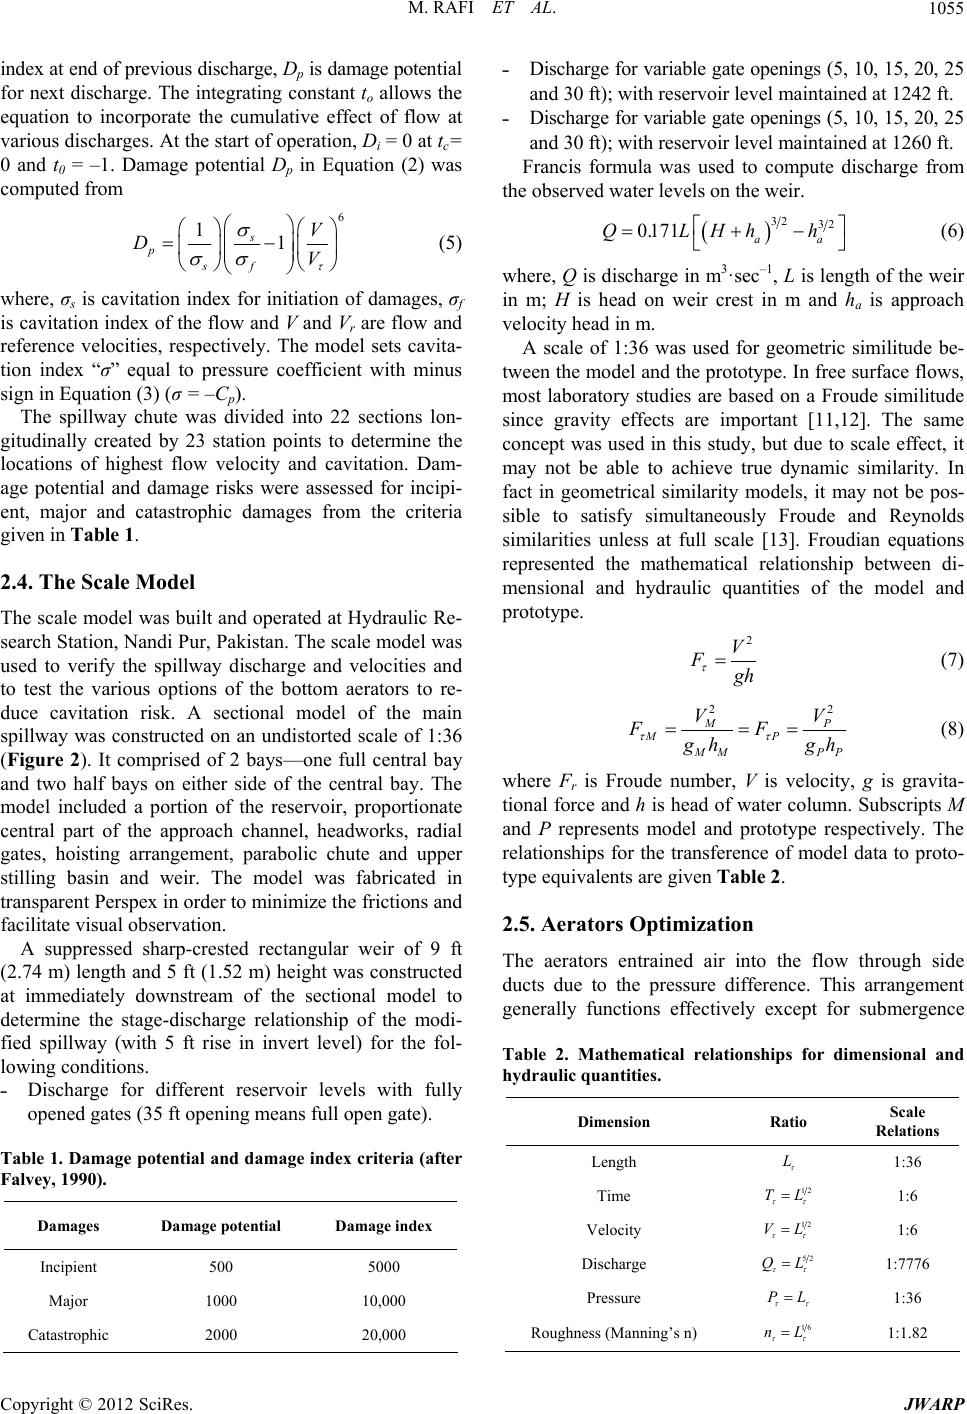 M. RAFI ET AL. Copyright © 2012 SciRes. JWARP 1055 index at end of previous discharge, Dp is damage potential for next discharge. The integrating constant to allows the equation to incorporate the cumulative effect of flow at various discharges. At the start of operation, Di = 0 at tc= 0 and t0 = –1. Damage potential Dp in Equation (2) was computed from ˗ Discharge for variable gate openings (5, 10, 15, 20, 25 and 30 ft); with reservoir level maintained at 1242 ft. ˗ Discharge for variable gate openings (5, 10, 15, 20, 25 and 30 ft); with reservoir level maintained at 1260 ft. Francis formula was used to compute discharge from the observed water levels on the weir. 6 1 s sf V V 1 p D (5) where, σs is cavitation index for initiation of damages, σf is cavitation index of the flow and V and Vr are flow and reference velocities, respectively. The model sets cavita- tion index “σ” equal to pressure coefficient with minus sign in Equation (3) (σ = –Cp). The spillway chute was divided into 22 sections lon- gitudinally created by 23 station points to determine the locations of highest flow velocity and cavitation. Dam- age potential and damage risks were assessed for incipi- ent, major and catastrophic damages from the criteria given in Table 1. 2.4. The Scale Model The scale model was built and operated at Hydraulic Re- search Station, Nandi Pur, Pakistan. The scale model was used to verify the spillway discharge and velocities and to test the various options of the bottom aerators to re- duce cavitation risk. A sectional model of the main spillway was constructed on an undistorted scale of 1:36 (Figure 2). It comprised of 2 bays—one full central bay and two half bays on either side of the central bay. The model included a portion of the reservoir, proportionate central part of the approach channel, headworks, radial gates, hoisting arrangement, parabolic chute and upper stilling basin and weir. The model was fabricated in transparent Perspex in order to minimize the frictions and facilitate visual observation. A suppressed sharp-crested rectangular weir of 9 ft (2.74 m) length and 5 ft (1.52 m) height was constructed at immediately downstream of the sectional model to determine the stage-discharge relationship of the modi- fied spillway (with 5 ft rise in invert level) for the fol- lowing conditions. ˗ Discharge for different reservoir levels with fully opened gates (35 ft opening means full open gate). Table 1. Damage potential and damage index criteria (after Falvey, 1990). Damages Damage potential Damage index Incipient 500 5000 Major 1000 10,000 Catastrophic 2000 20,000 32 32 0.171 aa QLHhh (6) where, Q is discharge in m3·sec–1, L is length of the weir in m; H is head on weir crest in m and ha is approach velocity head in m. A scale of 1:36 was used for geometric similitude be- tween the model and the prototype. In free surface flows, most laboratory studies are based on a Froude similitude since gravity effects are important [11,12]. The same concept was used in this study, but due to scale effect, it may not be able to achieve true dynamic similarity. In fact in geometrical similarity models, it may not be pos- sible to satisfy simultaneously Froude and Reynolds similarities unless at full scale [13]. Froudian equations represented the mathematical relationship between di- mensional and hydraulic quantities of the model and prototype. 2 V F (7) g h 22 MP MP M MPP VV FF g hgh (8) where Fr is Froude number, V is velocity, g is gravita- tional force and h is head of water column. Subscripts M and P represents model and prototype respectively. The relationships for the transference of model data to proto- type equivalents are given Table 2. 2.5. Aerators Optimization The aerators entrained air into the flow through side ducts due to the pressure difference. This arrangement generally functions effectively except for submergence Table 2. Mathematical relationships for dimensional and hydraulic quantities. Dimension Ratio Scale Relations Length L 1:36 Time 12 TL 1:6 Velocity 12 VL 1:6 Discharge 52 QL PL 1:7776 Pressure 1:36 Roughness (Manning’s n) 16 nL 1:1.82 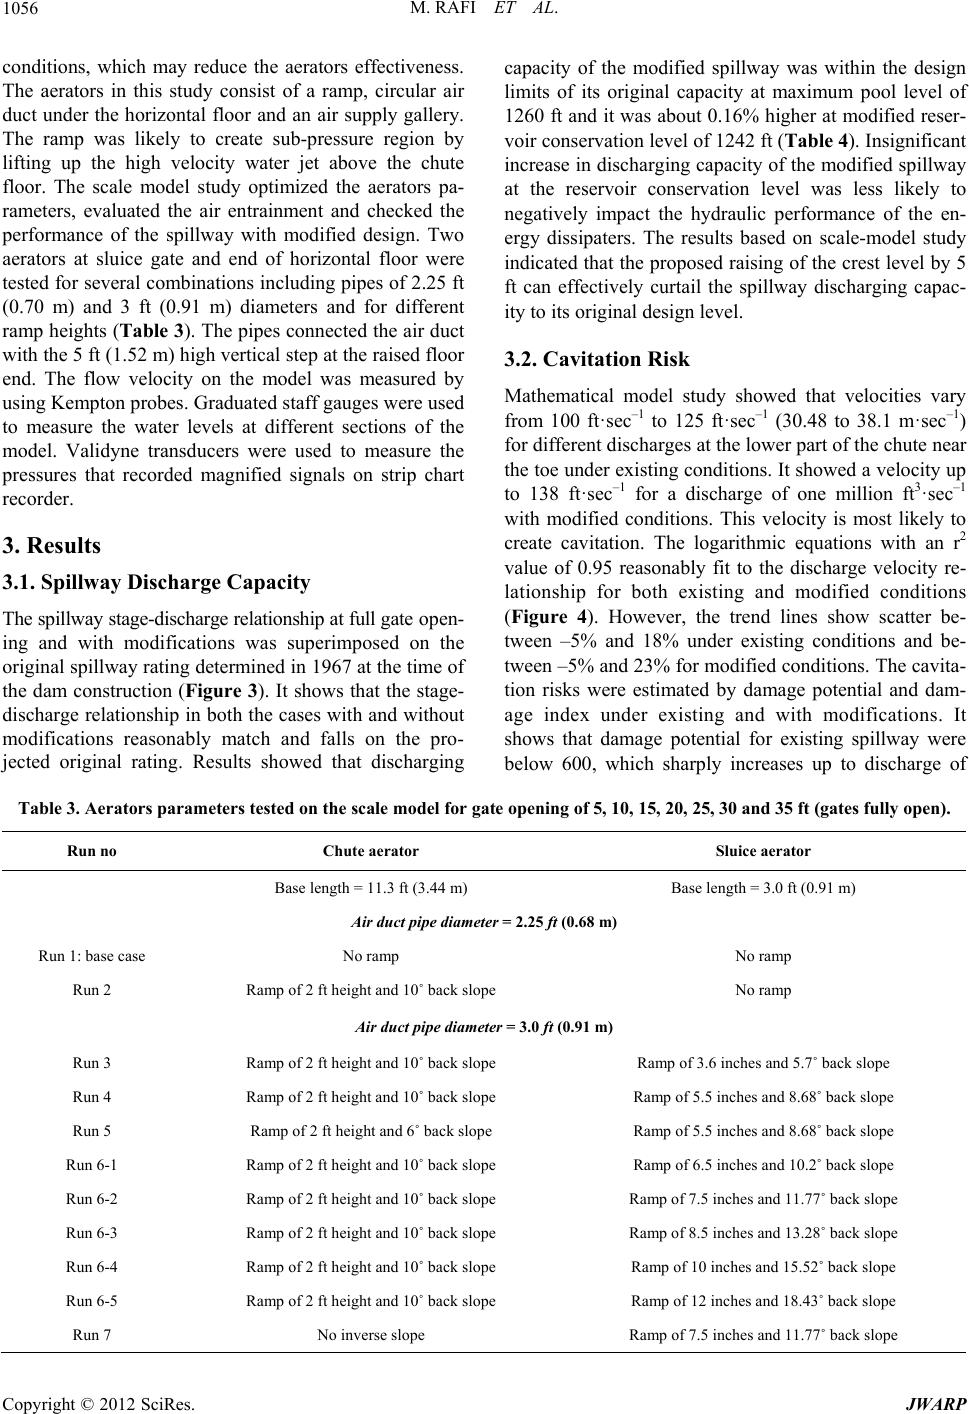 M. RAFI ET AL. 1056 conditions, which may reduce the aerators effectiveness. The aerators in this study consist of a ramp, circular air duct under the horizontal floor and an air supply gallery. The ramp was likely to create sub-pressure region by lifting up the high velocity water jet above the chute floor. The scale model study optimized the aerators pa- rameters, evaluated the air entrainment and checked the performance of the spillway with modified design. Two aerators at sluice gate and end of horizontal floor were tested for several combinations including pipes of 2.25 ft (0.70 m) and 3 ft (0.91 m) diameters and for different ramp heights (Table 3). The pipes connected the air duct with the 5 ft (1.52 m) high vertical step at the raised floor end. The flow velocity on the model was measured by using Kempton probes. Graduated staff gauges were used to measure the water levels at different sections of the model. Validyne transducers were used to measure the pressures that recorded magnified signals on strip chart recorder. 3. Results 3.1. Spillway Discharge Capacity The spillway stage-discharge relationship at full gate open- ing and with modifications was superimposed on the original spillway rating determined in 1967 at the time of the dam construction (Figure 3). It shows that the stage- discharge relationship in both the cases with and without modifications reasonably match and falls on the pro- jected original rating. Results showed that discharging capacity of the modified spillway was within the design limits of its original capacity at maximum pool level of 1260 ft and it was about 0.16% higher at modified reser- voir conservation level of 1242 ft (Tabl e 4 ). Insignificant increase in discharging capacity of the modified spillway at the reservoir conservation level was less likely to negatively impact the hydraulic performance of the en- ergy dissipaters. The results based on scale-model study indicated that the proposed raising of the crest level by 5 ft can effectively curtail the spillway discharging capac- ity to its original design level. 3.2. Cavitation Risk Mathematical model study showed that velocities vary from 100 ft·sec–1 to 125 ft·sec–1 (30.48 to 38.1 m·sec–1) for different discharges at the lower part of the chute near the toe under existing conditions. It showed a velocity up to 138 ft·sec–1 for a discharge of one million ft3·sec–1 with modified conditions. This velocity is most likely to create cavitation. The logarithmic equations with an r2 value of 0.95 reasonably fit to the discharge velocity re- lationship for both existing and modified conditions (Figure 4). However, the trend lines show scatter be- tween –5% and 18% under existing conditions and be- tween –5% and 23% for modified conditions. The cavita- tion risks were estimated by damage potential and dam- age index under existing and with modifications. It shows that damage potential for existing spillway were below 600, which sharply increases up to discharge of Table 3. Aerators parameters tested on the scale model for gate opening of 5, 10, 15, 20, 25, 30 and 35 ft (gates fully open). Run no Chute aerator Sluice aerator Base length = 11.3 ft (3.44 m) Base length = 3.0 ft (0.91 m) Air duct pipe diameter = 2.25 ft (0.68 m) Run 1: base case No ramp No ramp Run 2 Ramp of 2 ft height and 10˚ back slope No ramp Air duct pipe diameter = 3.0 ft (0.91 m) Run 3 Ramp of 2 ft height and 10˚ back slope Ramp of 3.6 inches and 5.7˚ back slope Run 4 Ramp of 2 ft height and 10˚ back slope Ramp of 5.5 inches and 8.68˚ back slope Run 5 Ramp of 2 ft height and 6˚ back slope Ramp of 5.5 inches and 8.68˚ back slope Run 6-1 Ramp of 2 ft height and 10˚ back slope Ramp of 6.5 inches and 10.2˚ back slope Run 6-2 Ramp of 2 ft height and 10˚ back slope Ramp of 7.5 inches and 11.77˚ back slope Run 6-3 Ramp of 2 ft height and 10˚ back slope Ramp of 8.5 inches and 13.28˚ back slope Run 6-4 Ramp of 2 ft height and 10˚ back slope Ramp of 10 inches and 15.52˚ back slope Run 6-5 Ramp of 2 ft height and 10˚ back slope Ramp of 12 inches and 18.43˚ back slope Run 7 No inverse slope Ramp of 7.5 inches and 11.77˚ back slope Copyright © 2012 SciRes. JWARP 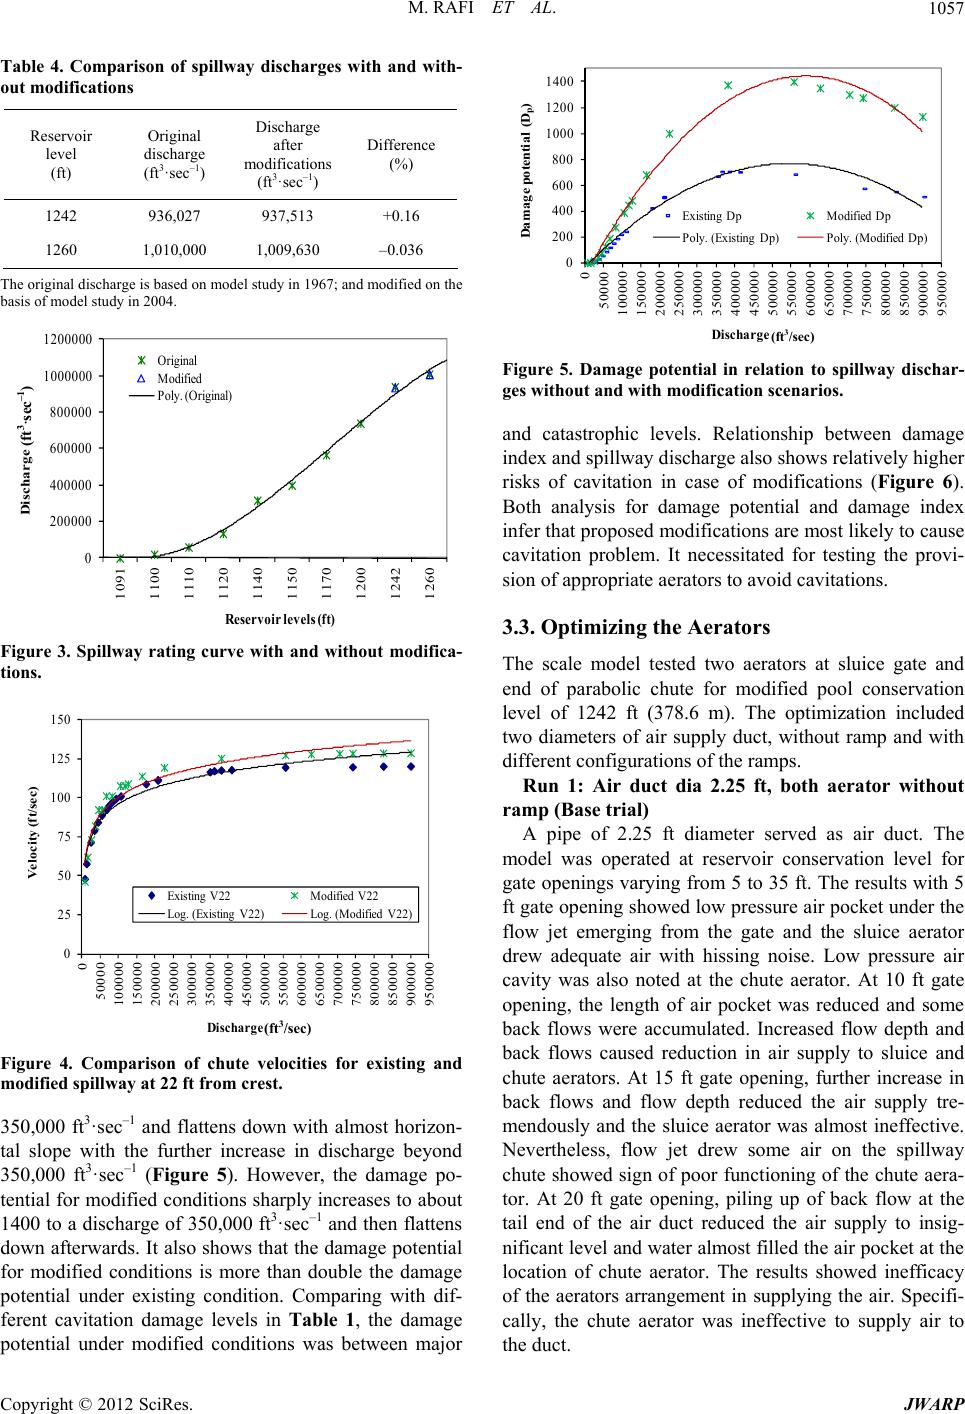 M. RAFI ET AL. 1057 Table 4. Comparison of spillway discharges with and with- out modifications 0 200 400 600 800 1000 1200 1400 0 50000 100000 150000 200000 250000 300000 350000 400000 450000 500000 550000 600000 650000 700000 750000 800000 850000 900000 950000 Damage potential (D p ) Discharge (ft3/ s ec) Reservoir level (ft) Original discharge (ft3·sec–1) Discharge after modifications (ft3·sec–1) Difference (%) 1242 936,027 937,513 +0.16 1260 1,010,000 1,009,630 –0.036 Existing DpModified Dp Poly. (Existing Dp)Poly. (Modified Dp) The original discharge is based on model study in 1967; and modified on the basis of model study in 2004. (ft3/sec) 0 200000 400000 600000 800000 1000000 1200000 1091 1100 1110 1120 1140 1150 1170 Discharge (ft 3 sec -1 ) Reservoir levels (ft) 1200 1242 1260 Original Modified Poly. (Original) (ft 3 ·sec –1 ) Figure 3. Spillway rating curve with and without modifica- tions. 0 25 50 75 100 125 150 0 50000 100000 150000 200000 250000 300000 350000 400000 450000 500000 550000 600000 650000 Velocity (ft/sec) Discharge (ft3/ sec) 700000 750000 800000 850000 900000 950000 Existing V22Modified V22 Log. (Existing V22)Log. (Modified V22) (ft 3 /sec) Figure 4. Comparison of chute velocities for existing and modified spillway at 22 ft from crest. 350,000 ft3·sec–1 and flattens down with almost horizon- tal slope with the further increase in discharge beyond 350,000 ft3·sec–1 (Figure 5). However, the damage po- tential for modified conditions sharply increases to about 1400 to a discharge of 350,000 ft3·sec–1 and then flattens down afterwards. It also shows that the damage potential for modified conditions is more than double the damage potential under existing condition. Comparing with dif- ferent cavitation damage levels in Table 1, the damage potential under modified conditions was between major Figure 5. Damage potential in relation to spillway dischar- ges without and with modification scenarios. and catastrophic levels. Relationship between damage index and spillway discharge also shows relatively higher risks of cavitation in case of modifications (Figure 6). Both analysis for damage potential and damage index infer that proposed modifications are most likely to cause cavitation problem. It necessitated for testing the provi- sion of appropriate aerators to avoid cavitations. 3.3. Optimizing the Aerators The scale model tested two aerators at sluice gate and end of parabolic chute for modified pool conservation level of 1242 ft (378.6 m). The optimization included two diameters of air supply duct, without ramp and with different configurations of the ramps. Run 1: Air duct dia 2.25 ft, both aerator without ramp (Base trial) A pipe of 2.25 ft diameter served as air duct. The model was operated at reservoir conservation level for gate openings varying from 5 to 35 ft. The results with 5 ft gate opening showed low pressure air pocket under the flow jet emerging from the gate and the sluice aerator drew adequate air with hissing noise. Low pressure air cavity was also noted at the chute aerator. At 10 ft gate opening, the length of air pocket was reduced and some back flows were accumulated. Increased flow depth and back flows caused reduction in air supply to sluice and chute aerators. At 15 ft gate opening, further increase in back flows and flow depth reduced the air supply tre- mendously and the sluice aerator was almost ineffective. Nevertheless, flow jet drew some air on the spillway chute showed sign of poor functioning of the chute aera- tor. At 20 ft gate opening, piling up of back flow at the tail end of the air duct reduced the air supply to insig- nificant level and water almost filled the air pocket at the location of chute aerator. The results showed inefficacy of the aerators arrangement in supplying the air. Specifi- cally, the chute aerator was ineffective to supply air to the duct. Copyright © 2012 SciRes. JWARP 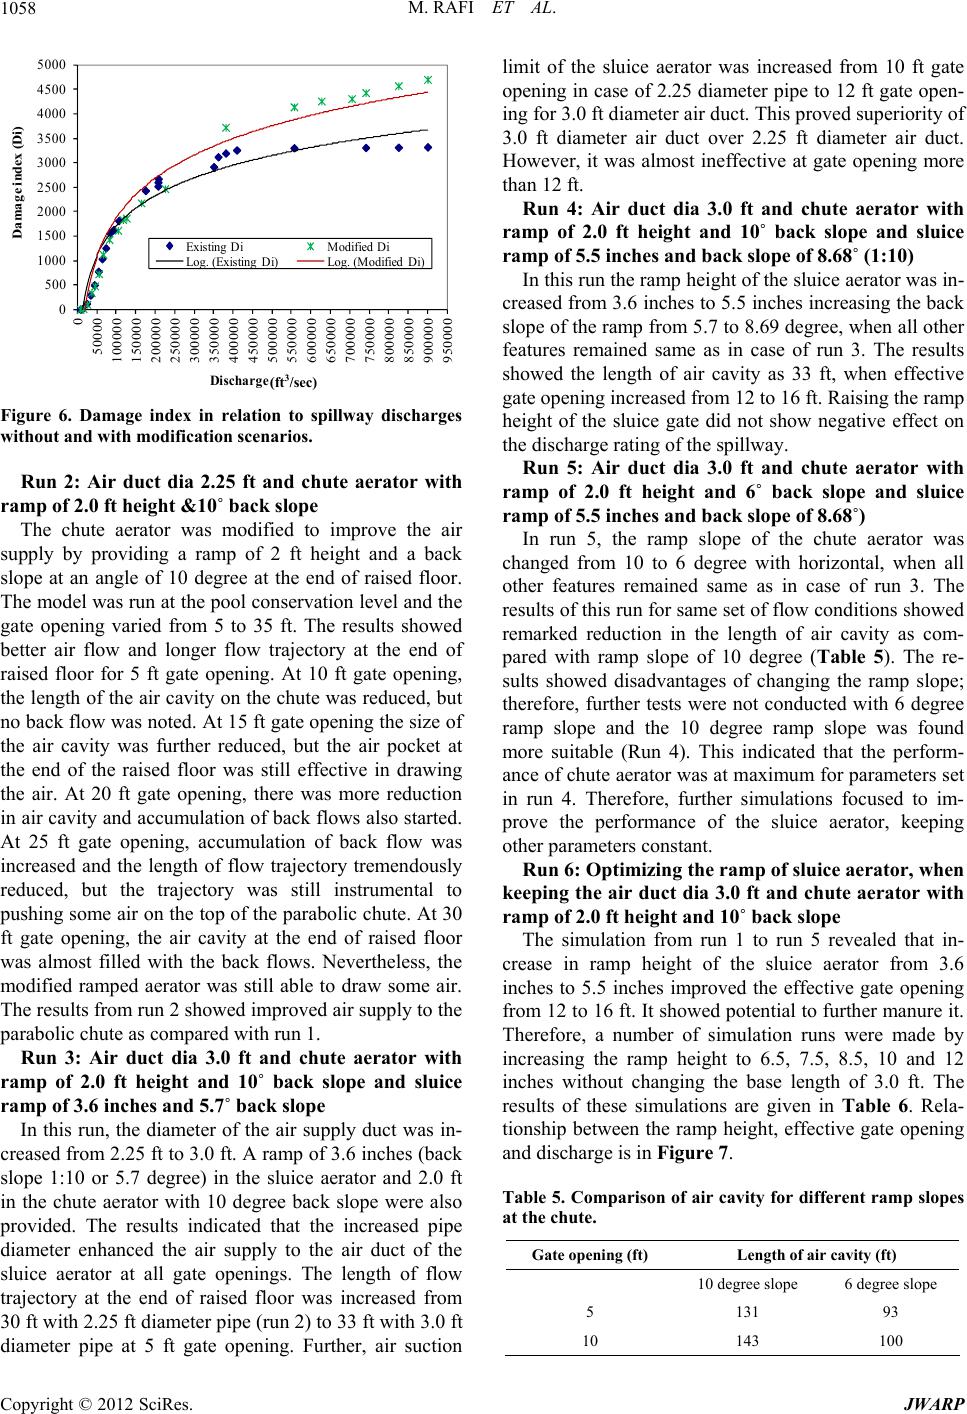 M. RAFI ET AL. 1058 0 500 1000 1500 2000 2500 3000 3500 4000 4500 5000 0 50000 100000 150000 200000 250000 300000 350000 400000 450000 500000 550000 600000 650000 700000 D amage in dex (D i) Discharge (ft3/ sec) 750000 800000 850000 900000 950000 Existing DiModified Di Log. (Existing Di)Log. (Modified Di) (ft 3 /sec) Figure 6. Damage index in relation to spillway discharges without and with modification scenarios. Run 2: Air duct dia 2.25 ft and chute aerator with ramp of 2.0 ft height &10˚ back slope The chute aerator was modified to improve the air supply by providing a ramp of 2 ft height and a back slope at an angle of 10 degree at the end of raised floor. The model was run at the pool conservation level and the gate opening varied from 5 to 35 ft. The results showed better air flow and longer flow trajectory at the end of raised floor for 5 ft gate opening. At 10 ft gate opening, the length of the air cavity on the chute was reduced, but no back flow was noted. At 15 ft gate opening the size of the air cavity was further reduced, but the air pocket at the end of the raised floor was still effective in drawing the air. At 20 ft gate opening, there was more reduction in air cavity and accumulation of back flows also started. At 25 ft gate opening, accumulation of back flow was increased and the length of flow trajectory tremendously reduced, but the trajectory was still instrumental to pushing some air on the top of the parabolic chute. At 30 ft gate opening, the air cavity at the end of raised floor was almost filled with the back flows. Nevertheless, the modified ramped aerator was still able to draw some air. The results from run 2 showed improved air supply to the parabolic chute as compared with run 1. Run 3: Air duct dia 3.0 ft and chute aerator with ramp of 2.0 ft height and 10˚ back slope and sluice ramp of 3.6 inches and 5.7˚ back slope In this run, the diameter of the air supply duct was in- creased from 2.25 ft to 3.0 ft. A ramp of 3.6 inches (back slope 1:10 or 5.7 degree) in the sluice aerator and 2.0 ft in the chute aerator with 10 degree back slope were also provided. The results indicated that the increased pipe diameter enhanced the air supply to the air duct of the sluice aerator at all gate openings. The length of flow trajectory at the end of raised floor was increased from 30 ft with 2.25 ft diameter pipe (run 2) to 33 ft with 3.0 ft diameter pipe at 5 ft gate opening. Further, air suction limit of the sluice aerator was increased from 10 ft gate opening in case of 2.25 diameter pipe to 12 ft gate open- ing for 3.0 ft diameter air duct. This proved superiority of 3.0 ft diameter air duct over 2.25 ft diameter air duct. However, it was almost ineffective at gate opening more than 12 ft. Run 4: Air duct dia 3.0 ft and chute aerator with ramp of 2.0 ft height and 10˚ back slope and sluice ramp of 5.5 inches and back slope of 8.68˚ (1 :1 0) In this run the ramp height of the sluice aerator was in- creased from 3.6 inches to 5.5 inches increasing the back slope of the ramp from 5.7 to 8.69 degree, when all other features remained same as in case of run 3. The results showed the length of air cavity as 33 ft, when effective gate opening increased from 12 to 16 ft. Raising the ramp height of the sluice gate did not show negative effect on the discharge rating of the spillway. Run 5: Air duct dia 3.0 ft and chute aerator with ramp of 2.0 ft height and 6˚ back slope and sluice ramp of 5.5 inches and back slope of 8.68˚) In run 5, the ramp slope of the chute aerator was changed from 10 to 6 degree with horizontal, when all other features remained same as in case of run 3. The results of this run for same set of flow conditions showed remarked reduction in the length of air cavity as com- pared with ramp slope of 10 degree (Table 5). The re- sults showed disadvantages of changing the ramp slope; therefore, further tests were not conducted with 6 degree ramp slope and the 10 degree ramp slope was found more suitable (Run 4). This indicated that the perform- ance of chute aerator was at maximum for parameters set in run 4. Therefore, further simulations focused to im- prove the performance of the sluice aerator, keeping other parameters constant. Run 6: O ptimizing the ramp of sluice aerato r, when keeping the air duct dia 3.0 ft and chute aerator with ramp of 2. 0 ft h eight and 1 0˚ back slope The simulation from run 1 to run 5 revealed that in- crease in ramp height of the sluice aerator from 3.6 inches to 5.5 inches improved the effective gate opening from 12 to 16 ft. It showed potential to further manure it. Therefore, a number of simulation runs were made by increasing the ramp height to 6.5, 7.5, 8.5, 10 and 12 inches without changing the base length of 3.0 ft. The results of these simulations are given in Table 6. Rela- tionship between the ramp height, effective gate opening and discharge is in Figure 7. Table 5. Comparison of air cavity for different ramp slopes at the chute. Gate opening (ft) Length of air cavity (ft) 10 degree slope 6 degree slope 5 131 93 10 143 100 Copyright © 2012 SciRes. JWARP 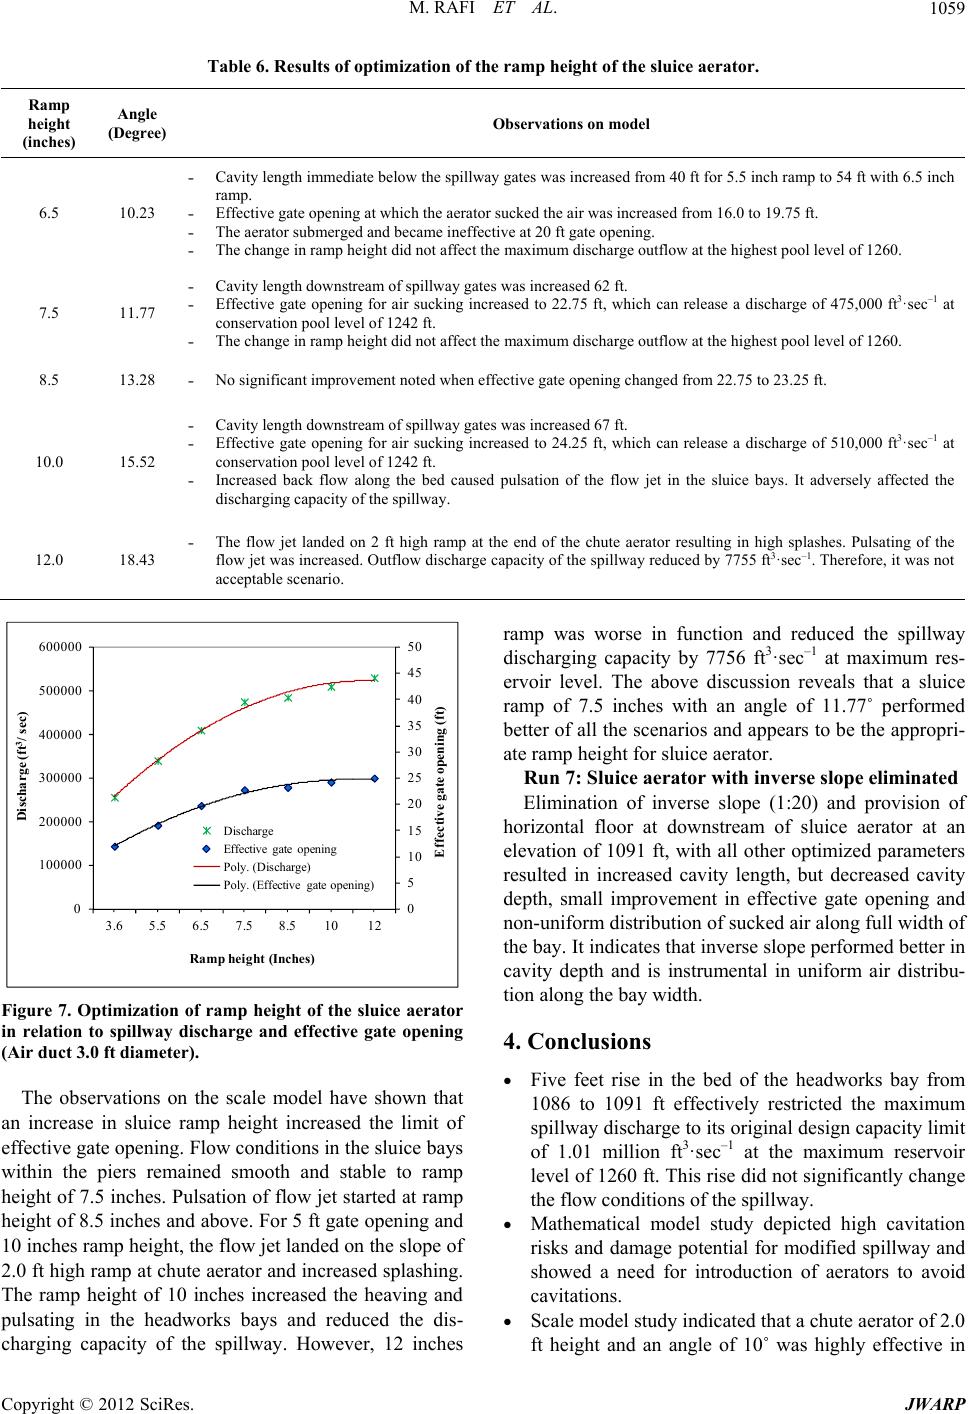 M. RAFI ET AL. Copyright © 2012 SciRes. JWARP 1059 Table 6. Results of optimization of the ramp height of the sluice aerator. Ramp height (inches) Angle (Degree) Observations on model 6.5 10.23 ˗ Cavity length immediate below the spillway gates was increased from 40 ft for 5.5 inch ramp to 54 ft with 6.5 inch ramp. ˗ Effective gate opening at which the aerator sucked the air was increased from 16.0 to 19.75 ft. ˗ The aerator submerged and became ineffective at 20 ft gate opening. ˗ The change in ramp height did not affect the maximum discharge outflow at the highest pool level of 1260. 7.5 11.77 ˗ Cavity length downstream of spillway gates was increased 62 ft. ˗ Effective gate opening for air sucking increased to 22.75 ft, which can release a discharge of 475,000 ft3·sec–1 at conservation pool level of 1242 ft. ˗ The change in ramp height did not affect the maximum discharge outflow at the highest pool level of 1260. 8.5 13.28 ˗ No significant improvement noted when effective gate opening changed from 22.75 to 23.25 ft. 10.0 15.52 ˗ Cavity length downstream of spillway gates was increased 67 ft. ˗ Effective gate opening for air sucking increased to 24.25 ft, which can release a discharge of 510,000 ft3·sec–1 at conservation pool level of 1242 ft. ˗ Increased back flow along the bed caused pulsation of the flow jet in the sluice bays. It adversely affected the discharging capacity of the spillway. 12.0 18.43 ˗ The flow jet landed on 2 ft high ramp at the end of the chute aerator resulting in high splashes. Pulsating of the flow jet was increased. Outflow discharge capacity of the spillway reduced by 7755 ft3·sec–1. Therefore, it was not acceptable scenario. ramp was worse in function and reduced the spillway discharging capacity by 7756 ft3·sec–1 at maximum res- ervoir level. The above discussion reveals that a sluice ramp of 7.5 inches with an angle of 11.77˚ performed better of all the scenarios and appears to be the appropri- ate ramp height for sluice aerator. 0 100000 200000 300000 400000 500000 600000 3.6 5.56.5 7.58.510 Discharge (ft 3 / sec) Ramp height (Inches) Discharge Effective gate opening Poly. (Discharge) Poly. (Effective gate ope 0 5 10 15 20 25 30 35 40 45 50 12 Effective gate open ing (ft) ning) Run 7: Sluice aerator with inverse slope eliminated Elimination of inverse slope (1:20) and provision of horizontal floor at downstream of sluice aerator at an elevation of 1091 ft, with all other optimized parameters resulted in increased cavity length, but decreased cavity depth, small improvement in effective gate opening and non-uniform distribution of sucked air along full width of the bay. It indicates that inverse slope performed better in cavity depth and is instrumental in uniform air distribu- tion along the bay width. Figure 7. Optimization of ramp height of the sluice aerator in relation to spillway discharge and effective gate opening (Air duct 3.0 ft diameter). 4. Conclusions Five feet rise in the bed of the headworks bay from 1086 to 1091 ft effectively restricted the maximum spillway discharge to its original design capacity limit of 1.01 million ft3·sec–1 at the maximum reservoir level of 1260 ft. This rise did not significantly change the flow conditions of the spillway. The observations on the scale model have shown that an increase in sluice ramp height increased the limit of effective gate opening. Flow conditions in the sluice bays within the piers remained smooth and stable to ramp height of 7.5 inches. Pulsation of flow jet started at ramp height of 8.5 inches and above. For 5 ft gate opening and 10 inches ramp height, the flow jet landed on the slope of 2.0 ft high ramp at chute aerator and increased splashing. The ramp height of 10 inches increased the heaving and pulsating in the headworks bays and reduced the dis- charging capacity of the spillway. However, 12 inches Mathematical model study depicted high cavitation risks and damage potential for modified spillway and showed a need for introduction of aerators to avoid cavitations. Scale model study indicated that a chute aerator of 2.0 ft height and an angle of 10˚ was highly effective in 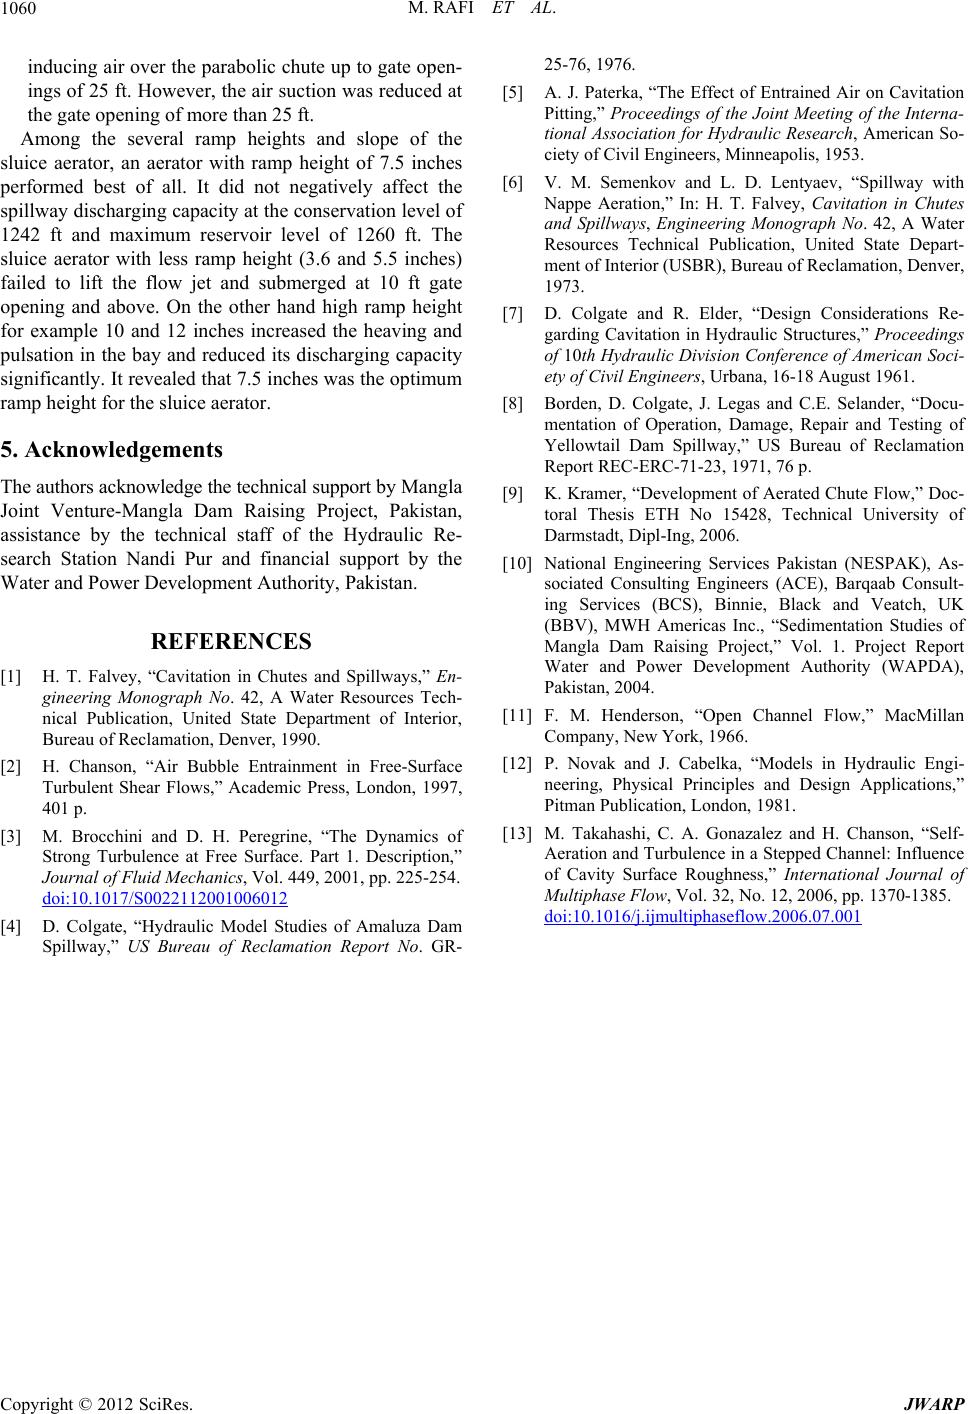 M. RAFI ET AL. 1060 inducing air over the parabolic chute up to gate open- ings of 25 ft. However, the air suction was reduced at the gate opening of more than 25 ft. Among the several ramp heights and slope of the sluice aerator, an aerator with ramp height of 7.5 inches performed best of all. It did not negatively affect the spillway discharging capacity at the conservation level of 1242 ft and maximum reservoir level of 1260 ft. The sluice aerator with less ramp height (3.6 and 5.5 inches) failed to lift the flow jet and submerged at 10 ft gate opening and above. On the other hand high ramp height for example 10 and 12 inches increased the heaving and pulsation in the bay and reduced its discharging capacity significantly. It revealed that 7.5 inches was the optimum ramp height for the sluice aerator. 5. Acknowledgements The authors acknowledge the technical support by Mangla Joint Venture-Mangla Dam Raising Project, Pakistan, assistance by the technical staff of the Hydraulic Re- search Station Nandi Pur and financial support by the Water and Power Development Authority, Pakistan. REFERENCES [1] H. T. Falvey, “Cavitation in Chutes and Spillways,” En- gineering Monograph No. 42, A Water Resources Tech- nical Publication, United State Department of Interior, Bureau of Reclamation, Denver, 1990. [2] H. Chanson, “Air Bubble Entrainment in Free-Surface Turbulent Shear Flows,” Academic Press, London, 1997, 401 p. [3] M. Brocchini and D. H. Peregrine, “The Dynamics of Strong Turbulence at Free Surface. Part 1. Description,” Journal of Fluid Mechanics, Vol. 449, 2001, pp. 225-254. doi:10.1017/S0022112001006012 [4] D. Colgate, “Hydraulic Model Studies of Amaluza Dam Spillway,” US Bureau of Reclamation Report No. GR- 25-76, 1976. [5] A. J. Paterka, “The Effect of Entrained Air on Cavitation Pitting,” Proceedings of the Joint Meeting of the Interna- tional Association for Hydraulic Research, American So- ciety of Civil Engineers, Minneapolis, 1953. [6] V. M. Semenkov and L. D. Lentyaev, “Spillway with Nappe Aeration,” In: H. T. Falvey, Cavitation in Chutes and Spillways, Engineering Monograph No. 42, A Water Resources Technical Publication, United State Depart- ment of Interior (USBR), Bureau of Reclamation, Denver, 1973. [7] D. Colgate and R. Elder, “Design Considerations Re- garding Cavitation in Hydraulic Structures,” Proceedings of 10th Hydraulic Division Conference of American Soci- ety of Civil Engineers, Urbana, 16-18 August 1961. [8] Borden, D. Colgate, J. Legas and C.E. Selander, “Docu- mentation of Operation, Damage, Repair and Testing of Yellowtail Dam Spillway,” US Bureau of Reclamation Report REC-ERC-71-23, 1971, 76 p. [9] K. Kramer, “Development of Aerated Chute Flow,” Doc- toral Thesis ETH No 15428, Technical University of Darmstadt, Dipl-Ing, 2006. [10] National Engineering Services Pakistan (NESPAK), As- sociated Consulting Engineers (ACE), Barqaab Consult- ing Services (BCS), Binnie, Black and Veatch, UK (BBV), MWH Americas Inc., “Sedimentation Studies of Mangla Dam Raising Project,” Vol. 1. Project Report Water and Power Development Authority (WAPDA), Pakistan, 2004. [11] F. M. Henderson, “Open Channel Flow,” MacMillan Company, New York, 1966. [12] P. Novak and J. Cabelka, “Models in Hydraulic Engi- neering, Physical Principles and Design Applications,” Pitman Publication, London, 1981. [13] M. Takahashi, C. A. Gonazalez and H. Chanson, “Self- Aeration and Turbulence in a Stepped Channel: Influence of Cavity Surface Roughness,” International Journal of Multiphase Flow, Vol. 32, No. 12, 2006, pp. 1370-1385. doi:10.1016/j.ijmultiphaseflow.2006.07.001 Copyright © 2012 SciRes. JWARP |