

Paper Menu >>
Journal Menu >>
 Open Journal of Applied Sciences, 2012, 2, 236-240 doi:10.4236/ojapps.2012.24035 Published Online December 2012 (http://www.SciRP.org/journal/ojapps) The Principle of Mathematical Induction Applied to the Generalized Model for the Economic Design of x -Control Charts Mohamed E. Seliaman1, Salih O. Duffuaa2 1Department of Information Systems, King Faisal University, Al-Ahsa, Saudi Arabia 2Department of Systems Engineering, King Fahd University of Petroleum & Minerals, Dhahran, Saudi Arabia Email: [email protected] Received August 4, 2012; revised September 6, 2012; accepted September 25, 2012 ABSTRACT Rahim and Banerjee [1] developed a general model for the optimal design of x -control charts. The model minimizes the expected cost per unit time. The heart of the model is a theorem that derives the expected total cost and the expected cycle length. In this paper an alternative simple proof for the theorem is provided based on mathematical induction. Keywords: Discrete Mathematics; Mathematical Induction; Statistical Quality Control; Design of x -Control Charts; Hazard Rate Function 1. Introduction Quality control charts are graphical statistical tools used for process control. The first control chart was developed by Walter A. Shewart [2]. Since then, these charts have been widely applied in industry and also received inten- sive attention from researchers. The x -control charts are the most used statistical control charts when continuous variables are used to measure quality characteristics [3]. Generally, control charts are designed using four ap- proaches: heuristics, statistical design, economic design and economic statistical design [4]. For more information on the design of control charts, interested readers are re- ferred to [1-7]. The economic design of x -control charts was origi- nated by Duncan [8]. In his model, Duncan considers a production process that is subject to an occurrence of an assignable cause that will drive the process out of control. The output of the process is measurable on a certain scale and is normally distributed with mean 0 and standard deviation 0 . The assignable cause is assumed to occur according to a Possion process with intensity and causes a shift in the process mean to 0 , where is a positive parameter. The control limits of the x -control chart are set at 00 k , where 0 is the standard deviation of the process. A sample of size n is taken from the output of the process every h hour, and used to decide whether the process is in control or not. Banerjee and Rahim [9] generalized Duncan’s model [8] for the economic design of x -control charts by relaxing Duncan’s assumption that the in-control period follows an exponential distribution. Instead, they assumed it follows a general probability distribution having an increasing hazard rate function. The increasing hazard rate assump- tion resulted in the modification of the fixed sampling interval to a variable sampling interval, dependent on the process age. In both models, if the sample falls outside the control limits, a search is initiated to locate the assignable cause. If the search indicates that there is a false alarm, the process continues. On the other hand, if the alarm is true, repair or replacement is undertaken to bring the process in control. Later, Rahim and Banerjee [1] ex- tended the model in Banerjee and Rahim [9] by assuming a general distribution of in-control periods with increasing failure rate and considering an age-dependent repair be- fore failure. The objective of Rahim and Banerjee’s model [1] is to find the parameters n, hj, and k. Under the assumptions described for this generalized model, they derived expressions for the expected cycle length and the total expected cost per cycle. They also presented proofs for these expressions using a recursive argument. In this paper a simpler and shorter mathematical induction proof of these results is presented. Thus, our alternative proof may make it easier for students and professors interested in the topic within graduate coursework or further re- search on extending the model. In this paper, we adopt the same notations and model descriptions as defined in Ra- him and Banerjee [1]. In order to make the paper self-contained, we describe the main elements involved in the design of control charts, Copyright © 2012 SciRes. OJAppS 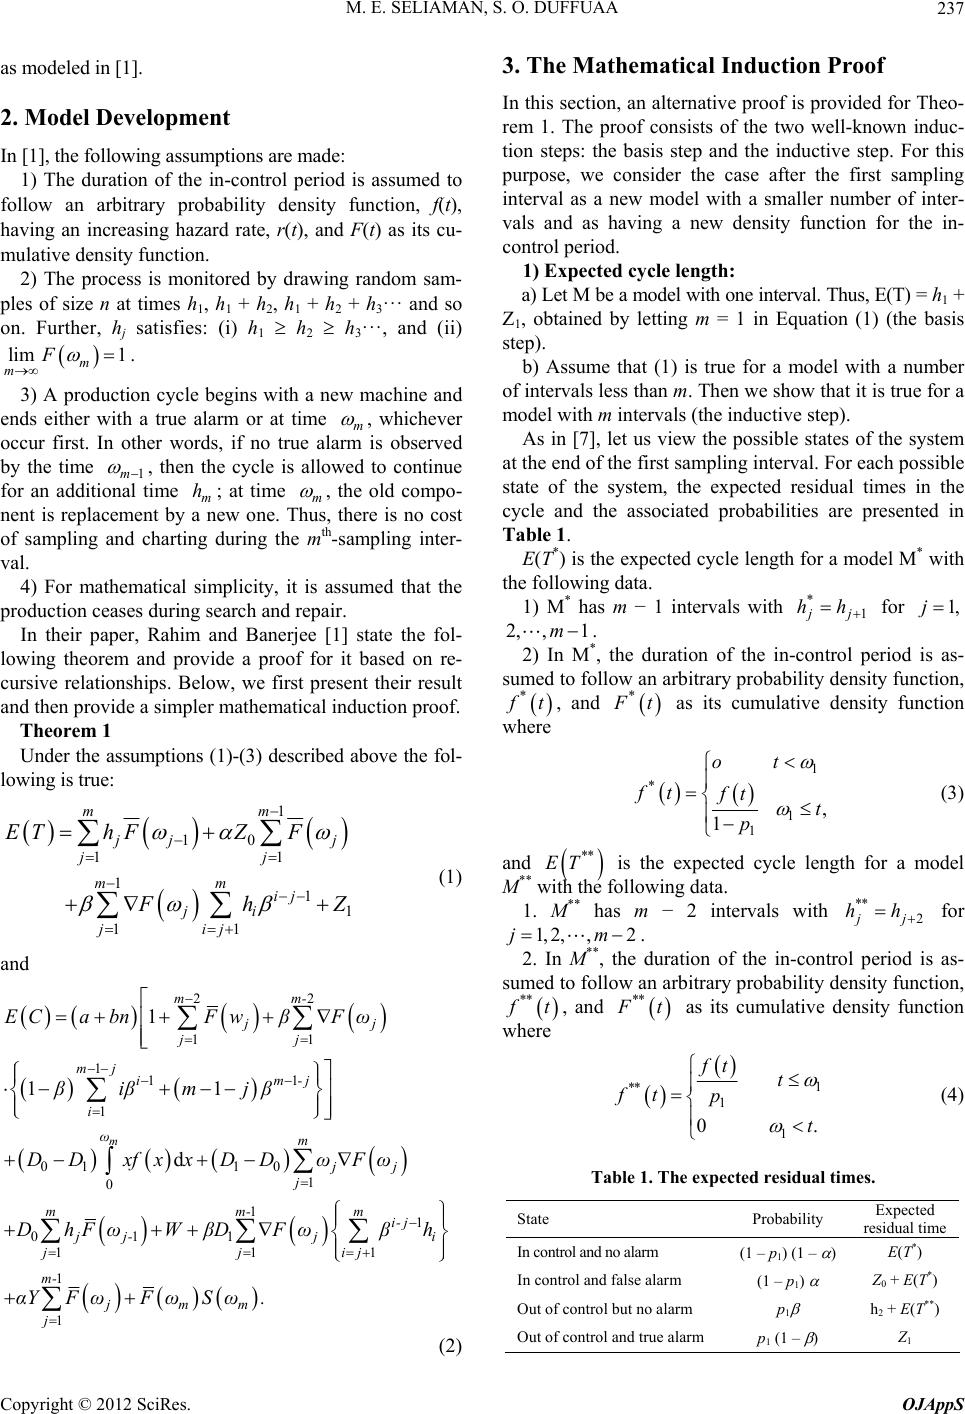 M. E. SELIAMAN, S. O. DUFFUAA 237 as modeled in [1]. 2. Model Development In [1], the following assumptions are made: 1) The duration of the in-control period is assumed to follow an arbitrary probability density function, f(t), having an increasing hazard rate, r(t), and F(t) as its cu- mulative density function. 2) The process is monitored by drawing random sam- ples of size n at times h1, h1 + h2, h1 + h2 + h3··· and so on. Further, hj satisfies: (i) h1 h2 h3···, and (ii) lim 1 m m F . 3) A production cycle begins with a new machine and ends either with a true alarm or at time m , whichever occur first. In other words, if no true alarm is observed by the time 1m , then the cycle is allowed to continue for an additional time m; at time m h , the old compo- nent is replacement by a new one. Thus, there is no cost of sampling and charting during the mth-sampling inter- val. 4) For mathematical simplicity, it is assumed that the production ceases during search and repair. In their paper, Rahim and Banerjee [1] state the fol- lowing theorem and provide a proof for it based on re- cursive relationships. Below, we first present their result and then provide a simpler mathematical induction proof. Theorem 1 Under the assumptions (1)-(3) described above the fol- lowing is true: 1 10 11 11 1 11 mm j jj jj mm ij ji jij EThFZ F Fh Z and (1) 22 11 111 1 01 10 1 0 11 011 111 1 1 1 11 d m mm- jj jj mj im-j i ωm jj j mm-m i- j jj-j i jjij m- jmm j ECa bnFwβFω βiβmjβ DD xfxxDDωFω DhFωWβDFωβh αYFωFωSω. (2) 3. The Mathematical Induction Proof or Theo- n induc- del with one interval. Thus, E(T) = h1 + Z1 in Equation (1) (the basis st vals less than m. Then we show that it is true for a m ach possible st ing data. In this section, an alternative proof is provided f rem 1. The proof consists of the two well-know tion steps: the basis step and the inductive step. For this purpose, we consider the case after the first sampling interval as a new model with a smaller number of inter- vals and as having a new density function for the in- control period. 1) Expected cycle length: a) Let M be a mo , obtained by letting m = 1 ep). b) Assume that (1) is true for a model with a number of inter odel with m intervals (the inductive step). As in [7], let us view the possible states of the system at the end of the first sampling interval. For e ate of the system, the expected residual times in the cycle and the associated probabilities are presented in Table 1. E(T*) is the expected cycle length for a model M* with the follow 1) M* has m − 1 intervals with * 1 j j hh for 1,j 2, ,1m . 2) In M*, the duration of the in-coeriod is as- oll ntrol p sumed to fow an arbitrary probability density function, * f t, and * F t as its cumulative density function where 1 * 1 1 , 1 ot ft ft t p (3) and ** ET with th is the expected cycle length for a model M** e following data. M** h1. as m − 2 intervals with ** 2 j j hh for 1, 2,,2jm . 2. In M**, the duration of the in-contro as-l period is sumed to follow an arbitrary probability density function, ** f t, and ** F t as its cumulative density function where 1 ** 1 1 0. ft t ft p t (4) Table 1. The expected residual times. State Probability dual time Expected resi In control and no alarm (1) – p1) (1 – E(T*) In control and false alarm (1 – p) arm h) m 1 p Z0 + E(T*) Out of control but no al1 p1 (1 – ) 2 Z1 + E(T** Out of control and true alar Copyright © 2012 SciRes. OJAppS 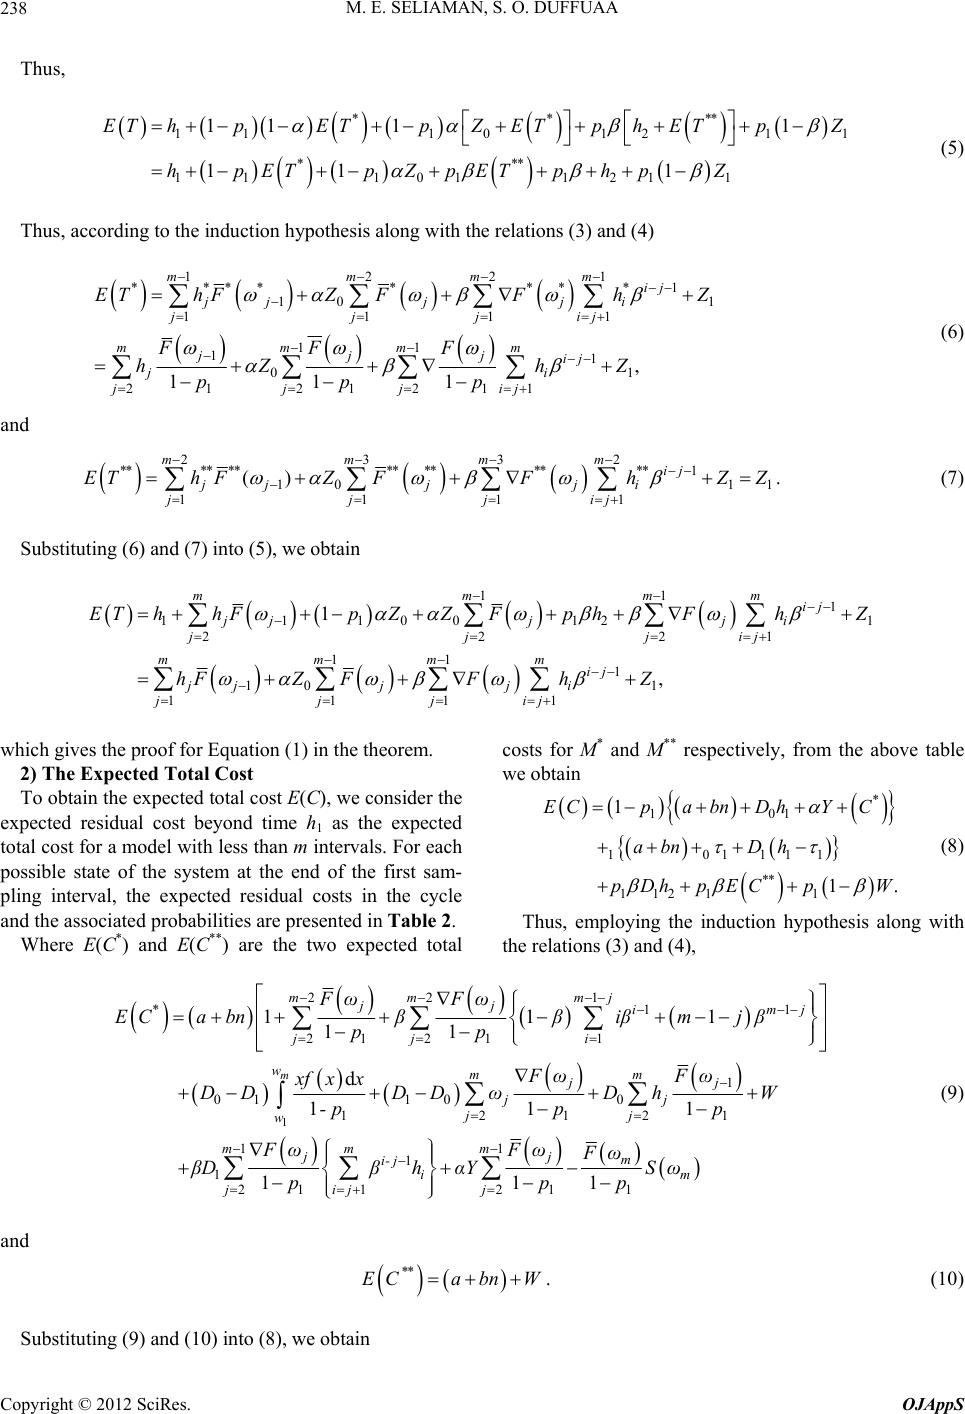 M. E. SELIAMAN, S. O. DUFFUAA Copyright © 2012 SciRes. OJAppS 238 Thus, **** 1110 121 *** 11101121 1 11 11 11 1 EThpETpZETph ETpZ hpETpZpETphp Z 1 (5) Thus, according to the induction hypothesis along with the relations (3) and (4) 1221mmmm **** ****1 10 1 1111 11 11 01 2221 111 , 111 ij jj j ji jjjij mmmm jjj ij ji jjjij EThFZ FFhZ FFF hZ hZ ppp (6) and 2332 **** **********1 10 1 1111 () mmmm ij jjj ji jjjij EThFZFFhZZ 1 . (7) Substituting (6) and (7) into (5), we obtain 11 1 1110012 222 11 1 10 1 1111 1 , 1 1 mmm ij jjjj i jjjij mmmm ij jjjj i jjjij EThhFpZZFp hFhZ hFZFFhZ hich gives the proof for Equation (1) in the theorem. he ex costs for M* and M** respectively, from the above table m w2) The Expected Total Cost ost E(C), we consider t we obtain 10 1 101111 ** 11211 1 1 pa bnDhYC abn Dh To obtain the expected total c* EC . p DhpE CpW pected residual cost beyond time h1 as the expected total cost for a model with less than m intervals. For each possible state of the system at the end of the first sam- pling interval, the expected residual costs in the cycle (8) Thus, employing the induction hypothesis along with th and the associated probabilities are presented in Table 2. Where E(C*) and E(C**) are the two expected total e relations (3) and (4), 1 11 22 1 11 1 01 100 22 111 11 1 21 1 111 11 d 111 1 m jj *im j jj i wmm jj jj jj w mm ji- j i jij EC a bnββiβmjβ pp FωFω xf xx DDDD ωDh W -pp p FωF βDβhαY p 1mj 22mm FωFω 1 211 11 mjm m j ωFωSω pp (9) and ** ECabnW . (10) Substituting (9) and (10) into (8), we obtain 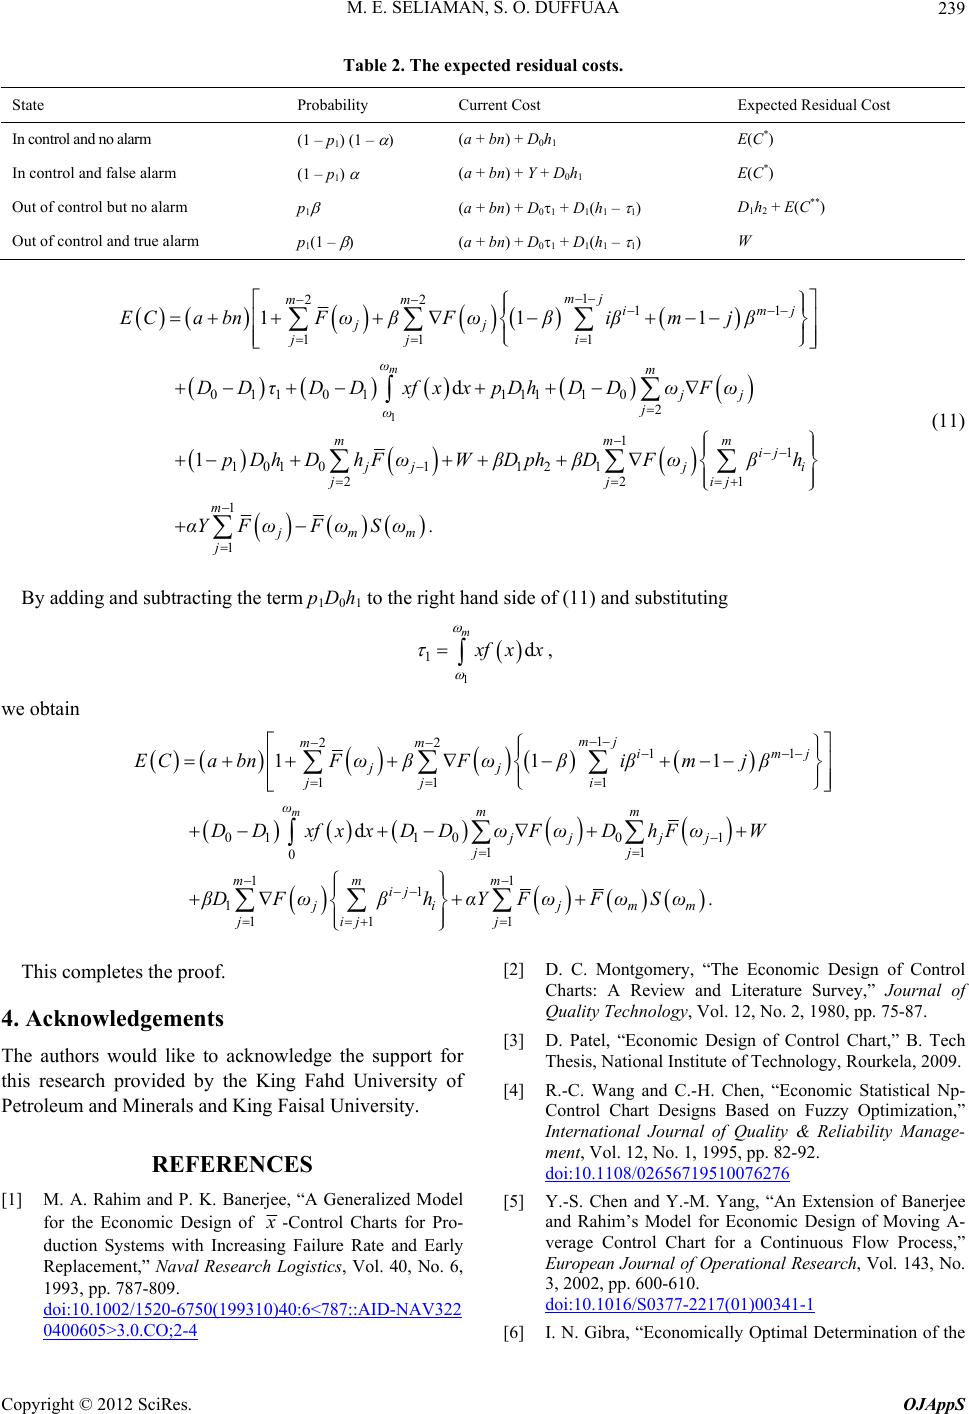 M. E. SELIAMAN, S. O. DUFFUAA 239 Table 2. The expected residual costs. State Probability Expected Residual Cost Current Cost In control and no alarm 1 ) 1 (1 – p) (1 – (a + bn) + D0h E(C*) In control and false alarm 0h1 h1 – 1) 2E(C**) ) (1 – p1) (a + bn) + Y + D E(C*) Out of control but no alarm p1 (a + bn) + D01 + D1(D1h + Out of control and true alarm p1(1 –(a + bn) + D01 + D1(h1 – 1) W 1 1 22 11 11 1 01101111 10 2 11 10101121 22 111 d 1 m mj mm im jj jj i ωm jj j ω mm ij 1 j m j jj jj ECa bnFωβ Fωβiβmjβ DDτDDxfxxpDh DDωFω pDh DhFωWβDph βDFωβh i ij 1 1 m jmm j αYFωFωSω . (11) By adding and subtracting the term p1D0h1 to the right hand side of (11) and substituting 1 1d m x fx x , we obtain 1 22 11 11 1 011001 11 0 11 1 1 11 1 111 d m mj mm im jj jj i ωmm jj jj jj mm m ij ji jmm jijj ECa bnFωβ Fωβiβmjβ DD xfxxDDωFωDhFωW βDFωβhαYFωFωSω . j This completes the proof. 4. Acknowledgements cknowledge the support for REFERENCES [1] M. A. Rahim Generalized Mode The authors would like to a this research provided by the King Fahd University of Petroleum and Minerals and King Faisal University. and P. K. Banerjee, “A l for the Economic Design of x -Control Charts for Pro- duction Systems with Increasing Failure Rate and Early Replacement,” Naval Research Logistics, Vol. 40, No. 6, 1993, pp. 787-809. doi:10.1002/1520-6750(199310)40:6<787::AID-NAV322 0400605>3.0.CO;2-4 Charts: A Review an [2] D. C. Montgomery, “The Economic Design of Control d Literature Survey,” Journal of 09. Quality Technology, Vol. 12, No. 2, 1980, pp. 75-87. [3] D. Patel, “Economic Design of Control Chart,” B. Tech Thesis, National Institute of Technology, Rourkela, 20 [4] R.-C. Wang and C.-H. Chen, “Economic Statistical Np- Control Chart Designs Based on Fuzzy Optimization,” International Journal of Quality & Reliability Manage- ment, Vol. 12, No. 1, 1995, pp. 82-92. doi:10.1108/02656719510076276 [5] Y.-S. Chen and Y.-M. Yang, “An Extension of Banerjee and Rahim’s Model for Economic Design of Moving A- verage Control Chart for a Continuous Flow Process,” European Journal of Operational Research, Vol. 143, No. 3, 2002, pp. 600-610. doi:10.1016/S0377-2217(01)00341-1 [6] I. N. Gibra, “Economically Optimal Determination of the Copyright © 2012 SciRes. OJAppS  M. E. SELIAMAN, S. O. DUFFUAA 240 Parameters of x -Control Chart,” Management Sc nd R Charts,” Tech- ience, Vol. 17, No. 9, 1971, pp. 635-646. [7] E. M. Saniga, “Economic Statistical Control-Chart De- signs with an Application to X a nometrics, Vol. 31, No. 3, 1989, pp. 313-320. [8] A. J. Duncan, “The Economic Design of x -Control Charts Used to Maintain Current Control of a Process,” Journal of the American Statistics Association, Vol. 51, 1956, pp. 228-242. [9] P. K. Banerjee and M. A. Rahim, “Economic Design of x -Control Charts under Weibull Shock Models,” Tech- nometrics, Vol. 30, No. 4, 1998, pp. 407-414. Notation Z0 = expected search time associated with a false alarm. Z1 = expected search time to discover the assignable cause and repair. a = fixed sampling cost. b = sampling cost per unit sampled. Y = cost per false alarm. W = cost to locate and repair the assignable cause. D0 = quality cost per hour while producing and the pro- cess is in control. D1 = quality cost per hour while producing and the pro- cess is out of control. = probability of Type I error. = probability of Type II error. h = the sampling interval for a uniform sampling scheme. j h = the jth sampling interval for a non-uniform sam- pling scheme. j = h1 + h2 +···+ hj. M = a specified number of sampling intervals. n = sample size. E(T) = expected cycle length. E(C) = expected cost. Pj = the conditional probability that process goes out of control between 1 j and j , given that it was at the in-control state at time 1 j . Copyright © 2012 SciRes. OJAppS |