

Paper Menu >>
Journal Menu >>
 Open Journal of Applied Sciences, 2012, 2, 216-223 doi:10.4236/ojapps.2012.24032 Published Online December 2012 (http://www.SciRP.org/journal/ojapps) Modeling Experimental Design for Photo-Fenton Degradation of Methomyl Abdelhadi Abaamrane1,2*, Samir Qourzal2, Saïd Mançour Billah1, Ali Assabbane2, Yhya Ait-Ichou2 1Laboratoire de Génie des Procédés, Département de Chimie, Faculté des Sciences, Université Ibn Zohr, Agadir, Morocco 2Equipe de Matériaux, Photocatalyse et Environnement, Département de Chimie, Faculté des Sciences, Université Ibn Zohr, Agadir, Morocco Email: *[email protected] Received August 27, 2012; revised September 30, 2012; accepted October 10, 2012 ABSTRACT Modeling experimental design was used to study the main effects and the interaction effects between operational pa- rameters in the photocatalytic degradation of pesticide methomyl. The important parameters which affect the removal efficiency of methomyl such as concentration of Fe(NO3)3, concentration of H2O2, initial concentration of the pesticide and pH. The parameters were coded as x1, x2, x3 and x4, consecutively, and were investigated at two levels (–1 and +1). The effects of individual variables and their interaction effects for dependent variables, namely, photocatalytic degrada- tion efficiency (%) were determined. From the statistical analysis, the most effective parameters in the photocatalytic degradation efficiency were initial concentrations of the methomyl and Fe(NO3)3. The interaction between initial con- centration of the pesticide and Fe(NO3)3 was the most influencing interaction. The optimum conditions that were ob- tained for the photocatalytic degradation of methomyl were: minimum quantity of contaminant: 6 × 10⁻⁵ mol·L–1, maximum quantity of Fe(NO3)3: 5 × 10⁻⁴ mol·L–1, initial pH of the solution: 3 and maximum quantity H2O2: 10–2 mol· L –1. Keywords: Methomyl; Photocatalytic Degradation; Response Surface Methodology (RSM); Full Factorial Design 1. Introduction Pesticides are commonly used worldwide to face the need for increasing and improving agricultural produc- tion [1,2]. The detection of pesticides in storm and waste- water effluent is reported to be a major obstacle as re- gards wide ranging acceptance of water recycling. Fur- thermore, their variety, toxicity and persistence can di- rectly impact the ecosystem and threaten humans through contamination of drinking water supplies (surface and ground water). Methomyl is an oxime carbamate insecticide (Figure 1). It is produced by reacting S-methyl-N-hydroxylthio acetamidate (MHTA) in methylene chloride with gaseous methyl isocyanate at 30˚C - 35˚C. Methomyl is highly soluble in water (57.9 g·L−1) [3]. It has a low sorption affinity to soil and can therefore easily cause groundwa- ter contamination in agricultural areas. Methomyl is effective in two ways: 1) as a “contact insecticide” because it kills target insects upon direct contact; and 2) as a “systemic insecticide” because of its capability to cause overall “systemic” poisoning in target insects, after it is absorbed and transported throughout the pests that feed on treated plants. This insecticide is mainly used in Morocco on a wide range of tomato crops. However, it has been classified as a very toxic and ha- zardous pesticide [4]. Recently, chemical treatment methods, based on the generation of hydroxyl radicals (OH•), known as Ad- vanced Oxidation Processes (AOPs), due to their effi- ciency in oxidizing a great variety of organic contami- nants [5-9]. The Fenton treatments are the requirement of H2O2, Fe2+ salts and pH adjustment (mostly acidic). With the additions of H2O2 and Fe2+ salts, highly reactive and un- selective oxidants are produced as shown in Equation (1) that leads to the formation of less powerful hydroperoxyl Figure 1. Chemical structure of methomyl. *Corresponding author. Copyright © 2012 SciRes. OJAppS 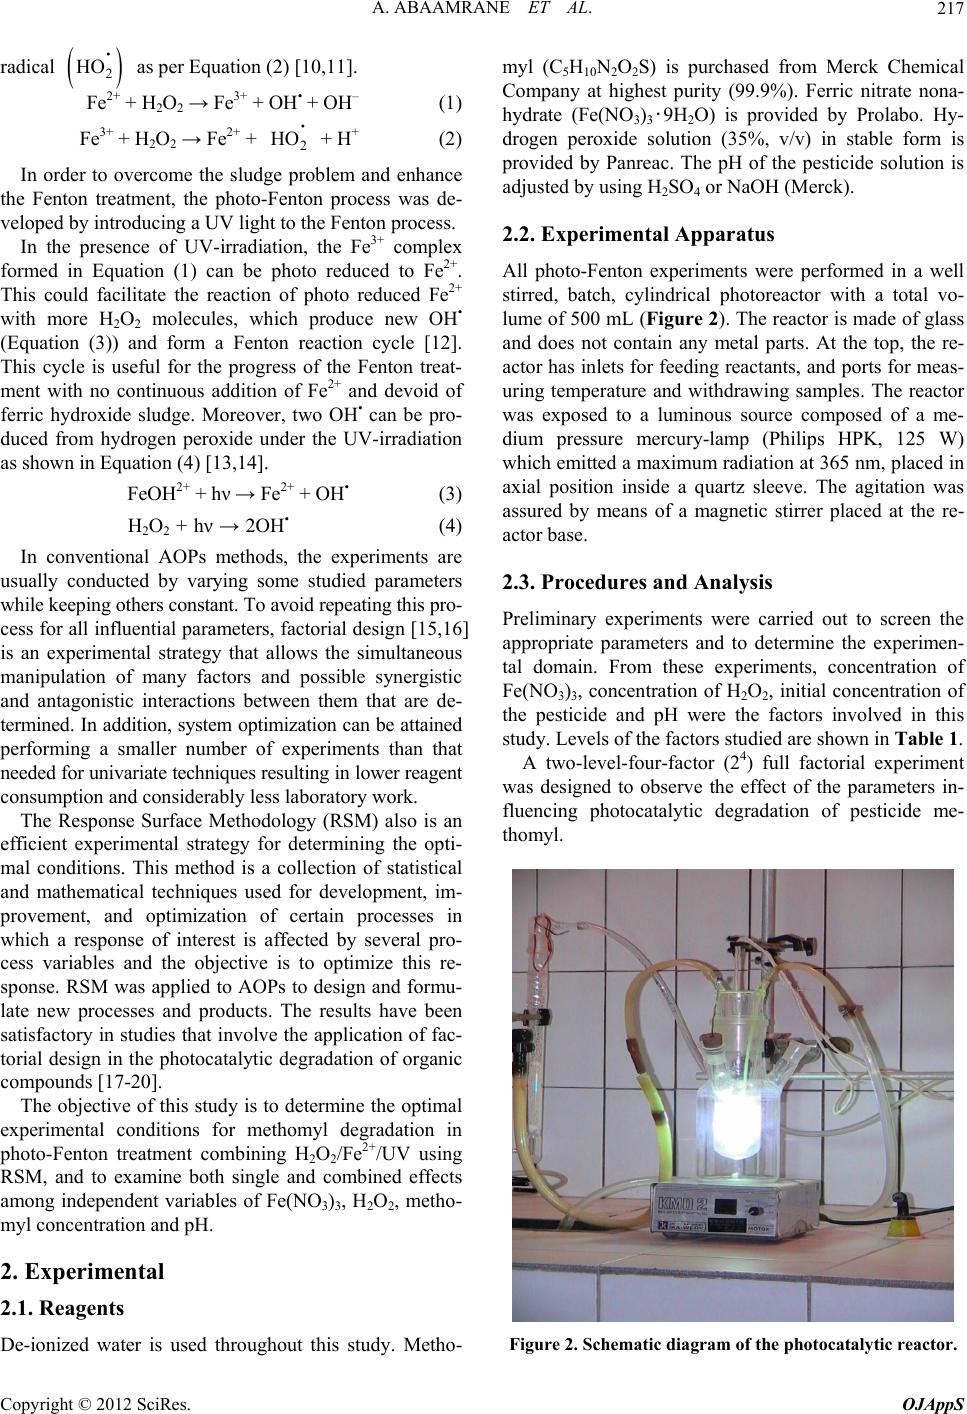 A. ABAAMRANE ET AL. 217 radical as per Equation (2) [10,11]. • 2 HO • Fe2+ + H2O2 → Fe3+ + OH• + OH– (1) Fe3+ + H2O2 → Fe2+ + + H+ (2) 2 HO In order to overcome the sludge problem and enhance the Fenton treatment, the photo-Fenton process was de- veloped by introducing a UV light to the Fenton process. In the presence of UV-irradiation, the Fe3+ complex formed in Equation (1) can be photo reduced to Fe2+. This could facilitate the reaction of photo reduced Fe2+ with more H2O2 molecules, which produce new OH• (Equation (3)) and form a Fenton reaction cycle [12]. This cycle is useful for the progress of the Fenton treat- ment with no continuous addition of Fe2+ and devoid of ferric hydroxide sludge. Moreover, two OH• can be pro- duced from hydrogen peroxide under the UV-irradiation as shown in Equation (4) [13,14]. FeOH2+ + hν → Fe2+ + OH• (3) H2O2 + hν → 2OH• (4) In conventional AOPs methods, the experiments are usually conducted by varying some studied parameters while keeping others constant. To avoid repeating this pro- cess for all influential parameters, factorial design [15,16] is an experimental strategy that allows the simultaneous manipulation of many factors and possible synergistic and antagonistic interactions between them that are de- termined. In addition, system optimization can be attained performing a smaller number of experiments than that needed for univariate techniques resulting in lower reagent consumption and considerably less laboratory work. The Response Surface Methodology (RSM) also is an efficient experimental strategy for determining the opti- mal conditions. This method is a collection of statistical and mathematical techniques used for development, im- provement, and optimization of certain processes in which a response of interest is affected by several pro- cess variables and the objective is to optimize this re- sponse. RSM was applied to AOPs to design and formu- late new processes and products. The results have been satisfactory in studies that involve the application of fac- torial design in the photocatalytic degradation of organic compounds [17-20]. The objective of this study is to determine the optimal experimental conditions for methomyl degradation in photo-Fenton treatment combining H2O2/Fe2+/UV using RSM, and to examine both single and combined effects among independent variables of Fe(NO3)3, H2O2, metho- myl concentration and pH. 2. Experimental 2.1. Reagents De-ionized water is used throughout this study. Metho- myl (C5H10N2O2S) is purchased from Merck Chemical Company at highest purity (99.9%). Ferric nitrate nona- hydrate (Fe(NO3)3‧9H2O) is provided by Prolabo. Hy- drogen peroxide solution (35%, v/v) in stable form is provided by Panreac. The pH of the pesticide solution is adjusted by using H2SO4 or NaOH (Merck). 2.2. Experimental Apparatus All photo-Fenton experiments were performed in a well stirred, batch, cylindrical photoreactor with a total vo- lume of 500 mL (Figure 2). The reactor is made of glass and does not contain any metal parts. At the top, the re- actor has inlets for feeding reactants, and ports for meas- uring temperature and withdrawing samples. The reactor was exposed to a luminous source composed of a me- dium pressure mercury-lamp (Philips HPK, 125 W) which emitted a maximum radiation at 365 nm, placed in axial position inside a quartz sleeve. The agitation was assured by means of a magnetic stirrer placed at the re- actor base. 2.3. Procedures and Analysis Preliminary experiments were carried out to screen the appropriate parameters and to determine the experimen- tal domain. From these experiments, concentration of Fe(NO3)3, concentration of H2O2, initial concentration of the pesticide and pH were the factors involved in this study. Levels of the factors studied are shown in Table 1. A two-level-four-factor (24) full factorial experiment was designed to observe the effect of the parameters in- fluencing photocatalytic degradation of pesticide me- thomyl. Figure 2. Schematic diagram of the photocatalytic reactor. Copyright © 2012 SciRes. OJAppS 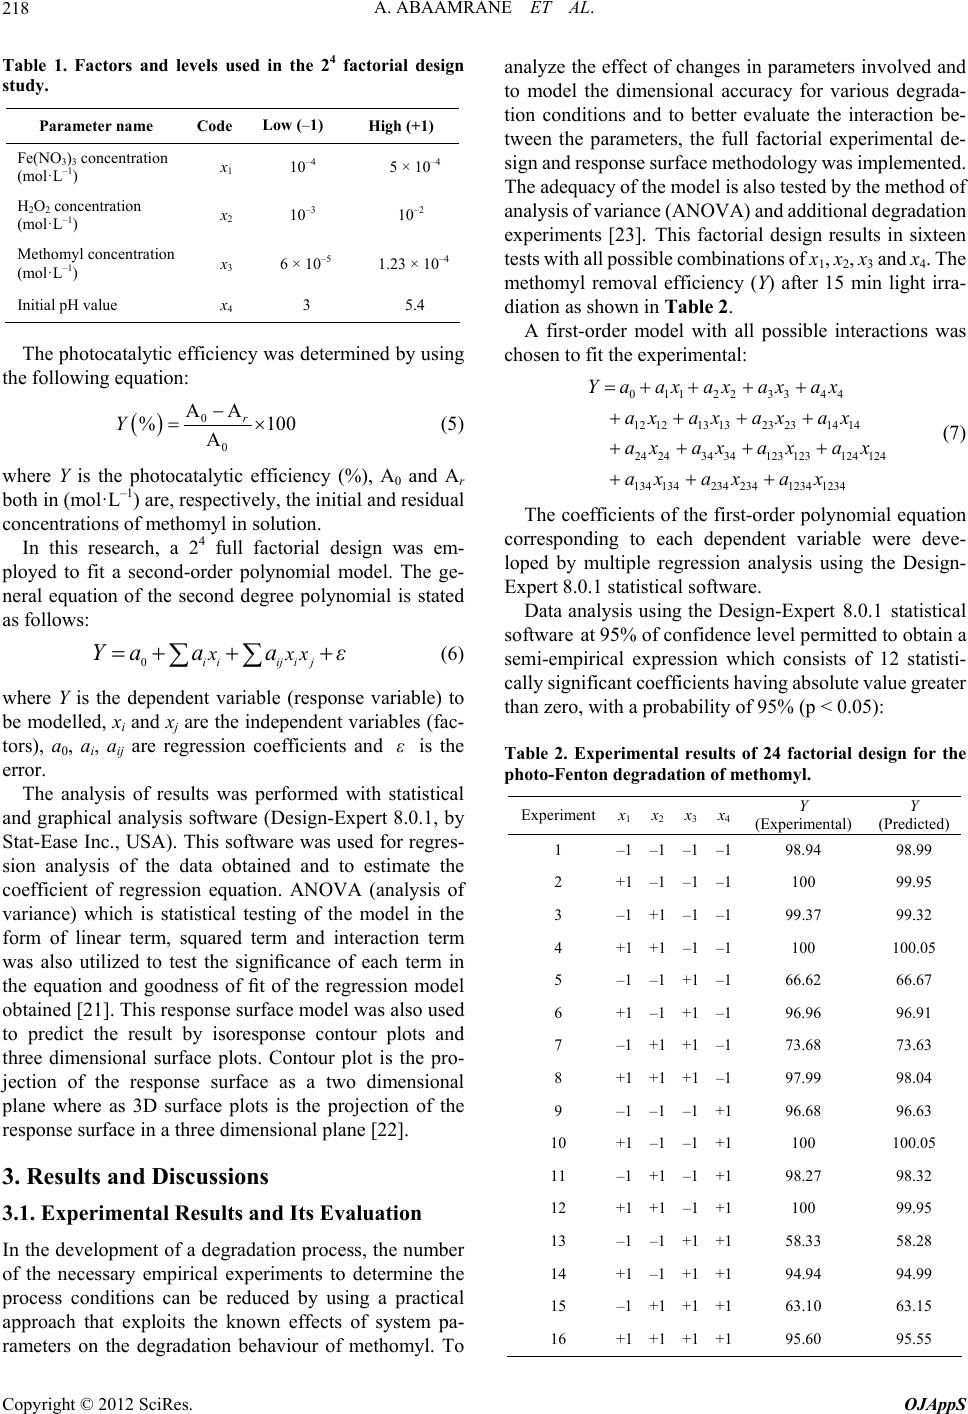 A. ABAAMRANE ET AL. 218 Table 1. Factors and levels used in the 24 factorial design study. Parameter name Code Low (–1) High (+1) Fe(NO3)3 concentration (mol·L–1) x1 10–4 5 × 10⁻⁴ H2O2 concentration (mol·L–1) x2 10–3 10–2 Methomyl concentration (mol·L–1) x3 6 × 10⁻⁵ 1.23 × 10⁻⁴ Initial pH value x4 3 5.4 The photocatalytic efficiency was determined by using the following equation: 0 0 AA % A r Y 1 00 (5) where Y is the photocatalytic efficiency (%), A0 and Ar both in (mol·L–1) are, respectively, the initial and residual concentrations of methomyl in solution. In this research, a 24 full factorial design was em- ployed to fit a second-order polynomial model. The ge- neral equation of the second degree polynomial is stated as follows: 0iiiji j xxxYa aaε (6) where Y is the dependent variable (response variable) to be modelled, xi and xj are the independent variables (fac- tors), a0, ai, aij are regression coefficients and is the error. ε The analysis of results was performed with statistical and graphical analysis software (Design-Expert 8.0.1, by Stat-Ease Inc., USA). This software was used for regres- sion analysis of the data obtained and to estimate the coefficient of regression equation. ANOVA (analysis of variance) which is statistical testing of the model in the form of linear term, squared term and interaction term was also utilized to test the significance of each term in the equation and goodness of fit of the regression model obtained [21]. This response surface model was also used to predict the result by isoresponse contour plots and three dimensional surface plots. Contour plot is the pro- jection of the response surface as a two dimensional plane where as 3D surface plots is the projection of the response surface in a three dimensional plane [22]. 3. Results and Discussions 3.1. Experimental Results and Its Evaluation In the development of a degradation process, the number of the necessary empirical experiments to determine the process conditions can be reduced by using a practical approach that exploits the known effects of system pa- rameters on the degradation behaviour of methomyl. To analyze the effect of changes in parameters involved and to model the dimensional accuracy for various degrada- tion conditions and to better evaluate the interaction be- tween the parameters, the full factorial experimental de- sign and response surface methodology was implemented. The adequacy of the model is also tested by the method of analysis of variance (ANOVA) and additional degradation experiments [23]. This factorial design results in sixteen tests with all possible combinations of x1, x2, x3 and x4. The methomyl removal efficiency (Y) after 15 min light irra- diation as shown in Table 2. A first-order model with all possible interactions was chosen to fit the experimental: 0112233 44 12 121313232314 14 24243434123 123124124 134 1342342341234 1234 Y aaxaxaxax ax ax axax axaxa xa x axaxa x (7) The coefficients of the first-order polynomial equation corresponding to each dependent variable were deve- loped by multiple regression analysis using the Design- Expert 8.0.1 statistical software. Data analysis using the Design-Expert 8.0.1 statistical software at 95% of confidence level permitted to obtain a semi-empirical expression which consists of 12 statisti- cally significant coefficients having absolute value greater than zero, with a probability of 95% (p < 0.05): Table 2. Experimental results of 24 factorial design for the photo-Fenton degradation of methomyl. Experiment x1x2x3x4 Y (Experimental) Y (Predicted) 1 –1–1–1–1 98.94 98.99 2 +1–1–1–1 100 99.95 3 –1+1–1–1 99.37 99.32 4 +1+1–1–1 100 100.05 5 –1–1+1–1 66.62 66.67 6 +1–1+1–1 96.96 96.91 7 –1+1+1–1 73.68 73.63 8 +1+1+1–1 97.99 98.04 9 –1–1–1+1 96.68 96.63 10 +1–1–1+1 100 100.05 11 –1+1–1+1 98.27 98.32 12 +1+1–1+1 100 99.95 13 –1–1+1+1 58.33 58.28 14 +1–1+1+1 94.94 94.99 15 –1+1+1+1 63.10 63.15 16 +1+1+1+1 95.60 95.55 Copyright © 2012 SciRes. OJAppS 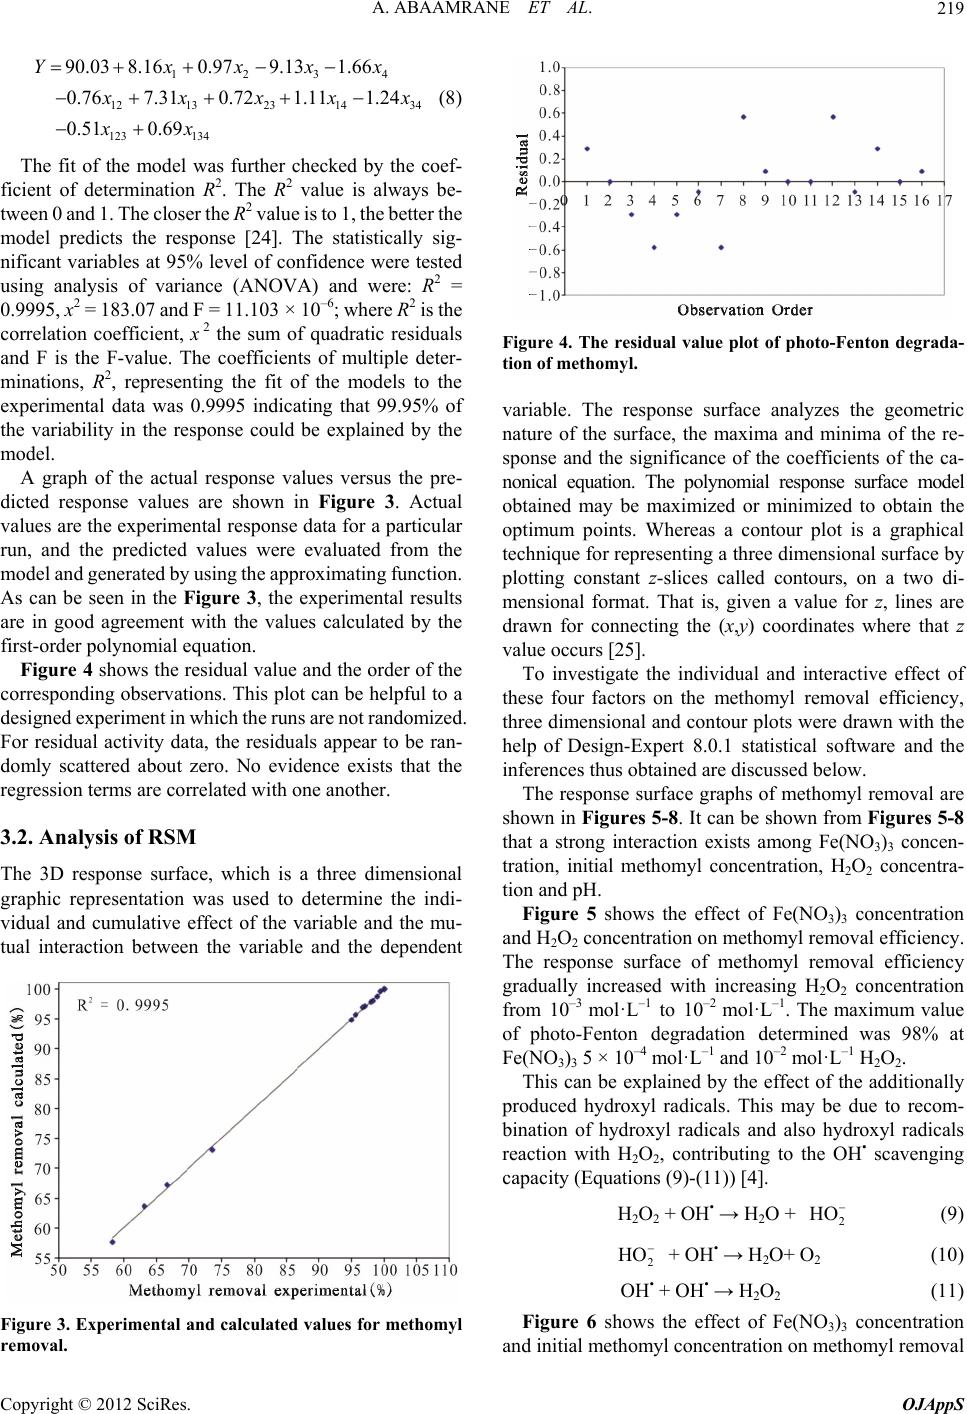 A. ABAAMRANE ET AL. 219 1234 1213231434 123 134 90.03 8.16 0.97 9.131.66 0.76 7.31 0.72 1.111.24 0.51 0.69 Yxxxx x xxx xx x (8) The fit of the model was further checked by the coef- ficient of determination R2. The R2 value is always be- tween 0 and 1. The closer the R2 value is to 1, the better the model predicts the response [24]. The statistically sig- nificant variables at 95% level of confidence were tested using analysis of variance (ANOVA) and were: R2 = 0.9995, x2 = 183.07 and F = 11.103 × 10⁻⁶; where R2 is the correlation coefficient, x 2 the sum of quadratic residuals and F is the F-value. The coefficients of multiple deter- minations, R2, representing the fit of the models to the experimental data was 0.9995 indicating that 99.95% of the variability in the response could be explained by the model. Figure 4. The residual value plot of photo-Fenton degrada- tion of methomyl. A graph of the actual response values versus the pre- dicted response values are shown in Figure 3. Actual values are the experimental response data for a particular run, and the predicted values were evaluated from the model and generated by using the approximating function. As can be seen in the Figure 3, the experimental results are in good agreement with the values calculated by the first-order polynomial equation. Figure 4 shows the residual value and the order of the corresponding observations. This plot can be helpful to a designed experiment in which the runs are not randomized. For residual activity data, the residuals appear to be ran- domly scattered about zero. No evidence exists that the regression terms are correlated with one another. 3.2. Analysis of RSM variable. The response surface analyzes the geometric nature of the surface, the maxima and minima of the re- sponse and the significance of the coefficients of the ca- nonical equation. The polynomial response surface model obtained may be maximized or minimized to obtain the optimum points. Whereas a contour plot is a graphical technique for representing a three dimensional surface by plotting constant z-slices called contours, on a two di- mensional format. That is, given a value for z, lines are drawn for connecting the (x,y) coordinates where that z value occurs [25]. To investigate the individual and interactive effect of these four factors on the methomyl removal efficiency, three dimensional and contour plots were drawn with the help of Design-Expert 8.0.1 statistical software and the inferences thus obtained are discussed below. The response surface graphs of methomyl removal are shown in Figures 5-8. It can be shown from Figures 5-8 that a strong interaction exists among Fe(NO3)3 concen- tration, initial methomyl concentration, H2O2 concentra- tion and pH. The 3D response surface, which is a three dimensional graphic representation was used to determine the indi- vidual and cumulative effect of the variable and the mu- tual interaction between the variable and the dependent Figure 5 shows the effect of Fe(NO3)3 concentration and H2O2 concentration on methomyl removal efficiency. The response surface of methomyl removal efficiency gradually increased with increasing H2O2 concentration from 10–3 mol·L–1 to 10–2 mol·L–1. The maximum value of photo-Fenton degradation determined was 98% at Fe(NO3)3 5 × 10⁻⁴ mol·L–1 and 10–2 mol·L–1 H2O2. This can be explained by the effect of the additionally produced hydroxyl radicals. This may be due to recom- bination of hydroxyl radicals and also hydroxyl radicals reaction with H2O2, contributing to the OH• scavenging capacity (Equations (9)-(11)) [4]. H2O2 + OH• → H2O + (9) 2 HO 2 HO + OH• → H2O+ O2 (10) OH• + OH• → H2O2 (11) Figure 6 shows the effect of Fe(NO3)3 concentration and initial methomyl concentration on methomyl removal Figure 3. Experimental and calculated values for methomyl removal. Copyright © 2012 SciRes. OJAppS 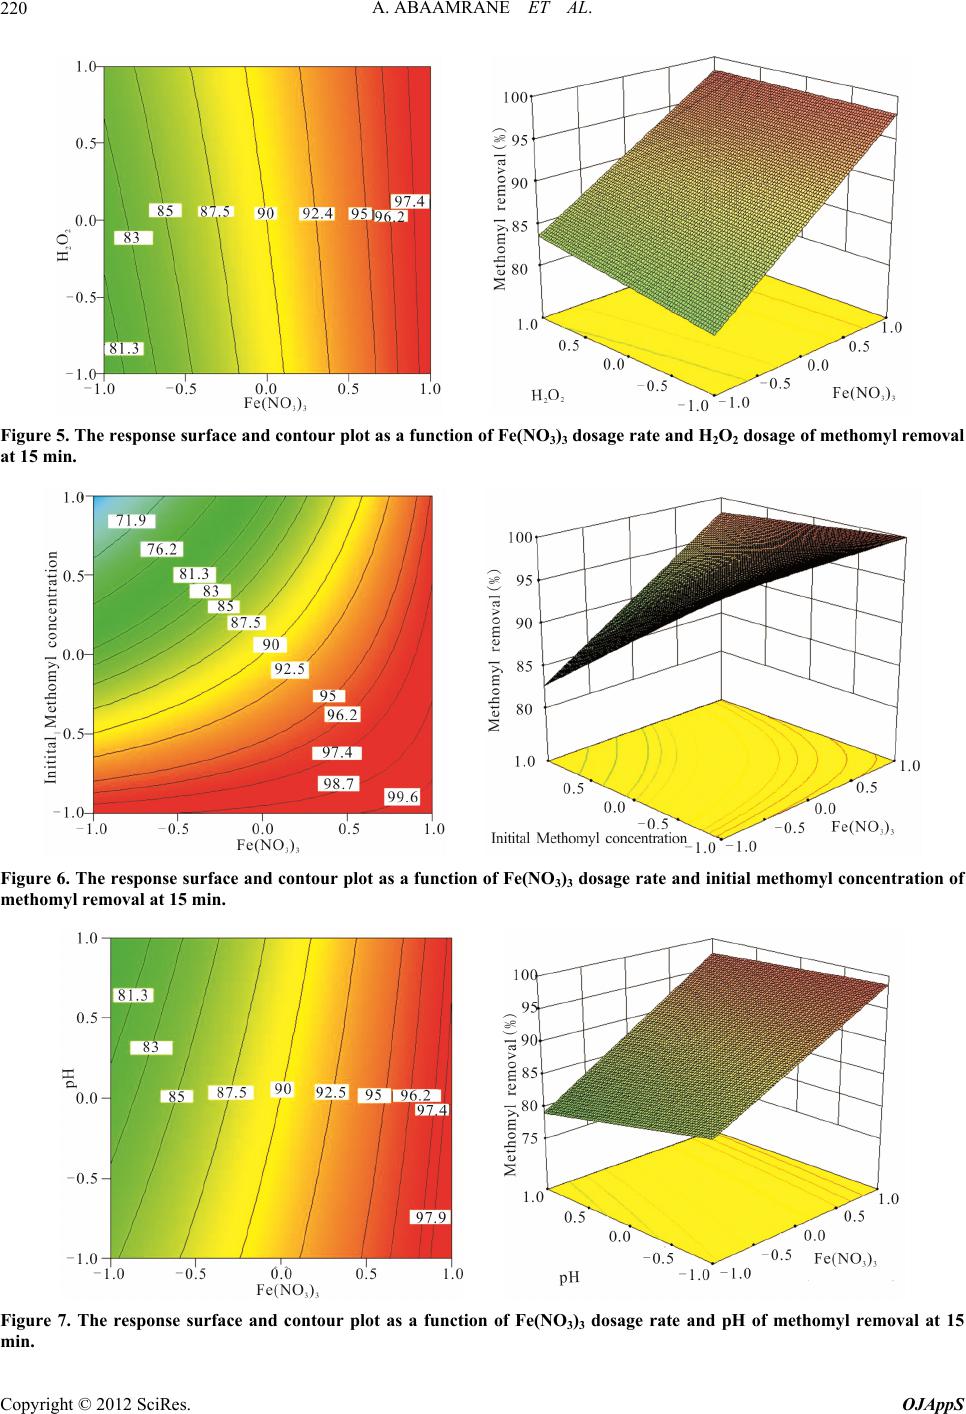 A. ABAAMRANE ET AL. Copyright © 2012 SciRes. OJAppS 220 Figure 5. The response surface and contour plot as a function of Fe(NO3)3 dosage rate and H2O2 dosage of methomyl removal at 15 min. Figure 6. The response surface and contour plot as a function of Fe(NO3)3 dosage rate and initial methomyl concentration of methomyl removal at 15 min. Figure 7. The response surface and contour plot as a function of Fe(NO3)3 dosage rate and pH of methomyl removal at 15 min. 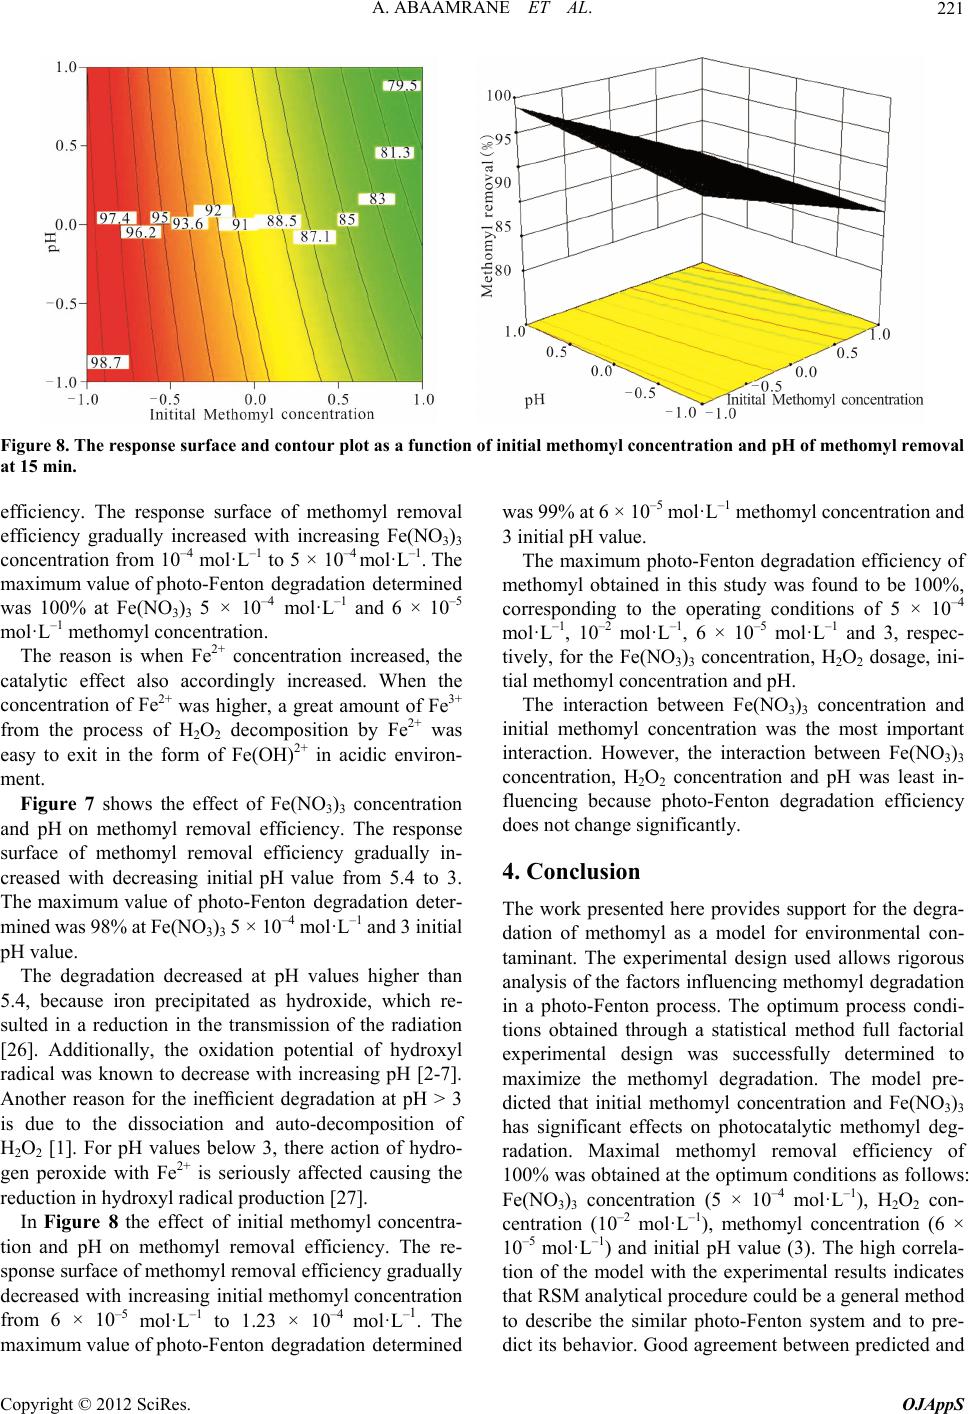 A. ABAAMRANE ET AL. 221 Figure 8. The response surface and contour plot as a function of initial methomyl concentration and pH of methomyl rem oval at 15 min. efficiency. The response surface of methomyl removal efficiency gradually increased with increasing Fe(NO3)3 concentration from 10–4 mol·L–1 to 5 × 10⁻⁴ mol·L–1. The maximum value of photo-Fenton degradation determined was 100% at Fe(NO3)3 5 × 10⁻⁴ mol·L–1 and 6 × 10⁻⁵ mol· L –1 methomyl concentration. The reason is when Fe2+ concentration increased, the catalytic effect also accordingly increased. When the concentration of Fe2+ was higher, a great amount of Fe3+ from the process of H2O2 decomposition by Fe2+ was easy to exit in the form of Fe(OH)2+ in acidic environ- ment. Figure 7 shows the effect of Fe(NO3)3 concentration and pH on methomyl removal efficiency. The response surface of methomyl removal efficiency gradually in- creased with decreasing initial pH value from 5.4 to 3. The maximum value of photo-Fenton degradation deter- mined was 98% at Fe(NO3)3 5 × 10⁻⁴ mol·L–1 and 3 initial pH value. The degradation decreased at pH values higher than 5.4, because iron precipitated as hydroxide, which re- sulted in a reduction in the transmission of the radiation [26]. Additionally, the oxidation potential of hydroxyl radical was known to decrease with increasing pH [2-7]. Another reason for the inefficient degradation at pH > 3 is due to the dissociation and auto-decomposition of H2O2 [1]. For pH values below 3, there action of hydro- gen peroxide with Fe2+ is seriously affected causing the reduction in hydroxyl radical production [27]. In Figure 8 the effect of initial methomyl concentra- tion and pH on methomyl removal efficiency. The re- sponse surface of methomyl removal efficiency gradually decreased with increasing initial methomyl concentration from 6 × 10⁻⁵ mol·L–1 to 1.23 × 10⁻⁴ mol·L–1. The maximum value of photo-Fenton degradation determined was 99% at 6 × 10⁻⁵ mol·L–1 methomyl concentration and 3 initial pH value. The maximum photo-Fenton degradation efficiency of methomyl obtained in this study was found to be 100%, corresponding to the operating conditions of 5 × 10⁻⁴ mol· L –1, 10–2 mol·L–1, 6 × 10⁻⁵ mol·L–1 and 3, respec- tively, for the Fe(NO3)3 concentration, H2O2 dosage, ini- tial methomyl concentration and pH. The interaction between Fe(NO3)3 concentration and initial methomyl concentration was the most important interaction. However, the interaction between Fe(NO3)3 concentration, H2O2 concentration and pH was least in- fluencing because photo-Fenton degradation efficiency does not change significantly. 4. Conclusion The work presented here provides support for the degra- dation of methomyl as a model for environmental con- taminant. The experimental design used allows rigorous analysis of the factors influencing methomyl degradation in a photo-Fenton process. The optimum process condi- tions obtained through a statistical method full factorial experimental design was successfully determined to maximize the methomyl degradation. The model pre- dicted that initial methomyl concentration and Fe(NO3)3 has significant effects on photocatalytic methomyl deg- radation. Maximal methomyl removal efficiency of 100% was obtained at the optimum conditions as follows: Fe(NO3)3 concentration (5 × 10⁻⁴ mol·L–1), H2O2 con- centration (10–2 mol·L–1), methomyl concentration (6 × 10⁻⁵ mol·L–1) and initial pH value (3). The high correla- tion of the model with the experimental results indicates that RSM analytical procedure could be a general method to describe the similar photo-Fenton system and to pre- dict its behavior. Good agreement between predicted and Copyright © 2012 SciRes. OJAppS 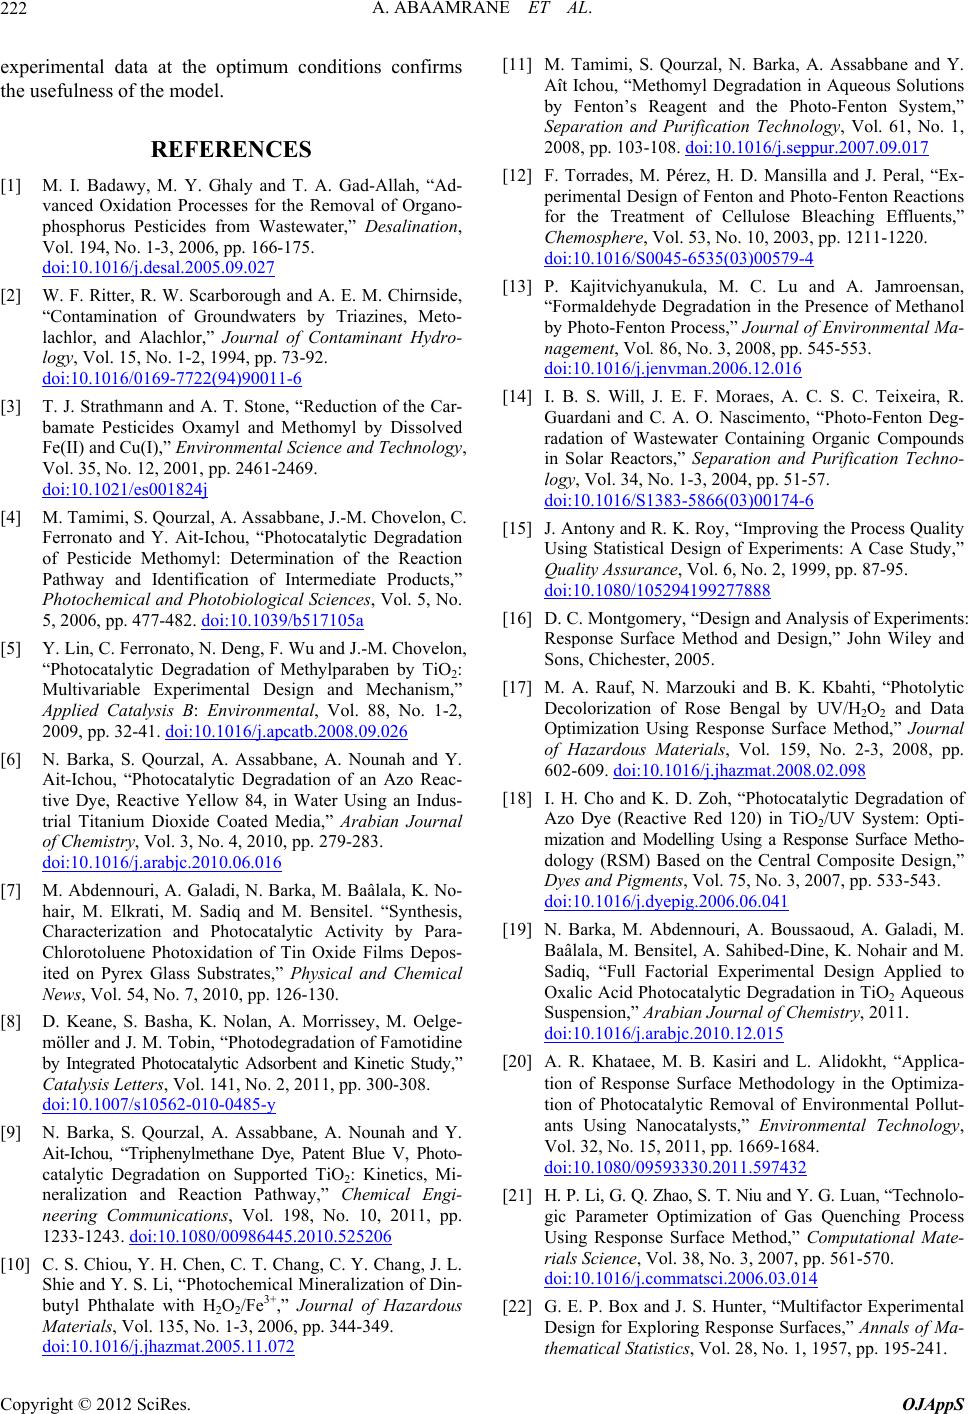 A. ABAAMRANE ET AL. 222 experimental data at the optimum conditions confirms the usefulness of the model. REFERENCES [1] M. I. Badawy, M. Y. Ghaly and T. A. Gad-Allah, “Ad- vanced Oxidation Processes for the Removal of Organo- phosphorus Pesticides from Wastewater,” Desalination, Vol. 194, No. 1-3, 2006, pp. 166-175. doi:10.1016/j.desal.2005.09.027 [2] W. F. Ritter, R. W. Scarborough and A. E. M. Chirnside, “Contamination of Groundwaters by Triazines, Meto- lachlor, and Alachlor,” Journal of Contaminant Hydro- logy, Vol. 15, No. 1-2, 1994, pp. 73-92. doi:10.1016/0169-7722(94)90011-6 [3] T. J. Strathmann and A. T. Stone, “Reduction of the Car- bamate Pesticides Oxamyl and Methomyl by Dissolved Fe(II) and Cu(I),” Environmental Science and Technology, Vol. 35, No. 12, 2001, pp. 2461-2469. doi:10.1021/es001824j [4] M. Tamimi, S. Qourzal, A. Assabbane, J.-M. Chovelon, C. Ferronato and Y. Ait-Ichou, “Photocatalytic Degradation of Pesticide Methomyl: Determination of the Reaction Pathway and Identification of Intermediate Products,” Photochemical and Photobiological Sciences, Vol. 5, No. 5, 2006, pp. 477-482. doi:10.1039/b517105a [5] Y. Lin, C. Ferronato, N. Deng, F. Wu and J.-M. Chovelon, “Photocatalytic Degradation of Methylparaben by TiO2: Multivariable Experimental Design and Mechanism,” Applied Catalysis B: Environmental, Vol. 88, No. 1-2, 2009, pp. 32-41. doi:10.1016/j.apcatb.2008.09.026 [6] N. Barka, S. Qourzal, A. Assabbane, A. Nounah and Y. Ait-Ichou, “Photocatalytic Degradation of an Azo Reac- tive Dye, Reactive Yellow 84, in Water Using an Indus- trial Titanium Dioxide Coated Media,” Arabian Journal of Chemistry, Vol. 3, No. 4, 2010, pp. 279-283. doi:10.1016/j.arabjc.2010.06.016 [7] M. Abdennouri, A. Galadi, N. Barka, M. Baâlala, K. No- hair, M. Elkrati, M. Sadiq and M. Bensitel. “Synthesis, Characterization and Photocatalytic Activity by Para- Chlorotoluene Photoxidation of Tin Oxide Films Depos- ited on Pyrex Glass Substrates,” Physical and Chemical News, Vol. 54, No. 7, 2010, pp. 126-130. [8] D. Keane, S. Basha, K. Nolan, A. Morrissey, M. Oelge- möller and J. M. Tobin, “Photodegradation of Famotidine by Integrated Photocatalytic Adsorbent and Kinetic Study,” Catalysis Letters, Vol. 141, No. 2, 2011, pp. 300-308. doi:10.1007/s10562-010-0485-y [9] N. Barka, S. Qourzal, A. Assabbane, A. Nounah and Y. Ait-Ichou, “Triphenylmethane Dye, Patent Blue V, Photo- catalytic Degradation on Supported TiO2: Kinetics, Mi- neralization and Reaction Pathway,” Chemical Engi- neering Communications, Vol. 198, No. 10, 2011, pp. 1233-1243. doi:10.1080/00986445.2010.525206 [10] C. S. Chiou, Y. H. Chen, C. T. Chang, C. Y. Chang, J. L. Shie and Y. S. Li, “Photochemical Mineralization of Din- butyl Phthalate with H2O2/Fe3+,” Journal of Hazardous Materials, Vol. 135, No. 1-3, 2006, pp. 344-349. doi:10.1016/j.jhazmat.2005.11.072 [11] M. Tamimi, S. Qourzal, N. Barka, A. Assabbane and Y. Aît Ichou, “Methomyl Degradation in Aqueous Solutions by Fenton’s Reagent and the Photo-Fenton System,” Separation and Purification Technology, Vol. 61, No. 1, 2008, pp. 103-108. doi:10.1016/j.seppur.2007.09.017 [12] F. Torrades, M. Pérez, H. D. Mansilla and J. Peral, “Ex- perimental Design of Fenton and Photo-Fenton Reactions for the Treatment of Cellulose Bleaching Effluents,” Chemosphere, Vol. 53, No. 10, 2003, pp. 1211-1220. doi:10.1016/S0045-6535(03)00579-4 [13] P. Kajitvichyanukula, M. C. Lu and A. Jamroensan, “Formaldehyde Degradation in the Presence of Methanol by Photo-Fenton Process,” Journal of Environmental Ma- nagement, Vol. 86, No. 3, 2008, pp. 545-553. doi:10.1016/j.jenvman.2006.12.016 [14] I. B. S. Will, J. E. F. Moraes, A. C. S. C. Teixeira, R. Guardani and C. A. O. Nascimento, “Photo-Fenton Deg- radation of Wastewater Containing Organic Compounds in Solar Reactors,” Separation and Purification Techno- logy, Vol. 34, No. 1-3, 2004, pp. 51-57. doi:10.1016/S1383-5866(03)00174-6 [15] J. Antony and R. K. Roy, “Improving the Process Quality Using Statistical Design of Experiments: A Case Study,” Quality Assurance, Vol. 6, No. 2, 1999, pp. 87-95. doi:10.1080/105294199277888 [16] D. C. Montgomery, “Design and Analysis of Experiments: Response Surface Method and Design,” John Wiley and Sons, Chichester, 2005. [17] M. A. Rauf, N. Marzouki and B. K. Kbahti, “Photolytic Decolorization of Rose Bengal by UV/H2O2 and Data Optimization Using Response Surface Method,” Journal of Hazardous Materials, Vol. 159, No. 2-3, 2008, pp. 602-609. doi:10.1016/j.jhazmat.2008.02.098 [18] I. H. Cho and K. D. Zoh, “Photocatalytic Degradation of Azo Dye (Reactive Red 120) in TiO2/UV System: Opti- mization and Modelling Using a Response Surface Metho- dology (RSM) Based on the Central Composite Design,” Dyes and Pigments, Vol. 75, No. 3, 2007, pp. 533-543. doi:10.1016/j.dyepig.2006.06.041 [19] N. Barka, M. Abdennouri, A. Boussaoud, A. Galadi, M. Baâlala, M. Bensitel, A. Sahibed-Dine, K. Nohair and M. Sadiq, “Full Factorial Experimental Design Applied to Oxalic Acid Photocatalytic Degradation in TiO2 Aqueous Suspension,” Arabian Journal of Chemistry, 2011. doi:10.1016/j.arabjc.2010.12.015 [20] A. R. Khataee, M. B. Kasiri and L. Alidokht, “Applica- tion of Response Surface Methodology in the Optimiza- tion of Photocatalytic Removal of Environmental Pollut- ants Using Nanocatalysts,” Environmental Technology, Vol. 32, No. 15, 2011, pp. 1669-1684. doi:10.1080/09593330.2011.597432 [21] H. P. Li, G. Q. Zhao, S. T. Niu and Y. G. Luan, “Technolo- gic Parameter Optimization of Gas Quenching Process Using Response Surface Method,” Computational Mate- rials Science, Vol. 38, No. 3, 2007, pp. 561-570. doi:10.1016/j.commatsci.2006.03.014 [22] G. E. P. Box and J. S. Hunter, “Multifactor Experimental Design for Exploring Response Surfaces,” Annals of Ma- thematical Statistics, Vol. 28, No. 1, 1957, pp. 195-241. Copyright © 2012 SciRes. OJAppS  A. ABAAMRANE ET AL. Copyright © 2012 SciRes. OJAppS 223 doi:10.1214/aoms/1177707047 [23] R. H. Myers and D. C. Montgomery, “Response Surface Methodology: Process and Product Optimization Using Designed Experiments,” John Wiley and Sons, New York, 2002. [24] J. F. Fu, Y. Q. Zhao and Q. L. Wu, “Optimising Photo- electrocatalytic Oxidation of Fulvic Acid Using Response Surface Methodology,” Journal of Hazardous Materials, Vol. 144, No. 1-2, 2007, pp. 499-505. doi:10.1016/j.jhazmat.2006.10.071 [25] K. Ravikumar, S. Krishnan, S. Ramalingam and K. Balu, “Optimization of Process Variables by the Application of Response Surface Methodology for Dye Removal Using a Novel Adsorbent,” Dyes and Pigments, Vol. 72, No. 1, 2007, pp. 66-74. doi:10.1016/j.dyepig.2005.07.018 [26] B. C. Faust and J. Hoigne, “Photolysis of Fe(III)-Hy- droxyl Complexes as Sources of OH Radicals in Clouds, Fog and Rain,” Atmospheric Environment, Vol. 24, No. 1, 1990, pp. 79-89. doi:10.1016/0960-1686(90)90443-Q [27] M. S. Lucas and J. A. Peres, “Decolorization of the Azo Dye Reactive Black 5 by Fenton and Photo-Fenton Oxi- dation,” Dyes and Pigments, Vol. 71, No. 3, 2006, pp. 236-244. doi:10.1016/j.dyepig.2005.07.007 |