

Paper Menu >>
Journal Menu >>
 Journal of Minerals and Materials Characterization and Engineering, 2012, 11, 1101-1107 Published Online November 2012 (http://www.SciRP.org/journal/jmmce) Characterization and Application of Naturally Occurring Mineral Based Pigment in Surface Coating Shweta Umale, Prakash Mahanwar Department of Polymer and Surface Engineering, Institute of Chemical Technology, Mumbai, India Email: [email protected] Received July 8, 2012; revised August 13, 2012; accepted August 27, 2012 ABSTRACT New naturally occurring mineral based pigment of general formula Hg2S have been processed and characterized for its application in surface coating. Various analytical protocol like XRD, FT-IR, SEM and CIE 1976 colour coordinate sys- tem have been performed for complete analysis of pigment. Characterizations using XRD, and CIE 1976 colour coor- dinate assessment reveal the formation of pigments displaying colours ranging from brick-red to dark-brown. The typi- cal designed pigment samples have been evaluated for their mass tone/hiding power, tinting strength and weather resis- tance by coating on an MS steel panel. Optical, Chemical, Mechanical and performance properties of coating have been evaluated for its application. The results demonstrated that the dark-brown pigment obtained in the present study was found to be an interesting alternative to the existing classical toxic inorganic red pigments for surface coating applica- tions. Keywords: Light Fastness; Colour Value; Surface Coating; Dispersability; Refractive Index 1. Introduction Natural inorganic pigments have been known since pre- historic times, for example the drawings in the Pech- Merle caves in the south of France, Northern Spain, and Northern Africa were made with charcoal, ochre, man- ganese brown and clays [1,2]. About 2000 BC, natural ochre was burnt, sometimes in mixtures with manganese ores, to produce red, violet, and black pigments for pot- tery [3]. Arsenic sulphide and Naples yellow (a lead an- timonate) were the first clear yellow pigments. Ultrama- rine and artificial lapis lazuli (Egyptian blue and cobalt aluminium spinel) were the first blue pigments [4]. Cinnabar is red color pigment which can be largely used in surface coating application but there is large con- troversy on utilization of mercury containing pigment. But Mercury in traditional Chinese medicines mainly comes from cinnabar, deliberately included for therapeutic pur- poses based on Pharmacopeia of China [5]. Chinese Mi- nistry of Health has paid close attention to the mercury contents in traditional Chinese remedies. The allowable amounts of cinnabar in these preparations have been de- creased by as much as 65%, from a daily allowable dose of 0.3 - 1.5 g in the 1977 Pharmacopeia to 0.1 - 0.5 g in the 2005 Pharmacopeia of China [6], but the mercury in these traditional medicines can still be thousands-folds higher than what is considered safe in Western countries including the USA The analysis showed that cinnabar is insoluble and poorly absorbed from the gastrointestinal tract [7-10]. Absorbed mercury from cinnabar is mainly accumulated in the kidneys, resembling the disposition pattern of inorganic mercury [11-13]. Use of inorganic pigments are paints, plastics, printing inks for paper and textiles, leather decoration, building materials, floor coverings, rubber, cosmetics, ceramic glazes and enamels. When choosing a pigment for a par- ticular application, several points normally have to be considered [14-16]. The coloring properties are important in determining the application efficiency and hence eco- nomics. The following properties are also important: 1) General chemical and physical properties: Chemi- cal composition, moisture and salt content, content of wa- ter soluble and acid soluble matter, particle size, density and hardness. 2) Stability properties: Resistance towards light, wea- ther, heat and chemicals, anticorrosive properties and re- tention of gloss. 3) Behaviour in binders: Interaction with the binder properties, Dispersability, compatibility and solidifying effect. So the main objectives of this study was 1) To process and characterize mineral based pigment collected from geographical place. 2) To study physico-chemical properties of the pig- ment. 3) To formulate paint by using same pigment and to study performance properties of the pigment. Copyright © 2012 SciRes. JMMCE 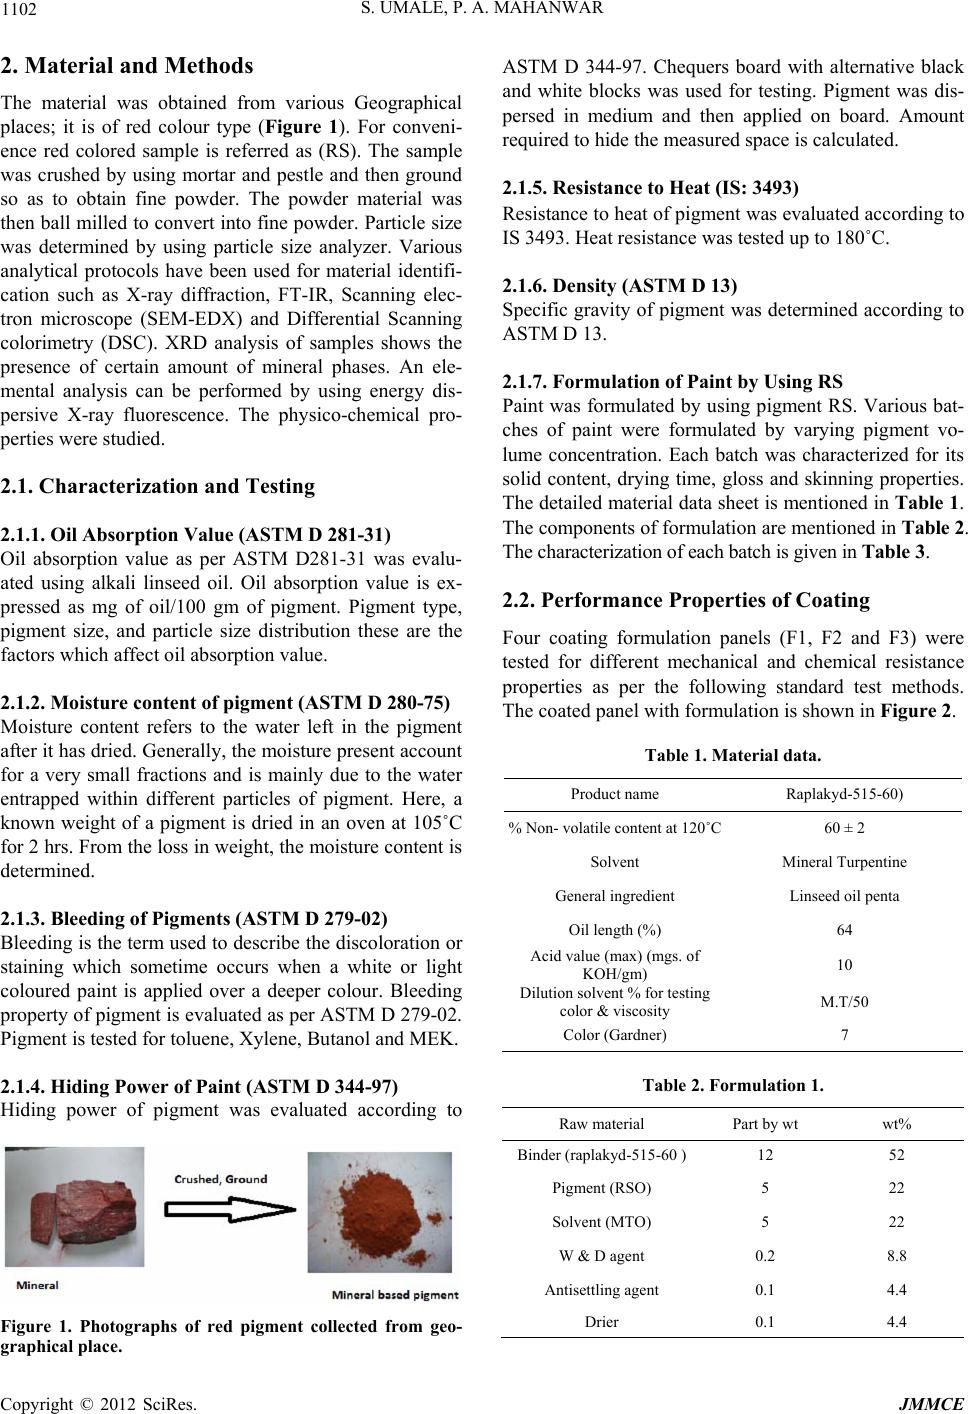 S. UMALE, P. A. MAHANWAR 1102 2. Material and Methods The material was obtained from various Geographical places; it is of red colour type (Figure 1). For conveni- ence red colored sample is referred as (RS). The sample was crushed by using mortar and pestle and then ground so as to obtain fine powder. The powder material was then ball milled to convert into fine powder. Particle size was determined by using particle size analyzer. Various analytical protocols have been used for material identifi- cation such as X-ray diffraction, FT-IR, Scanning elec- tron microscope (SEM-EDX) and Differential Scanning colorimetry (DSC). XRD analysis of samples shows the presence of certain amount of mineral phases. An ele- mental analysis can be performed by using energy dis- persive X-ray fluorescence. The physico-chemical pro- perties were studied. 2.1. Characterization and Testing 2.1.1. Oil Absorption Value (ASTM D 281-31) Oil absorption value as per ASTM D281-31 was evalu- ated using alkali linseed oil. Oil absorption value is ex- pressed as mg of oil/100 gm of pigment. Pigment type, pigment size, and particle size distribution these are the factors which affect oil absorption value. 2.1.2. Moisture content of pigment (ASTM D 280-7 5 ) Moisture content refers to the water left in the pigment after it has dried. Generally, the moisture present account for a very small fractions and is mainly due to the water entrapped within different particles of pigment. Here, a known weight of a pigment is dried in an oven at 105˚C for 2 hrs. From the loss in weight, the moisture content is determined. 2.1.3. Bleedi ng of Pigme n ts (ASTM D 279-02) Bleeding is the term used to describe the discoloration or staining which sometime occurs when a white or light coloured paint is applied over a deeper colour. Bleeding property of pigment is evaluated as per ASTM D 279-02. Pigment is tested for toluene, Xylene, Butanol and MEK. 2.1.4. Hiding Power of Paint (AST M D 344-97) Hiding power of pigment was evaluated according to Figure 1. Photographs of red pigment collected from geo- graphical place. ASTM D 344-97. Chequers board with alternative black and white blocks was used for testing. Pigment was dis- persed in medium and then applied on board. Amount required to hide the measured space is calculated. 2.1.5. Resistance to Heat (IS: 3493) Resistance to heat of pigment was evaluated according to IS 3493. Heat resistance was tested up to 180˚C. 2.1.6. Density (AST M D 1 3) Specific gravity of pigment was determined according to ASTM D 13. 2.1.7. Formulation of Paint by Usi ng RS Paint was formulated by using pigment RS. Various bat- ches of paint were formulated by varying pigment vo- lume concentration. Each batch was characterized for its solid content, drying time, gloss and skinning properties. The detailed material data sheet is mentioned in Table 1 . The components of formulation are mentioned in Table 2. The characterization of each batch is given in Table 3. 2.2. Performance Properties of Coating Four coating formulation panels (F1, F2 and F3) were tested for different mechanical and chemical resistance properties as per the following standard test methods. The coated panel with formulation is shown in Figure 2. Table 1. Material data. Product name Raplakyd-515-60) % Non- volatile content at 120˚C60 ± 2 Solvent Mineral Turpentine General ingredient Linseed oil penta Oil length (%) 64 Acid value (max) (mgs. of KOH/gm) 10 Dilution solvent % for testing color & viscosity M.T/50 Color (Gardner) 7 Table 2. Formulation 1. Raw material Part by wt wt% Binder (raplakyd-515-60 )12 52 Pigment (RSO) 5 22 Solvent (MTO) 5 22 W & D agent 0.2 8.8 Antisettling agent 0.1 4.4 Drier 0.1 4.4 Copyright © 2012 SciRes. JMMCE 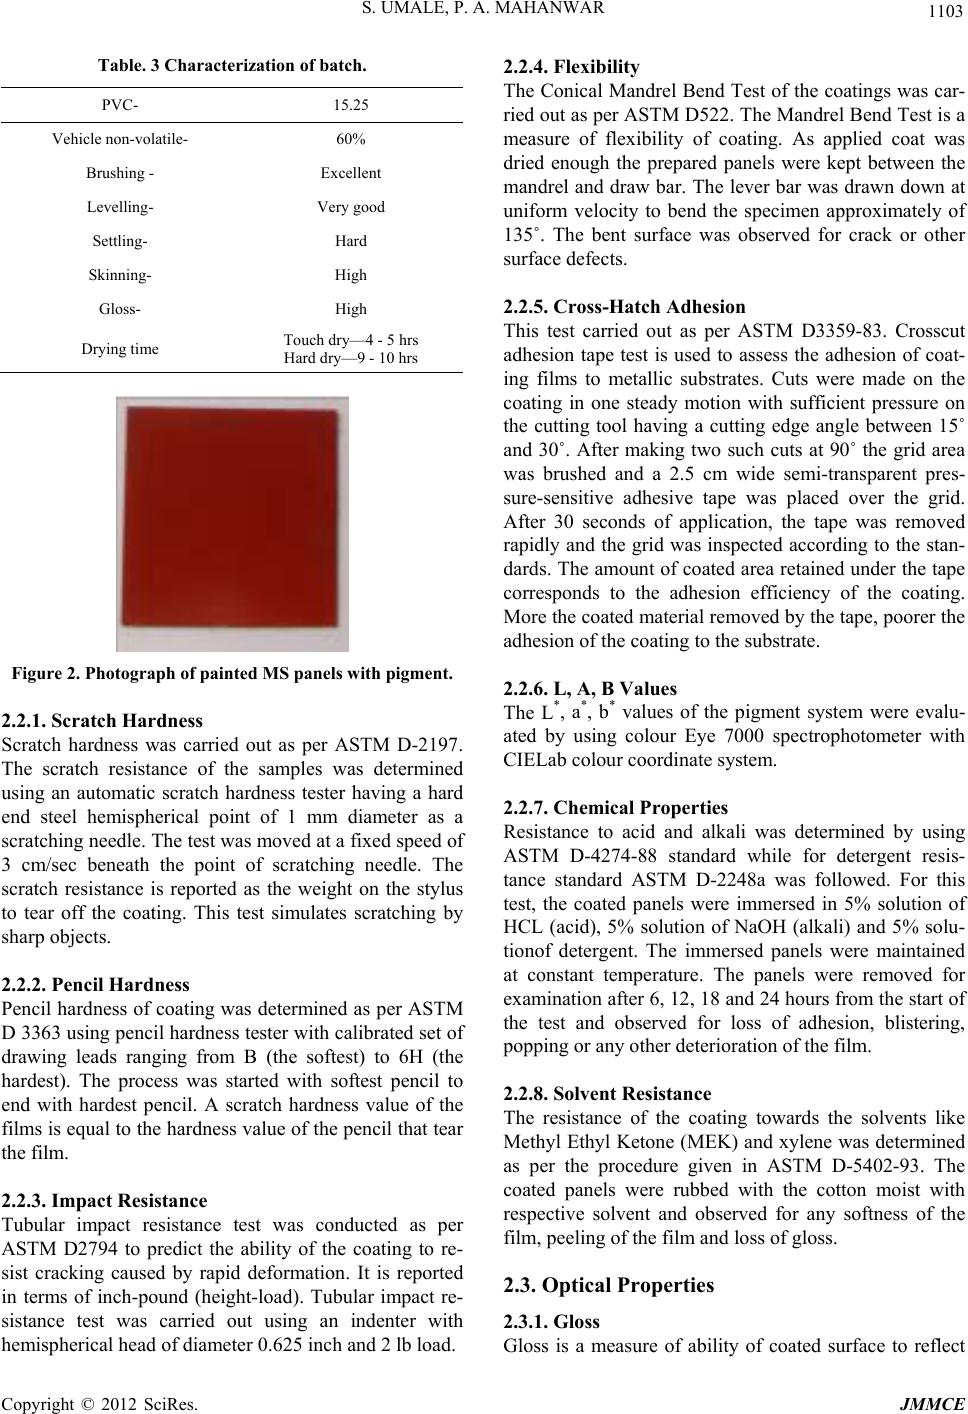 S. UMALE, P. A. MAHANWAR 1103 Table. 3 Characterization of batch. PVC- 15.25 Vehicle non-volatile- 60% Brushing - Excellent Levelling- Very good Settling- Hard Skinning- High Gloss- High Drying time Touch dry—4 - 5 hrs Hard dry—9 - 10 hrs Figure 2. Photograph of painted MS panels with pigment. 2.2.1. Sc r atch Hardness Scratch hardness was carried out as per ASTM D-2197. The scratch resistance of the samples was determined using an automatic scratch hardness tester having a hard end steel hemispherical point of 1 mm diameter as a scratching needle. The test was moved at a fixed speed of 3 cm/sec beneath the point of scratching needle. The scratch resistance is reported as the weight on the stylus to tear off the coating. This test simulates scratching by sharp objects. 2.2.2. Pe n cil Hardness Pencil hardness of coating was determined as per ASTM D 3363 using pencil hardness tester with calibrated set of drawing leads ranging from B (the softest) to 6H (the hardest). The process was started with softest pencil to end with hardest pencil. A scratch hardness value of the films is equal to the hardness value of the pencil that tear the film. 2.2.3. Impact Resistance Tubular impact resistance test was conducted as per ASTM D2794 to predict the ability of the coating to re- sist cracking caused by rapid deformation. It is reported in terms of inch-pound (height-load). Tubular impact re- sistance test was carried out using an indenter with hemispherical head of diameter 0.625 inch and 2 lb load. 2.2.4. Flexibility The Conical Mandrel Bend Test of the coatings was car- ried out as per ASTM D522. The Mandrel Bend Test is a measure of flexibility of coating. As applied coat was dried enough the prepared panels were kept between the mandrel and draw bar. The lever bar was drawn down at uniform velocity to bend the specimen approximately of 135˚. The bent surface was observed for crack or other surface defects. 2.2.5. Cross-Hatch Adhesi on This test carried out as per ASTM D3359-83. Crosscut adhesion tape test is used to assess the adhesion of coat- ing films to metallic substrates. Cuts were made on the coating in one steady motion with sufficient pressure on the cutting tool having a cutting edge angle between 15˚ and 30˚. After making two such cuts at 90˚ the grid area was brushed and a 2.5 cm wide semi-transparent pres- sure-sensitive adhesive tape was placed over the grid. After 30 seconds of application, the tape was removed rapidly and the grid was inspected according to the stan- dards. The amount of coated area retained under the tape corresponds to the adhesion efficiency of the coating. More the coated material removed by the tape, poorer the adhesion of the coating to the substrate. 2.2.6. L, A, B Values The L*, a*, b* values of the pigment system were evalu- ated by using colour Eye 7000 spectrophotometer with CIELab colour coordinate system. 2.2.7. Chemical Properties Resistance to acid and alkali was determined by using ASTM D-4274-88 standard while for detergent resis- tance standard ASTM D-2248a was followed. For this test, the coated panels were immersed in 5% solution of HCL (acid), 5% solution of NaOH (alkali) and 5% solu- tionof detergent. The immersed panels were maintained at constant temperature. The panels were removed for examination after 6, 12, 18 and 24 hours from the start of the test and observed for loss of adhesion, blistering, popping or any other deterioration of the film. 2.2.8. So lvent Res istance The resistance of the coating towards the solvents like Methyl Ethyl Ketone (MEK) and xylene was determined as per the procedure given in ASTM D-5402-93. The coated panels were rubbed with the cotton moist with respective solvent and observed for any softness of the film, peeling of the film and loss of gloss. 2.3. Optical Properties 2.3.1. Glos s Gloss is a measure of ability of coated surface to reflect Copyright © 2012 SciRes. JMMCE 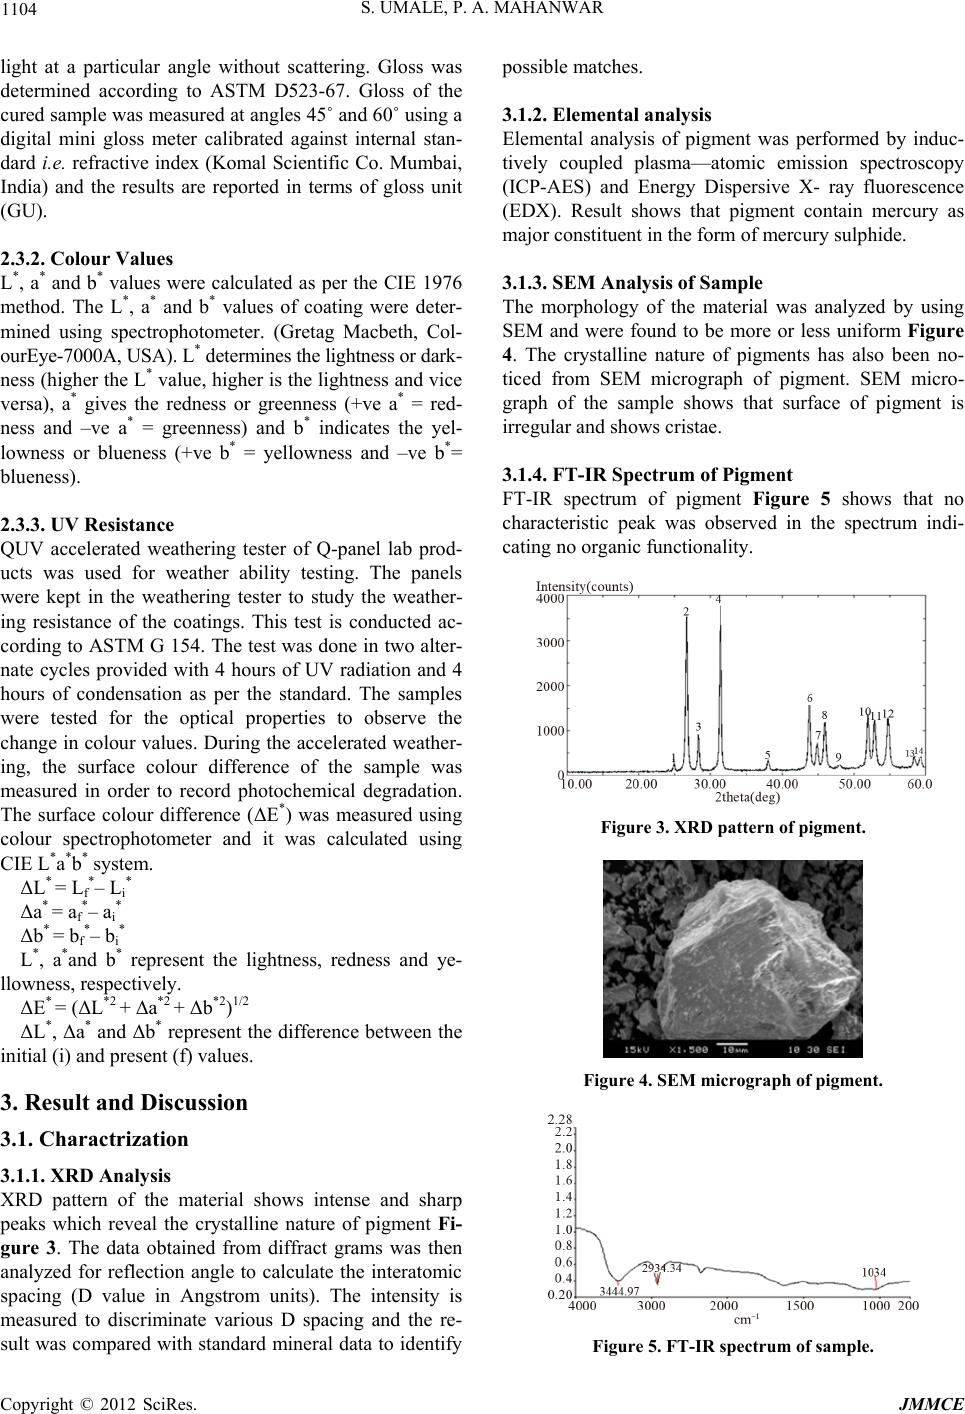 S. UMALE, P. A. MAHANWAR 1104 light at a particular angle without scattering. Gloss was determined according to ASTM D523-67. Gloss of the cured sample was measured at angles 45˚ and 60˚ using a digital mini gloss meter calibrated against internal stan- dard i.e. refractive index (Komal Scientific Co. Mumbai, India) and the results are reported in terms of gloss unit (GU). 2.3.2. Colour Values L*, a* and b* values were calculated as per the CIE 1976 method. The L*, a* and b* values of coating were deter- mined using spectrophotometer. (Gretag Macbeth, Col- ourEye-7000A, USA). L* determines the lightness or dark- ness (higher the L* value, higher is the lightness and vice versa), a* gives the redness or greenness (+ve a* = red- ness and –ve a* = greenness) and b* indicates the yel- lowness or blueness (+ve b* = yellowness and –ve b*= blueness). 2.3.3. UV Resistan c e QUV accelerated weathering tester of Q-panel lab prod- ucts was used for weather ability testing. The panels were kept in the weathering tester to study the weather- ing resistance of the coatings. This test is conducted ac- cording to ASTM G 154. The test was done in two alter- nate cycles provided with 4 hours of UV radiation and 4 hours of condensation as per the standard. The samples were tested for the optical properties to observe the change in colour values. During the accelerated weather- ing, the surface colour difference of the sample was measured in order to record photochemical degradation. The surface colour difference (ΔE*) was measured using colour spectrophotometer and it was calculated using CIE L*a*b* system. ΔL* = Lf *– Li * Δa* = af *– ai * Δb* = bf *– bi * L*, a*and b* represent the lightness, redness and ye- llowness, respectively. ΔE* = (ΔL*2 + Δa*2 + Δb*2)1/2 ΔL*, Δa* and Δb* represent the difference between the initial (i) and present (f) values. 3. Result and Discussion 3.1. Charactrization 3.1.1. XRD Analysi s XRD pattern of the material shows intense and sharp peaks which reveal the crystalline nature of pigment Fi- gure 3. The data obtained from diffract grams was then analyzed for reflection angle to calculate the interatomic spacing (D value in Angstrom units). The intensity is measured to discriminate various D spacing and the re- sult was compared with standard mineral data to identify possible matches. 3.1.2. Elemental analysis Elemental analysis of pigment was performed by induc- tively coupled plasma—atomic emission spectroscopy (ICP-AES) and Energy Dispersive X- ray fluorescence (EDX). Result shows that pigment contain mercury as major constituent in the form of mercury sulphide. 3.1.3. SEM Analysis of Sample The morphology of the material was analyzed by using SEM and were found to be more or less uniform Figure 4. The crystalline nature of pigments has also been no- ticed from SEM micrograph of pigment. SEM micro- graph of the sample shows that surface of pigment is irregular and shows cristae. 3.1.4. FT-IR Spectrum of Pigment FT-IR spectrum of pigment Figure 5 shows that no characteristic peak was observed in the spectrum indi- cating no organic functionality. Figure 3. XRD pattern of pigment. Figure 4. SEM micrograph of pigment. Figure 5. FT-IR spectrum of sample. Copyright © 2012 SciRes. JMMCE 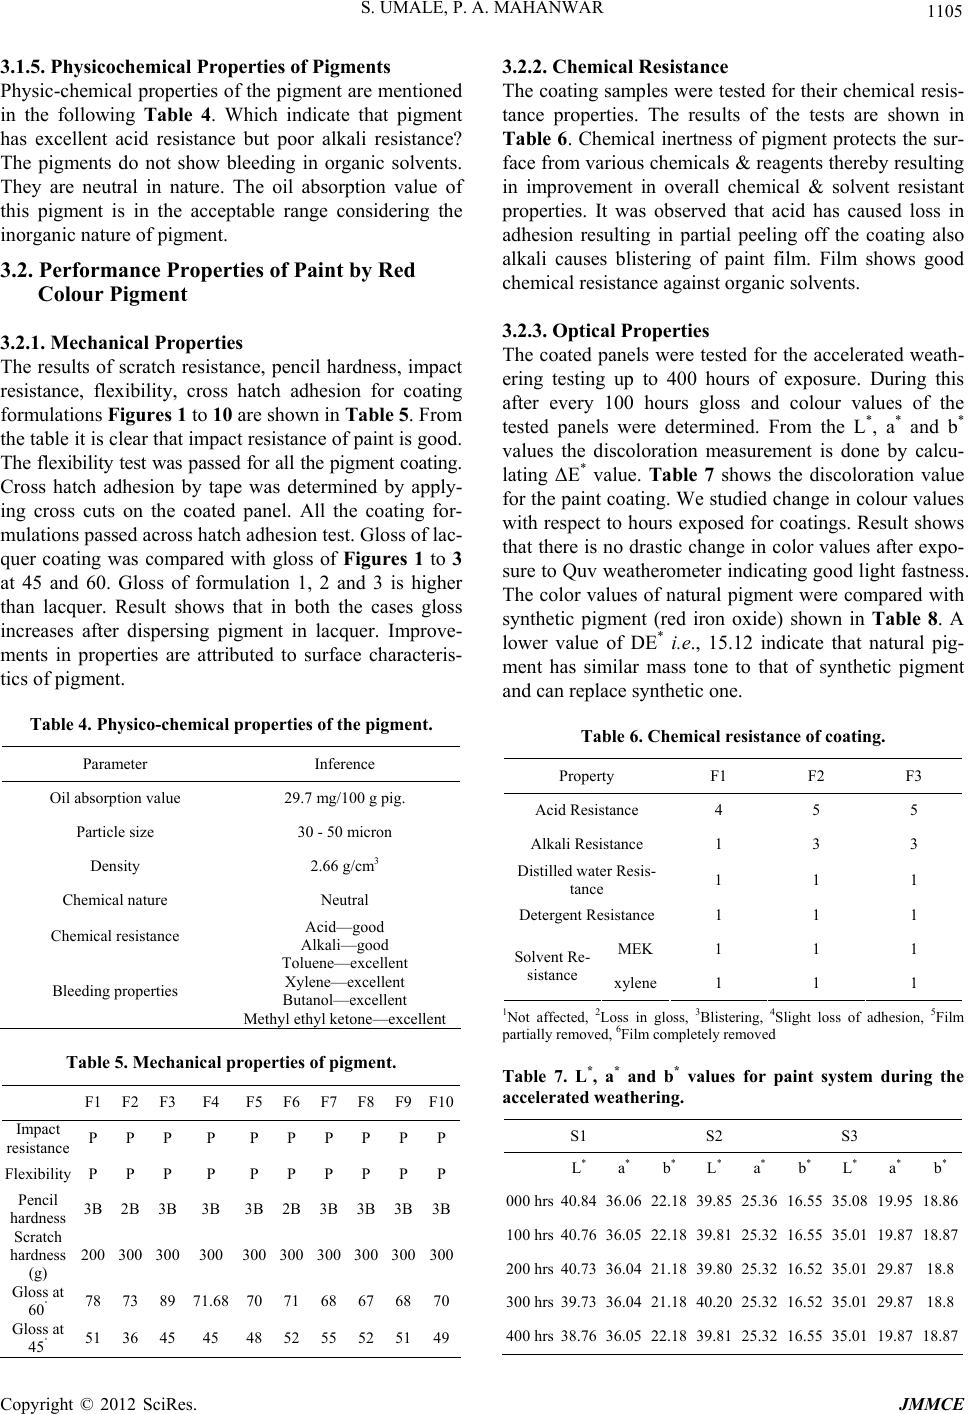 S. UMALE, P. A. MAHANWAR 1105 3.1.5. Physicochemical Properties of Pigments Physic-chemical properties of the pigment are mentioned in the following Table 4. Which indicate that pigment has excellent acid resistance but poor alkali resistance? The pigments do not show bleeding in organic solvents. They are neutral in nature. The oil absorption value of this pigment is in the acceptable range considering the inorganic nature of pigment. 3.2. Performance Properties of Paint by Red Colour Pigment 3.2.1. Mechanic al Properties The results of scratch resistance, pencil hardness, impact resistance, flexibility, cross hatch adhesion for coating formulations Figures 1 to 10 are shown in Ta ble 5. From the table it is clear that impact resistance of paint is good. The flexibility test was passed for all the pigment coating. Cross hatch adhesion by tape was determined by apply- ing cross cuts on the coated panel. All the coating for- mulations passed across hatch adhesion test. Gloss of lac- quer coating was compared with gloss of Figures 1 to 3 at 45 and 60. Gloss of formulation 1, 2 and 3 is higher than lacquer. Result shows that in both the cases gloss increases after dispersing pigment in lacquer. Improve- ments in properties are attributed to surface characteris- tics of pigment. Table 4. Physico-chemical properties of the pigment. Parameter Inference Oil absorption value 29.7 mg/100 g pig. Particle size 30 - 50 micron Density 2.66 g/cm3 Chemical nature Neutral Chemical resistance Acid—good Alkali—good Bleeding properties Toluene—excellent Xylene—excellent Butanol—excellent Methyl ethyl ketone—excellent Table 5. Mechanical properties of pigment. F1 F2 F3 F4 F5 F6 F7 F8 F9F10 Impact resistance P P P P P P P P P P Flexibility P P P P P P P P PP Pencil hardness 3B 2B 3B 3B 3B 2B 3B 3B 3B 3B Scratch hardness (g) 200 300 300 300 300 300 300 300 300 300 Gloss at 60˚ 78 73 89 71.68 70 71 68 67 6870 Gloss at 45˚ 51 36 45 45 48 52 55 52 51 49 3.2.2. Chemical Resistance The coating samples were tested for their chemical resis- tance properties. The results of the tests are shown in Table 6. Chemical inertness of pigment protects the sur- face from various chemicals & reagents thereby resulting in improvement in overall chemical & solvent resistant properties. It was observed that acid has caused loss in adhesion resulting in partial peeling off the coating also alkali causes blistering of paint film. Film shows good chemical resistance against organic solvents. 3.2.3. Optical Pro perties The coated panels were tested for the accelerated weath- ering testing up to 400 hours of exposure. During this after every 100 hours gloss and colour values of the tested panels were determined. From the L*, a* and b* values the discoloration measurement is done by calcu- lating ΔE* value. Table 7 shows the discoloration value for the paint coating. We studied change in colour values with respect to hours exposed for coatings. Result shows that there is no drastic change in color values after expo- sure to Quv weatherometer indicating good light fastness. The color values of natural pigment were compared with synthetic pigment (red iron oxide) shown in Table 8. A lower value of DE* i.e., 15.12 indicate that natural pig- ment has similar mass tone to that of synthetic pigment and can replace synthetic one. Table 6. Chemical resistance of coating. Property F1 F2 F3 Acid Resistance 4 5 5 Alkali Resistance 1 3 3 Distilled water Resis- tance 1 1 1 Detergent Resistance1 1 1 MEK 1 1 1 Solvent Re- sistance xylene1 1 1 1Not affected, 2Loss in gloss, 3Blistering, 4Slight loss of adhesion, 5Film partially removed, 6Film completely removed Table 7. L*, a* and b* values for paint system during the accelerated weathering. S1 S2 S3 L *a* b * L *a* b * L * a * b * 000 hrs40.84 36.06 22.1839.85 25.36 16.55 35.08 19.95 18.86 100 hrs40.76 36.05 22.1839.81 25.32 16.55 35.01 19.87 18.87 200 hrs40.73 36.04 21.1839.80 25.32 16.52 35.01 29.8718.8 300 hrs39.73 36.04 21.1840.20 25.32 16.52 35.01 29.8718.8 400 hrs38.76 36.05 22.1839.81 25.32 16.55 35.01 19.87 18.87 Copyright © 2012 SciRes. JMMCE 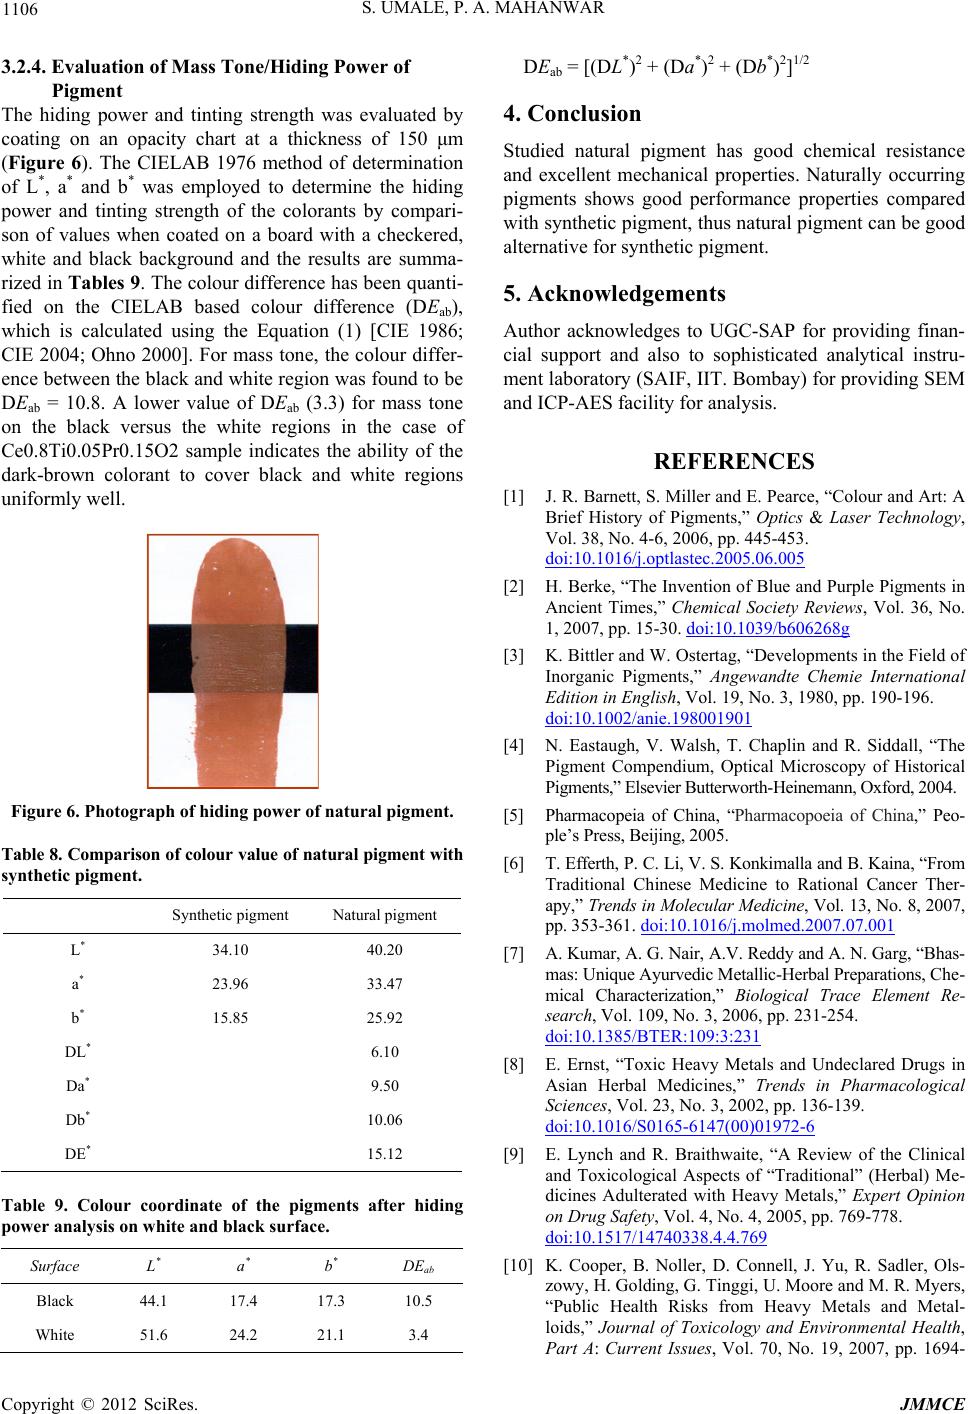 S. UMALE, P. A. MAHANWAR 1106 3.2.4. Eval ua ti on of Mass To ne/ Hi di ng Power of Pigment The hiding power and tinting strength was evaluated by coating on an opacity chart at a thickness of 150 μm (Figure 6). The CIELAB 1976 method of determination of L*, a* and b* was employed to determine the hiding power and tinting strength of the colorants by compari- son of values when coated on a board with a checkered, white and black background and the results are summa- rized in Tables 9. The colour difference has been quanti- fied on the CIELAB based colour difference (DEab), which is calculated using the Equation (1) [CIE 1986; CIE 2004; Ohno 2000]. For mass tone, the colour differ- ence between the black and white region was found to be DEab = 10.8. A lower value of DEab (3.3) for mass tone on the black versus the white regions in the case of Ce0.8Ti0.05Pr0.15O2 sample indicates the ability of the dark-brown colorant to cover black and white regions uniformly well. Figure 6. Photograph of hiding power of natur al pigme nt. Table 8. Comparison of c olour value of nat ural pigment with synthetic pigment. Synthetic pigment Natural pigment L* 34.10 40.20 a* 23.96 33.47 b* 15.85 25.92 DL* 6.10 Da* 9.50 Db* 10.06 DE* 15.12 Table 9. Colour coordinate of the pigments after hiding power analysis on white and black surface. Surface L* a * b * DEab Black 44.1 17.4 17.3 10.5 White 51.6 24.2 21.1 3.4 DEab = [(DL*)2 + (Da*)2 + (Db*)2]1/2 4. Conclusion Studied natural pigment has good chemical resistance and excellent mechanical properties. Naturally occurring pigments shows good performance properties compared with synthetic pigment, thus natural pigment can be good alternative for synthetic pigment. 5. Acknowledgements Author acknowledges to UGC-SAP for providing finan- cial support and also to sophisticated analytical instru- ment laboratory (SAIF, IIT. Bombay) for providing SEM and ICP-AES facility for analysis. REFERENCES [1] J. R. Barnett, S. Miller and E. Pearce, “Colour and Art: A Brief History of Pigments,” Optics & Laser Technology, Vol. 38, No. 4-6, 2006, pp. 445-453. doi:10.1016/j.optlastec.2005.06.005 [2] H. Berke, “The Invention of Blue and Purple Pigments in Ancient Times,” Chemical Society Reviews, Vol. 36, No. 1, 2007, pp. 15-30. doi:10.1039/b606268g [3] K. Bittler and W. Ostertag, “Developments in the Field of Inorganic Pigments,” Angewandte Chemie International Edition in English, Vol. 19, No. 3, 1980, pp. 190-196. doi:10.1002/anie.198001901 [4] N. Eastaugh, V. Walsh, T. Chaplin and R. Siddall, “The Pigment Compendium, Optical Microscopy of Historical Pigments,” Elsevier Butterworth-Heinemann, Oxford, 2004. [5] Pharmacopeia of China, “Pharmacopoeia of China,” Peo- ple’s Press, Beijing, 2005. [6] T. Efferth, P. C. Li, V. S. Konkimalla and B. Kaina, “From Traditional Chinese Medicine to Rational Cancer Ther- apy,” Trends in Molecular Medicine, Vol. 13, No. 8, 2007, pp. 353-361. doi:10.1016/j.molmed.2007.07.001 [7] A. Kumar, A. G. Nair, A.V. Reddy and A. N. Garg, “Bhas- mas: Unique Ayurvedic Metallic-Herbal Preparations, Che- mical Characterization,” Biological Trace Element Re- search, Vol. 109, No. 3, 2006, pp. 231-254. doi:10.1385/BTER:109:3:231 [8] E. Ernst, “Toxic Heavy Metals and Undeclared Drugs in Asian Herbal Medicines,” Trends in Pharmacological Sciences, Vol. 23, No. 3, 2002, pp. 136-139. doi:10.1016/S0165-6147(00)01972-6 [9] E. Lynch and R. Braithwaite, “A Review of the Clinical and Toxicological Aspects of “Traditional” (Herbal) Me- dicines Adulterated with Heavy Metals,” Expert Opinion on Drug Safety, Vol. 4, No. 4, 2005, pp. 769-778. doi:10.1517/14740338.4.4.769 [10] K. Cooper, B. Noller, D. Connell, J. Yu, R. Sadler, Ols- zowy, H. Golding, G. Tinggi, U. Moore and M. R. Myers, “Public Health Risks from Heavy Metals and Metal- loids,” Journal of Toxicology and Environmental Health, Part A: Current Issues, Vol. 70, No. 19, 2007, pp. 1694- Copyright © 2012 SciRes. JMMCE 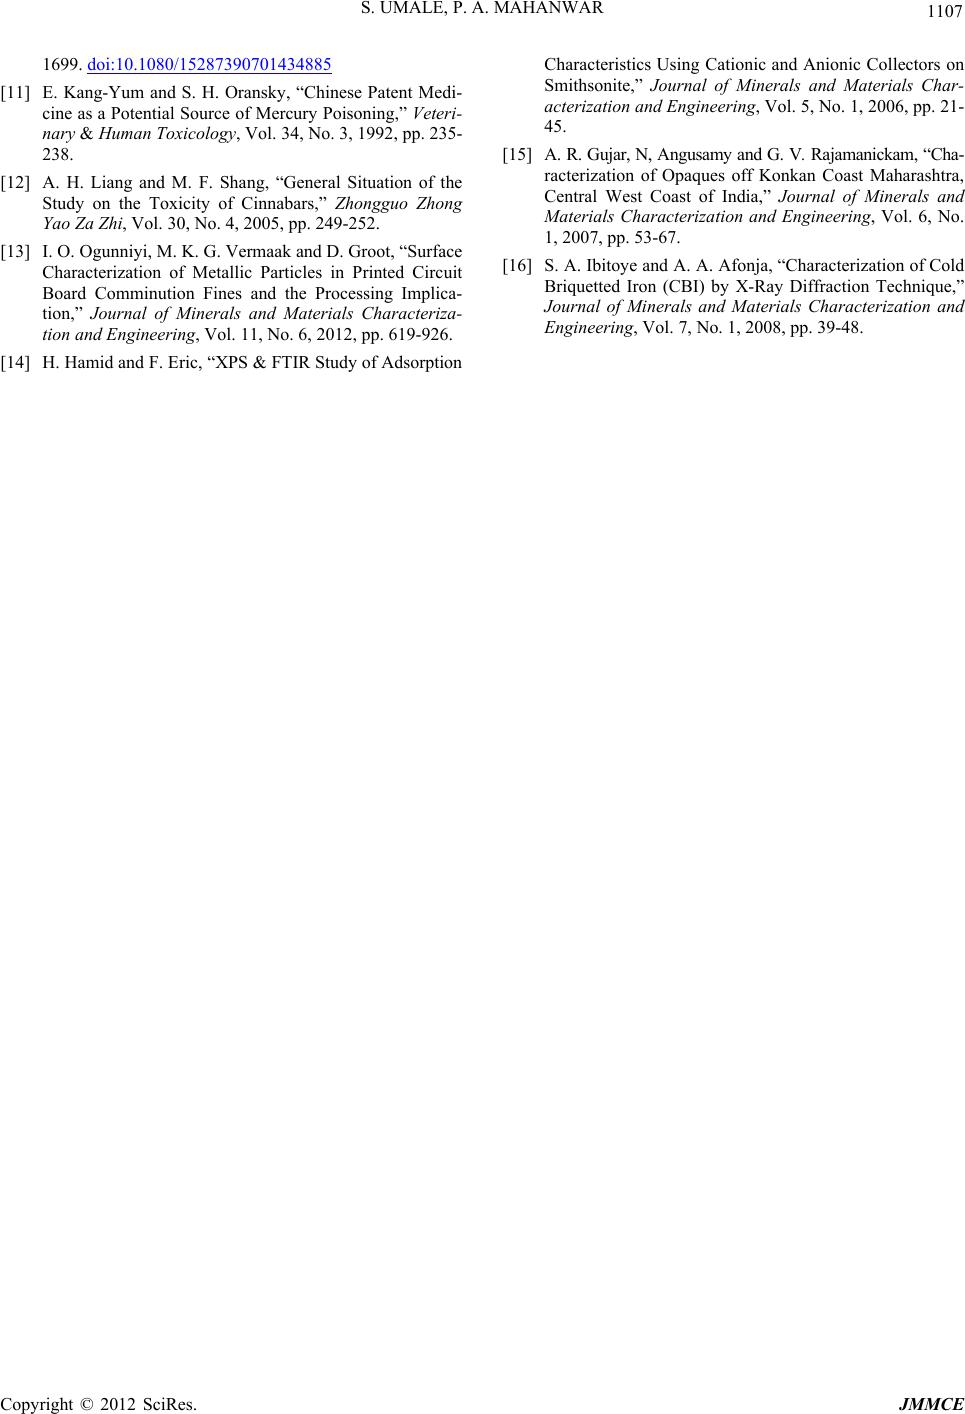 S. UMALE, P. A. MAHANWAR Copyright © 2012 SciRes. JMMCE 1107 1699. doi:10.1080/15287390701434885 [11] E. Kang-Yum and S. H. Oransky, “Chinese Patent Medi- cine as a Potential Source of Mercury Poisoning,” Veteri- nary & Human Toxicology, Vol. 34, No. 3, 1992, pp. 235- 238. [12] A. H. Liang and M. F. Shang, “General Situation of the Study on the Toxicity of Cinnabars,” Zhongguo Zhong Yao Za Zhi, Vol. 30, No. 4, 2005, pp. 249-252. [13] I. O. Ogunniyi, M. K. G. Vermaak and D. Groot, “Surface Characterization of Metallic Particles in Printed Circuit Board Comminution Fines and the Processing Implica- tion,” Journal of Minerals and Materials Characteriza- tion and Engineering, Vol. 11, No. 6, 2012, pp. 619-926. [14] H. Hamid and F. Eric, “XPS & FTIR Study of Adsorption Characteristics Using Cationic and Anionic Collectors on Smithsonite,” Journal of Minerals and Materials Char- acterization and Engineering, Vol. 5, No. 1, 2006, pp. 21- 45. [15] A. R. Gujar, N, Angusamy and G. V. Rajamanickam, “Cha- racterization of Opaques off Konkan Coast Maharashtra, Central West Coast of India,” Journal of Minerals and Materials Characterization and Engineering, Vol. 6, No. 1, 2007, pp. 53-67. [16] S. A. Ibitoye and A. A. Afonja, “Characterization of Cold Briquetted Iron (CBI) by X-Ray Diffraction Technique,” Journal of Minerals and Materials Characterization and Engineering, Vol. 7, No. 1, 2008, pp. 39-48. |