

Paper Menu >>
Journal Menu >>
 Journal of Minerals and Materials Characterization and Engineering, 2012, 11, 1095-1100 Published Online November 2012 (http://www.SciRP.org/journal/jmmce) Mechanical Property Estimation of Similar Weld using Ball Indentation Technique Harshit Kumar Khandelwal1*, Kamal Sharma2, Rahul Chhibber3 1Homi Bhabha National Institute, Mumbai, India 2Reactor Safety Division, Bhabha Atomic Research Centre, Mumbai, India 3Indian Institute of Technology Rajasthan, Jodhpur, India Email: *[email protected] Received July 4, 2012; revised August 10, 2012; accepted August 24, 2012 ABSTRACT A weld joint is composed of three principal zones viz., base metal, Heat Affected Zone (HAZ), and weld zone. Thus, the variation in mechanical behavior exists not only among these zones, but also from point to point in each individual zone. Being destructive in nature, the conventional method of mechanical testing cannot successfully used to estimate the variation in the mechanical behavior at different zones of the weld joint. Moreover, the conventional method of me- chanical testing cannot characterize the material using small amount of material. In this respect, Ball Indentation (BI) methodology was considered to be useful approach, since it can characterize the mechanical properties of a material using very small amount of material in non destructive manner. The present work is an attempt to characterize the variation in the mechanical properties among each zone (global variation), and from point to point in each zone (local variation) of the similar weld joint used in nuclear application using BI approach. For this purpose, the similar weld joint of two SS-304 LN pipe lines was investigated using BI approach. Keywords: Ball Indentation; In Situ; Similar Weld Joint; Flow Properties; Pressurized Water Reactor; Reactor Pressure Vessel 1. Introduction 1.1. Similar Weld Joint (Weld Joint of SS 304 LN Pipelines) Pressurized Water Reactor (PWR) is the most widely used reactor type in the world, in which enriched (about 3.2% U-235) uranium dioxide is utilized as the fuel in zirconium alloy cans. The fuel is arranged in the arrays of fuel pins and interspersed with the movable control rods. The fuel is held in a steel vessel through which wa- ter at high pressure (at 16 MPa, to suppress boiling) is pumped to reactor vessel via cold lag pipeline to act as both a coolant and a moderator. After absorbing the heat from the core of reactor, high-pressure water is passed to a steam generator, via hot lag pipeline which raises steam in the usual way. Both hot lag and cold lag pipe lines are made of SS 304 LN material and have the simi- lar weld joint. The chemical composition of SS 304 LN which was used for the present investigation is shown in Table 1. 2. Ball Indentation Approach Ball Indentation (BI) is a non destructive approach to Table 1. Chemical composition of SS 304 LN material used for investigation. C MnNiSiS P Cr N Fe 0.032 8-1210.030.04 18-20 0.1 Balance determine mechanical behavior of the materials. More over it utilizes very small amount of material during me- chanical behavior examination. This technique can be utilized for the situations where in situ investigation of mechanical behavior is required. In order to find out the mechanical properties using BI testing, many theories and models have been proposed. Tabor [1] proposed an empirical relationship, which correlates the plastic strain corresponding to uniaxial loading with plastic indenta- tion strain corresponding to indentation loading using spherical indenter. Mayer [2] was the first one, who cor- related the yield strength of material with the impression diameter and the mean pressure during indentation load- ing. Haggag et al. [3-8] developed BI setup to predict the mechanical behavior of the materials. Later this setup was utilized for the investigation of flow and fracture be- havior of different materials by several researchers [9-11]. There exists a good agreement between BI generated *Corresponding author. Copyright © 2012 SciRes. JMMCE 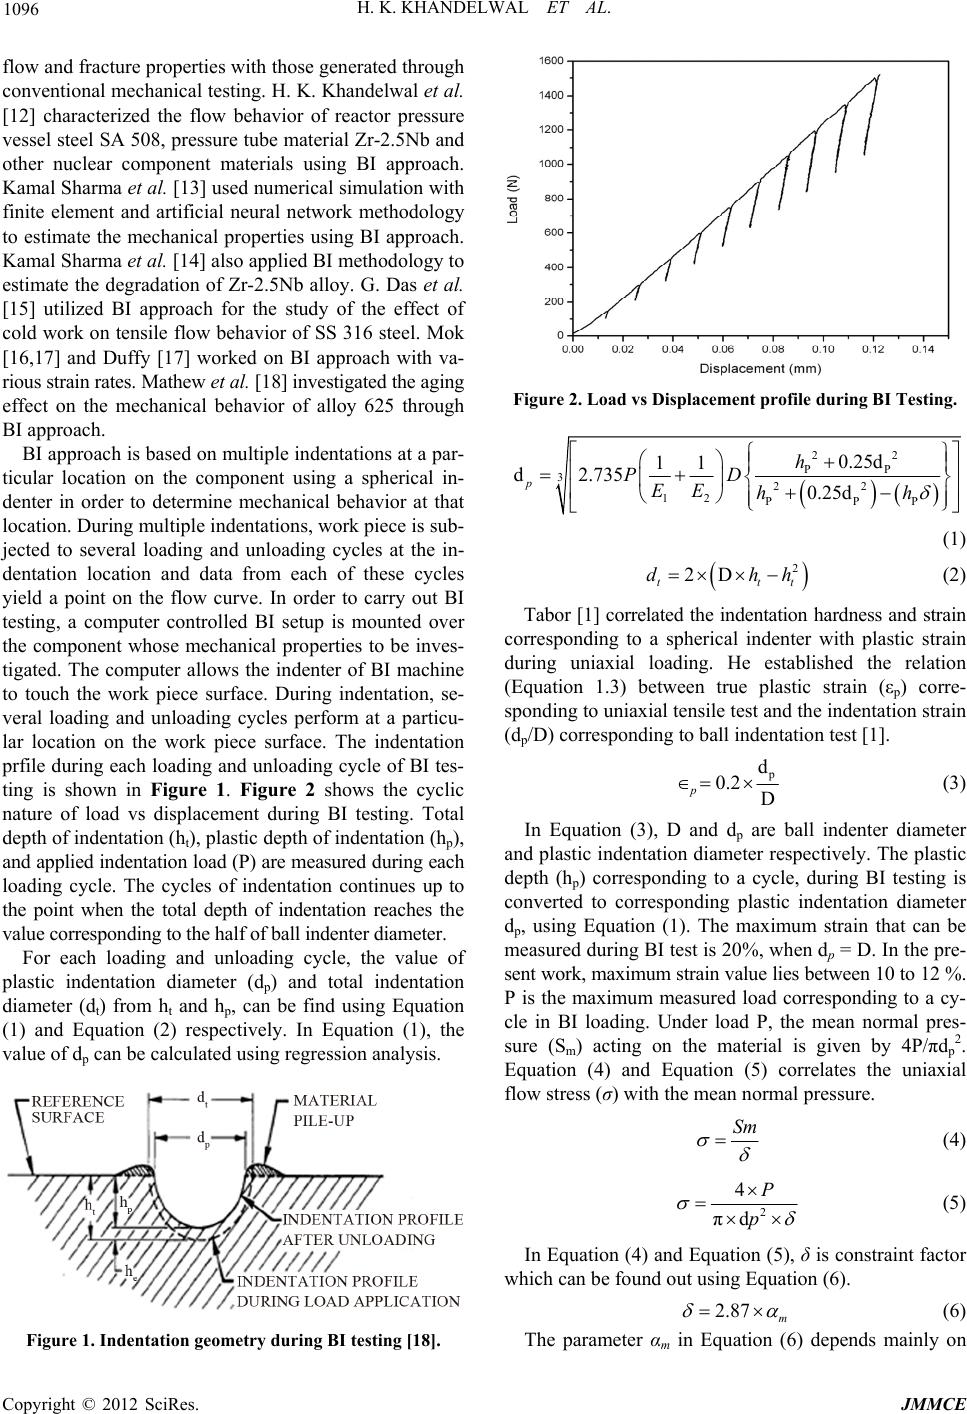 H. K. KHANDELWAL ET AL. 1096 flow and fracture properties with those generated through conventional mechanical testing. H. K. Khandelwal et al. [12] characterized the flow behavior of reactor pressure vessel steel SA 508, pressure tube material Zr-2.5Nb and other nuclear component materials using BI approach. Kamal Sharma et al. [13] used numerical simulation with finite element and artificial neural network methodology to estimate the mechanical properties using BI approach. Kamal Sharma et al. [14] also applied BI methodology to estimate the degradation of Zr-2.5Nb alloy. G. Das et al. [15] utilized BI approach for the study of the effect of cold work on tensile flow behavior of SS 316 steel. Mok [16,17] and Duffy [17] worked on BI approach with va- rious strain rates. Mathew et al. [18] investigated the aging effect on the mechanical behavior of alloy 625 through BI approach. BI approach is based on multiple indentations at a par- ticular location on the component using a spherical in- denter in order to determine mechanical behavior at that location. During multiple indentations, work piece is sub- jected to several loading and unloading cycles at the in- dentation location and data from each of these cycles yield a point on the flow curve. In order to carry out BI testing, a computer controlled BI setup is mounted over the component whose mechanical properties to be inves- tigated. The computer allows the indenter of BI machine to touch the work piece surface. During indentation, se- veral loading and unloading cycles perform at a particu- lar location on the work piece surface. The indentation prfile during each loading and unloading cycle of BI tes- ting is shown in Figure 1. Figure 2 shows the cyclic nature of load vs displacement during BI testing. Total depth of indentation (ht), plastic depth of indentation (hp), and applied indentation load (P) are measured during each loading cycle. The cycles of indentation continues up to the point when the total depth of indentation reaches the value corresponding to the half of ball indenter diameter. For each loading and unloading cycle, the value of plastic indentation diameter (dp) and total indentation diameter (dt) from ht and hp, can be find using Equation (1) and Equation (2) respectively. In Equation (1), the value of dp can be calculated using regression analysis. Figure 1. Indentation geometry during BI testing [18]. Figure 2. Load vs Displacement profile during BI Testing. 22 PP 322 12 PPP 0.25d 11 d 2.7350.25d p h PD EE hh (1) 2 2D tt dh t h (2) Tabor [1] correlated the indentation hardness and strain corresponding to a spherical indenter with plastic strain during uniaxial loading. He established the relation (Equation 1.3) between true plastic strain (εp) corre- sponding to uniaxial tensile test and the indentation strain (dp/D) corresponding to ball indentation test [1]. p d 0.2 D p (3) In Equation (3), D and dp are ball indenter diameter and plastic indentation diameter respectively. The plastic depth (hp) corresponding to a cycle, during BI testing is converted to corresponding plastic indentation diameter dp, using Equation (1). The maximum strain that can be measured during BI test is 20%, when dp = D. In the pre- sent work, maximum strain value lies between 10 to 12 %. P is the maximum measured load corresponding to a cy- cle in BI loading. Under load P, the mean normal pres- sure (Sm) acting on the material is given by 4P/πdp 2. Equation (4) and Equation (5) correlates the uniaxial flow stress (σ) with the mean normal pressure. Sm (4) 2 4 πd P p (5) In Equation (4) and Equation (5), δ is constraint factor which can be found out using Equation (6). 2.87 m (6) The parameter αm in Equation (6) depends mainly on Copyright © 2012 SciRes. JMMCE  H. K. KHANDELWAL ET AL. 1097 the strain rate sensitivity and work hardening characteris- tic of the material being tested. αm varies from 0.9 to 1.25 for different materials. αm has the value of 1.0 for low strain rate sensitive materials [20]. The flow portion of the true stress vs true plastic strain curves can be represented using power law relationship as given in Equation (7) [20]. n p K (7) In Equation (7) n, K, σ, and εp represent strain harden- ing exponent, strength coefficient, true stress and true plastic strain respectively. The values of strength coeffi- cient (K) and strain hardening exponent (n) can be de- termined using regression analysis of the data fitted to Equation (7). For the case when p = n, Equation (8) pro- vides the expression for true ultimate tensile strength- [20]. n TrueUTS K n (8) Thus engineering ultimate tensile strength is given by Equation (9), n UTS n Ke (9) Yield strength of specimen is not equal to the value of stress corresponding to first cycle during BI testing, since the minimum attainable ball indentation strains for a no- minal size indenter are about 20 times larger than the strain corresponding to yield stress. Hence, the strain cor- responding to yield stress is too small to measure directly from indentation test. Therefore, a different approach is adopted for the estimation of yield strength of the ma- terial [19]. Mayer [2] was the first one who established an em- pirical relationship between the mean pressure and the impression diameter during indentation (Equation 1.10). Data points from all loading cycles (maximum value of dt/D = 1.0) are fit by regression analysis to the relation- ship of Equation (10). 2 2 d d m t t A PD (10) In Equation (10), m and A are Meyer’s exponent (m) and yield parameter respectively. Parameter “m” gener- ally has a value between 2 to 2.5. The value of dt can be determined from total depth of indentation using the Equation (2). The yield strength (σy) is proportional to the Meyer’s hardness (4P/pd2), where d is the final impression di- ameter, and is given by Equation (11). ym A (11) In Equation (11), parameter βm is a constant for a given class of material. The value of βm for each class of material is determined from the yield strength obtained using standard tensile tests. 3. Experimentation The mechanical behavior of similar weld joint was char- acterized using a weld joint of two SS 304 LN pipelines. This weld joint comprised of three principal zones viz., two zones of SS 304 LN base metal and a weld zone, lying in between the two base metal zones. This investi- gation was carried out in order to study the gradients in the mechanical behavior of subzones of the similar weld joint viz., Weld, HAZ and base metal zone. In order to study the gradients in mechanical behavior at these sub- zones, BI experiments were performed along the three principal zones of weld joint. The BI testing was per- formed using load control condition. For this purpose, BI machine was installed over the weld jointed pipelines and BI experiments were performed at these zones of the weld joint at 0.5 KN/min. loading rate. The maximum load during each of the experiments was kept 1.5 KN. The arrangement of installed BI setup over similar weld joint of two SS 304-LN pipelines is shown in Figure 3. The indent points generated after BI experiments on similar weld joint are shown in Figure 4. SS 304 Pipe SS 304 Pipe Weld Zone BI Setup Figure 3. BI setup installed on weld jointed SS 304 LN pipe- lines. Figure 4. Final indentation points after BI experiments. Copyright © 2012 SciRes. JMMCE  H. K. KHANDELWAL ET AL. 1098 4. Results 4.1. Comparison of Different Zones of Similar Weld Joint 4.1.1. Load vs Displacement Curves The three subzones of similar weld joint showed vari- ation in slopes of BI generated load vs displacement curves. Here, heat affected zone shows higher slope of load vs displacement curve in comparison to the base metal zone. Weld zone showed the least slope among the three subzones. The comparison of load vs displacement curves at each of the three zones of similar weld joint (i.e . SS 304 LN, HAZ of SS 304 LN and Weld) is shown in Figure 5. 4.1.2. Flow Behavior Each of the three subzones shows clear variation in the flow properties. Figure 6 shows the true stress vs true plastic strain patterns for each of these subzones. 4.2. Global Comparison After carried out the analysis of BI generated true stress vs true plastic strain curves for three zones of similar Figure 5. Comparison of load vs displacement curves at three zones of similar weld joint. Figure 6. Comparison of true stress vs true plastic strain curves at three zones of similar weld joint. weld joint, mechanical properties (strength coefficient, strain hardening exponent, yield strength and ultimate tensile strength) were determined. The average strength coefficient at heat affected zone was found to be higher than base metal zone. The highest average strength coef- ficient was found in base metal zone and least average strength coefficient was found in the weld zone. The highest value of strain hardening exponent was found in base metal while least was for heat affected zone. The average values of yield strength and ultimate tensile strength of heat affected zones was higher than the re- spective base metal zones. The highest yield strength and ultimate tensile strength was found in case of heat af- fected zone. However, the difference between average ultimate tensile strength for SS 304-LN base metal and its heat affected zone was not significant. The base metal shows least yield strength and weld zone shows least value of ultimate tensile strength was found in weld zone. Table 2 shows the local variation of mean values and standard deviation values of all the BI experiments at three zones of similar weld joint. 4.3. Local Variation of BI Generated YS & UTS along Similar Weld Joint The local variation shows that the heat affected zone had higher yield strength than its base metal zone. This pat- tern was also present in case of bimetallic weld joint (for SA 508 class-2 and SS 304-LN) tested in both loading rates viz. 0.5 KN/min. and 1.5 KN/min [12]. The ulti- mate tensile strength for both base metal and its heat af- fected zone was found to be almost similar. The local variations of yield strength and ultimate tensile strength along the three zones of similar weld joint of SS 304-LN pipelines are shown in Figures 7 and 8 respectively. 5. Conclusions After carried out the mechanical behavior investigation Table 2. Comparison of mean and standard deviation va- lues of BI generated mechanical properties at three zones of similar weld joint. Position → SS 304 Weld Zone SS 304 HAZ SS 304 Base Metal Zone Mechanical Properties Mean SD Mean SD Mean SD Strength Coefficient (MPa)1455.454 1529 306.8 1592142 Strain Hardening Exponent 0.260.020.24 0.07 0.28 0.03 Yield Strength (MPa) 556.815.4747.1 68.9 338.0 6.50 UTS (MPa) 785.089.68843.0 85.2 842.735.34 Copyright © 2012 SciRes. JMMCE 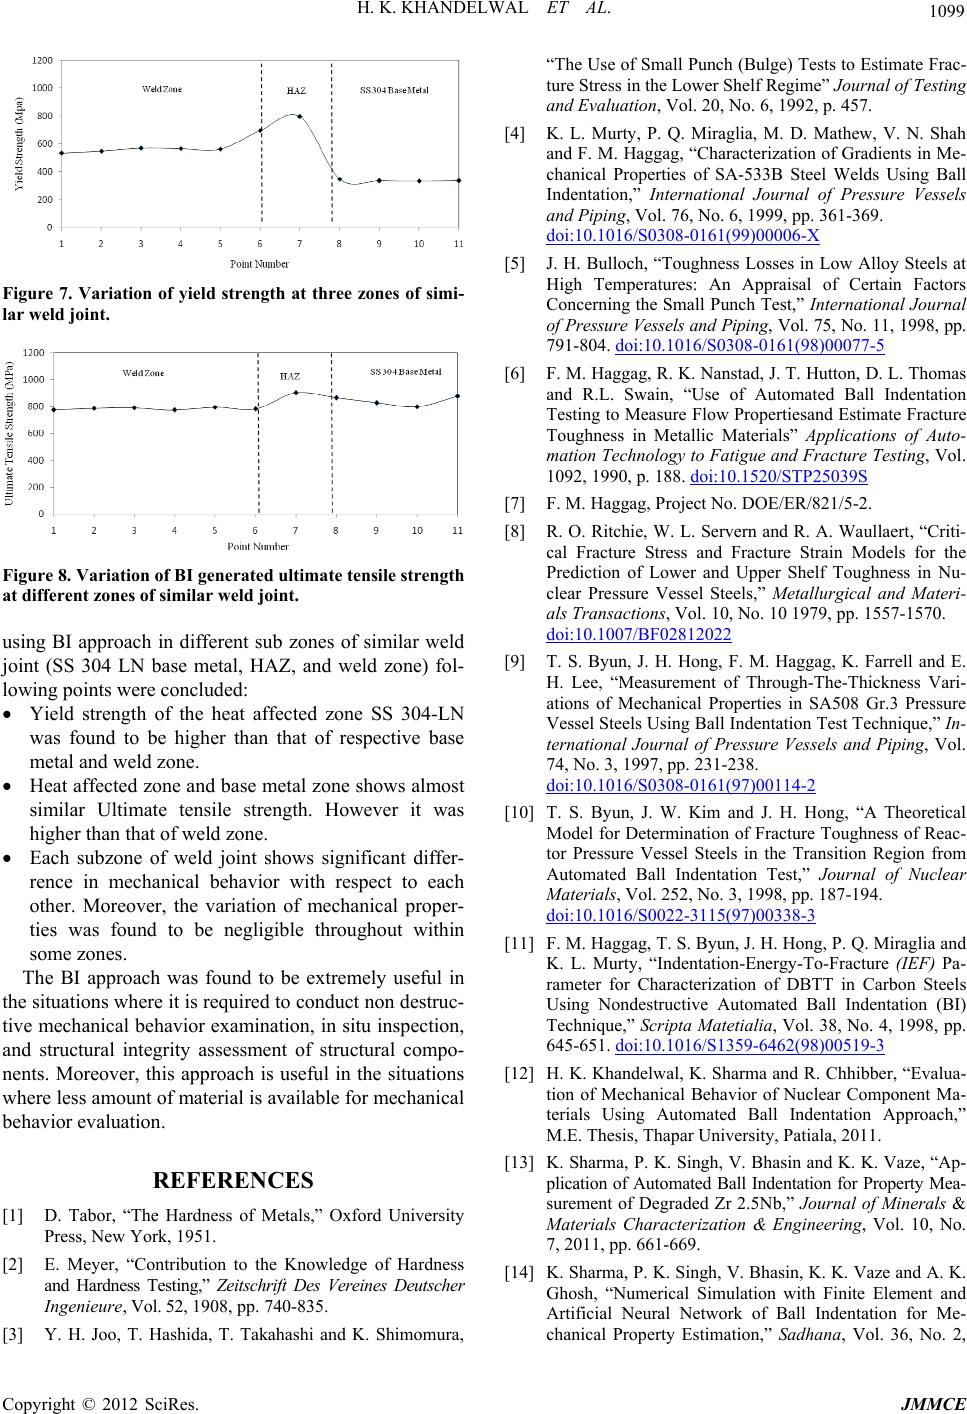 H. K. KHANDELWAL ET AL. 1099 Figure 7. Variation of yield strength at three zones of simi- lar weld joint. Figure 8. Variation of BI generated ultimate tensile strength at different zones of similar weld joint. using BI approach in different sub zones of similar weld joint (SS 304 LN base metal, HAZ, and weld zone) fol- lowing points were concluded: Yield strength of the heat affected zone SS 304-LN was found to be higher than that of respective base metal and weld zone. Heat affected zone and base metal zone shows almost similar Ultimate tensile strength. However it was higher than that of weld zone. Each subzone of weld joint shows significant differ- rence in mechanical behavior with respect to each other. Moreover, the variation of mechanical proper- ties was found to be negligible throughout within some zones. The BI approach was found to be extremely useful in the situations where it is required to conduct non destruc- tive mechanical behavior examination, in situ inspection, and structural integrity assessment of structural compo- nents. Moreover, this approach is useful in the situations where less amount of material is available for mechanical behavior evaluation. REFERENCES [1] D. Tabor, “The Hardness of Metals,” Oxford University Press, New York, 1951. [2] E. Meyer, “Contribution to the Knowledge of Hardness and Hardness Testing,” Zeitschrift Des Vereines Deutscher Ingenieure, Vol. 52, 1908, pp. 740-835. [3] Y. H. Joo, T. Hashida, T. Takahashi and K. Shimomura, “The Use of Small Punch (Bulge) Tests to Estimate Frac- ture Stress in the Lower Shelf Regime” Journal of Testing and Evaluation, Vol. 20, No. 6, 1992, p. 457. [4] K. L. Murty, P. Q. Miraglia, M. D. Mathew, V. N. Shah and F. M. Haggag, “Characterization of Gradients in Me- chanical Properties of SA-533B Steel Welds Using Ball Indentation,” International Journal of Pressure Vessels and Piping, Vol. 76, No. 6, 1999, pp. 361-369. doi:10.1016/S0308-0161(99)00006-X [5] J. H. Bulloch, “Toughness Losses in Low Alloy Steels at High Temperatures: An Appraisal of Certain Factors Concerning the Small Punch Test,” International Journal of Pressure Vessels and Piping, Vol. 75, No. 11, 1998, pp. 791-804. doi:10.1016/S0308-0161(98)00077-5 [6] F. M. Haggag, R. K. Nanstad, J. T. Hutton, D. L. Thomas and R.L. Swain, “Use of Automated Ball Indentation Testing to Measure Flow Propertiesand Estimate Fracture Toughness in Metallic Materials” Applications of Auto- mation Technology to Fatigue and Fracture Testing, Vol. 1092, 1990, p. 188. doi:10.1520/STP25039S [7] F. M. Haggag, Project No. DOE/ER/821/5-2. [8] R. O. Ritchie, W. L. Servern and R. A. Waullaert, “Criti- cal Fracture Stress and Fracture Strain Models for the Prediction of Lower and Upper Shelf Toughness in Nu- clear Pressure Vessel Steels,” Metallurgical and Materi- als Transactions, Vol. 10, No. 10 1979, pp. 1557-1570. doi:10.1007/BF02812022 [9] T. S. Byun, J. H. Hong, F. M. Haggag, K. Farrell and E. H. Lee, “Measurement of Through-The-Thickness Vari- ations of Mechanical Properties in SA508 Gr.3 Pressure Vessel Steels Using Ball Indentation Test Technique,” In- ternational Journal of Pressure Vessels and Piping, Vol. 74, No. 3, 1997, pp. 231-238. doi:10.1016/S0308-0161(97)00114-2 [10] T. S. Byun, J. W. Kim and J. H. Hong, “A Theoretical Model for Determination of Fracture Toughness of Reac- tor Pressure Vessel Steels in the Transition Region from Automated Ball Indentation Test,” Journal of Nuclear Materials, Vol. 252, No. 3, 1998, pp. 187-194. doi:10.1016/S0022-3115(97)00338-3 [11] F. M. Haggag, T. S. Byun, J. H. Hong, P. Q. Miraglia and K. L. Murty, “Indentation-Energy-To-Fracture (IEF) Pa- rameter for Characterization of DBTT in Carbon Steels Using Nondestructive Automated Ball Indentation (BI) Technique,” Scripta Matetialia, Vol. 38, No. 4, 1998, pp. 645-651. doi:10.1016/S1359-6462(98)00519-3 [12] H. K. Khandelwal, K. Sharma and R. Chhibber, “Evalua- tion of Mechanical Behavior of Nuclear Component Ma- terials Using Automated Ball Indentation Approach,” M.E. Thesis, Thapar University, Patiala, 2011. [13] K. Sharma, P. K. Singh, V. Bhasin and K. K. Vaze, “Ap- plication of Automated Ball Indentation for Property Mea- surement of Degraded Zr 2.5Nb,” Journal of Minerals & Materials Characterization & Engineering, Vol. 10, No. 7, 2011, pp. 661-669. [14] K. Sharma, P. K. Singh, V. Bhasin, K. K. Vaze and A. K. Ghosh, “Numerical Simulation with Finite Element and Artificial Neural Network of Ball Indentation for Me- chanical Property Estimation,” Sadhana, Vol. 36, No. 2, Copyright © 2012 SciRes. JMMCE  H. K. KHANDELWAL ET AL. Copyright © 2012 SciRes. JMMCE 1100 2011, pp. 181-192. doi:10.1007/s12046-011-0019-3 [15] G. Das, S. Ghosh and S. K. Sahay, “Use of Ball Indenta- tion Technique to Determine the Change of Tensile Prop- erties of SS316L Steel Due to Cold Rolling,” Materials Letters, Vol. 59, No. 18, 2005, pp. 2246-2251. doi:10.1016/j.matlet.2005.01.074 [16] C. H. Mok, “The Dependence of Yield Stress on Strain Rate as Determined from Ball-indentation Tests,” Expe- rimental Mechanics, Vol. 6, No. 2, 1966, pp. 87-92. doi:10.1007/BF02326226 [17] C. H. Mok and J. Duffy, “The Dynamic Stress-Strain Re- lation of Metals as Determined from Impact Tests with a Hard Ball,” International Journal of Mechanical Sci- ences, Vol. 7, No. 5, 1965, pp. 355-366. doi:10.1016/0020-7403(65)90064-0 [18] M. D. Mathew, K. L. Murty, K. B. S. Rao and S. L. Man- nan, “Ball Indentation Studies on the Effect of Aging on Mechanical Behavior of Alloy 625,” Materials Science and Engineering: A, Vol. 264, No. 1-2, 1999, pp. 159-166. [19] R. K. Nanstad, F. M. Haggag, J. T. Hutton, D. L. Thomas and R. L. Swain, “Use of Automated Ball Indentation Test- ing to Measure Flow Properties and Estimate Fracture Toughness in Metallic Materials, Applications of Auto- mation Technology to Fatigue and Fracture Testing,” American Society for Testing and Materials International, Vol. 1092, 1990, pp. 188-208. |