

Paper Menu >>
Journal Menu >>
 Journal of Minerals and Materials Characterization and Engineering, 2012, 11, 1069-1074 Published Online November 2012 (http://www.SciRP.org/journal/jmmce) Growth and Characterization of β-Alanine Oxalate— A New Organic Single Crystal S. Lincy Mary Ponmani1, P. Selvarajan2*, N. Balasundari3, D. Jencylin3 1Department of Physics, St. Mother Theresa Engineering College, Tuticorin, India 2Department of Physics, Aditanar College of Arts and Science, Tiruchendur, India 3Department of Physics, Infant Jesus College Of Engineering, Tuticorin, India Email: *[email protected] Received July 6, 2012; revised August 10, 2012; accepted August 17, 2012 ABSTRACT A new organic single crystal of β-Alanine Oxalate (BAO) has been grown from solution by slow evaporation technique. Transparent, colourless crystals of size upto 11 × 9 × 4 mm3 were obtained. Formation of the new crystal has been con- firmed by single crystal XRD and FTIR spectra. The grown crystals have been subjected to powder X-ray diffraction studies to identify the crystalline nature. Single crystal X-ray diffractometer was utilized to measure unit cell parameters and to confirm the crystal structure. BAO belongs to monoclinic system with lattice parameters a = 22.335 Å, b = 5.697 Å, c = 13.993 Å, α = 90˚, β = 115.37˚, γ = 90˚, and volume of the unit cell, V = 1609 Å3. The functional groups are con- firmed by FTIR vibrational analysis. Optical transmission spectra revealed the optical properties of the grown crystal. Transmission spectrum reveals that the crystal has low UV cut-off of 205 nm and has a good transmittance in the entire visible region enabling its use in optical applications. There is no absorption in the entire visible region. Mechanical strength of the grown material is tested by hardness studies. The value of hardness increases when the applied load is increased. Keywords: Amino Acid; X-Ray Diffraction; Lattice Parameters; FTIR; Transmittance; Microhardness; Organic Crystal; SHG 1. Introduction Amino acids and their complexes are the organic or semi-organic materials that have attracted great attention due to their ability in ease of processing in the assembly of optical devices. The complete understanding of the optical properties of amino acid crystals, as well as other organic crystals, still requires more attention [1-7]. 3-Aminopropionic acid is commonly known as β-alanine with molecular formula C3H7NO2 and in which the amino group is at the β-position from the carboxylate group [8-10]. Supplementation with β-alanine has been shown to increase the concentration of carosine in mus- cles, decrease in fatigue in athletes and increase total muscular work done. β-alanine is purely a synthetic amino acid and it is a positional isomer of L-alanine [11,12]. It forms crystalline complexes with organic, inorganic acids or salts. In this paper, we report for the first time the growth and characterization of a new or- ganic crystal viz. β-alanine oxalate and the results are presented. 2. Experimental Procedure 2.1. Growth β-alanine and oxalic acid were taken in the molar ratio of 1:1 and the calculated amounts of β-alanine and oxalic acid were dissolved thoroughly in de-ionized water at room temperature. A saturated solution was prepared and the solution was filtered using a Whatmann filter paper. For the growth, the filtered solution in a beaker was allowed for slow evaporation. Good colourless, trans- parent single crystals were obtained within a period of 15 - 20 days. The grown crystal is displayed in Figure 1. The size of a grown crystal is observed to be 11 × 9 × 4 mm3. Re-crystallization was carried out twice to improve the purity of the sample. 2.2. Instrumentation Powder X-ray diffraction measurement was taken using an automated X-ray powder diffractometer(PANalytical) with nickel filtered, monchromated CuKα radiation (λ = 1.5406 Å). The XRD pattern was taken after the grown crystal was crushed into fine powder. The Fourier Transform Infrared (FTIR) spectrum was recorded using *Corresponding author. Copyright © 2012 SciRes. JMMCE 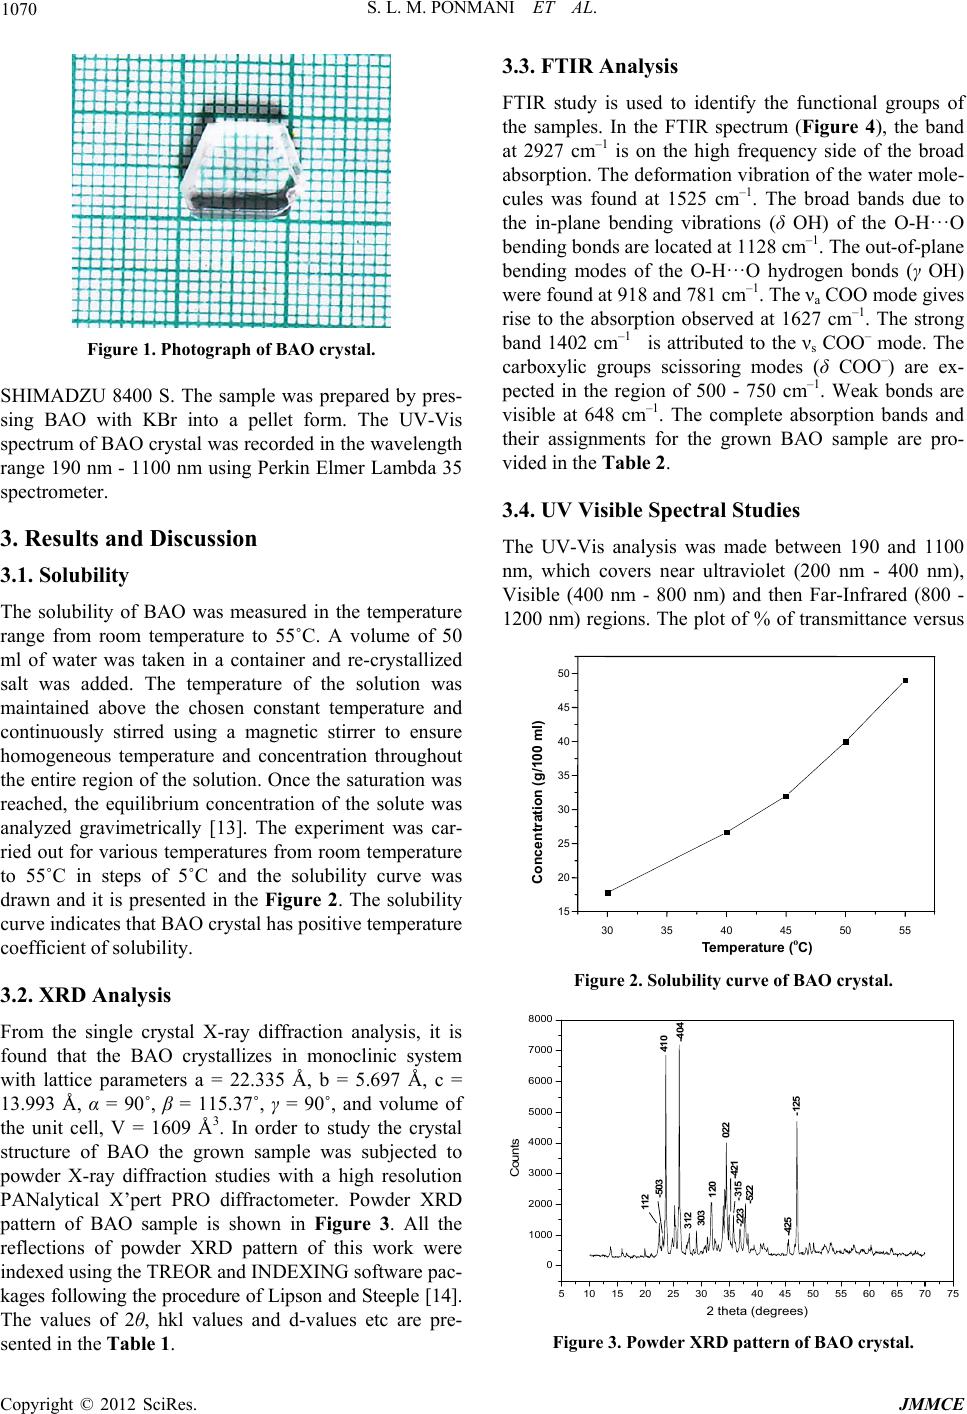 S. L. M. PONMANI ET AL. 1070 Figure 1. Photograph of BAO crystal. SHIMADZU 8400 S. The sample was prepared by pres- sing BAO with KBr into a pellet form. The UV-Vis spectrum of BAO crystal was recorded in the wavelength range 190 nm - 1100 nm using Perkin Elmer Lambda 35 spectrometer. 3. Results and Discussion 3.1. Solubility The solubility of BAO was measured in the temperature range from room temperature to 55˚C. A volume of 50 ml of water was taken in a container and re-crystallized salt was added. The temperature of the solution was maintained above the chosen constant temperature and continuously stirred using a magnetic stirrer to ensure homogeneous temperature and concentration throughout the entire region of the solution. Once the saturation was reached, the equilibrium concentration of the solute was analyzed gravimetrically [13]. The experiment was car- ried out for various temperatures from room temperature to 55˚C in steps of 5˚C and the solubility curve was drawn and it is presented in the Figure 2. The solubility curve indicates that BAO crystal has positive temperature coefficient of solubility. 3.2. XRD Analysis From the single crystal X-ray diffraction analysis, it is found that the BAO crystallizes in monoclinic system with lattice parameters a = 22.335 Å, b = 5.697 Å, c = 13.993 Å, α = 90˚, β = 115.37˚, γ = 90˚, and volume of the unit cell, V = 1609 Å3. In order to study the crystal structure of BAO the grown sample was subjected to powder X-ray diffraction studies with a high resolution PANalytical X’pert PRO diffractometer. Powder XRD pattern of BAO sample is shown in Figure 3. All the reflections of powder XRD pattern of this work were indexed using the TREOR and INDEXING software pac- kages following the procedure of Lipson and Steeple [14]. The values of 2θ, hkl values and d-values etc are pre- sented in the Table 1. 3.3. FTIR Analysis FTIR study is used to identify the functional groups of the samples. In the FTIR spectrum (Figure 4), the band at 2927 cm–1 is on the high frequency side of the broad absorption. The deformation vibration of the water mole- cules was found at 1525 cm–1. The broad bands due to the in-plane bending vibrations (δ OH) of the O-H···O bending bonds are located at 1128 cm–1. The out-of-plane bending modes of the O-H···O hydrogen bonds (γ OH) were found at 918 and 781 cm–1. The νa COO mode gives rise to the absorption observed at 1627 cm–1. The strong band 1402 cm–1 is attributed to the νs COO– mode. The carboxylic groups scissoring modes (δ COO–) are ex- pected in the region of 500 - 750 cm–1. Weak bonds are visible at 648 cm–1. The complete absorption bands and their assignments for the grown BAO sample are pro- vided in the Table 2. 3.4. UV Visible Spectral Studies The UV-Vis analysis was made between 190 and 1100 nm, which covers near ultraviolet (200 nm - 400 nm), Visible (400 nm - 800 nm) and then Far-Infrared (800 - 1200 nm) regions. The plot of % of transmittance versus 30 35 40 45 50 55 15 20 25 30 35 40 45 50 Concentration (g/100 ml) Temperature ( o C) Figure 2. Solubility curve of BAO crystal. 5 1015202530354045505560657075 0 1000 2000 3000 4000 5000 6000 7000 8000 -425 303 312 -223 -315 -421 -503 112 -125 -522 022 120 -404 410 Counts 2 theta (degrees) Figure 3. Powder XRD pattern of BAO crystal. Copyright © 2012 SciRes. JMMCE 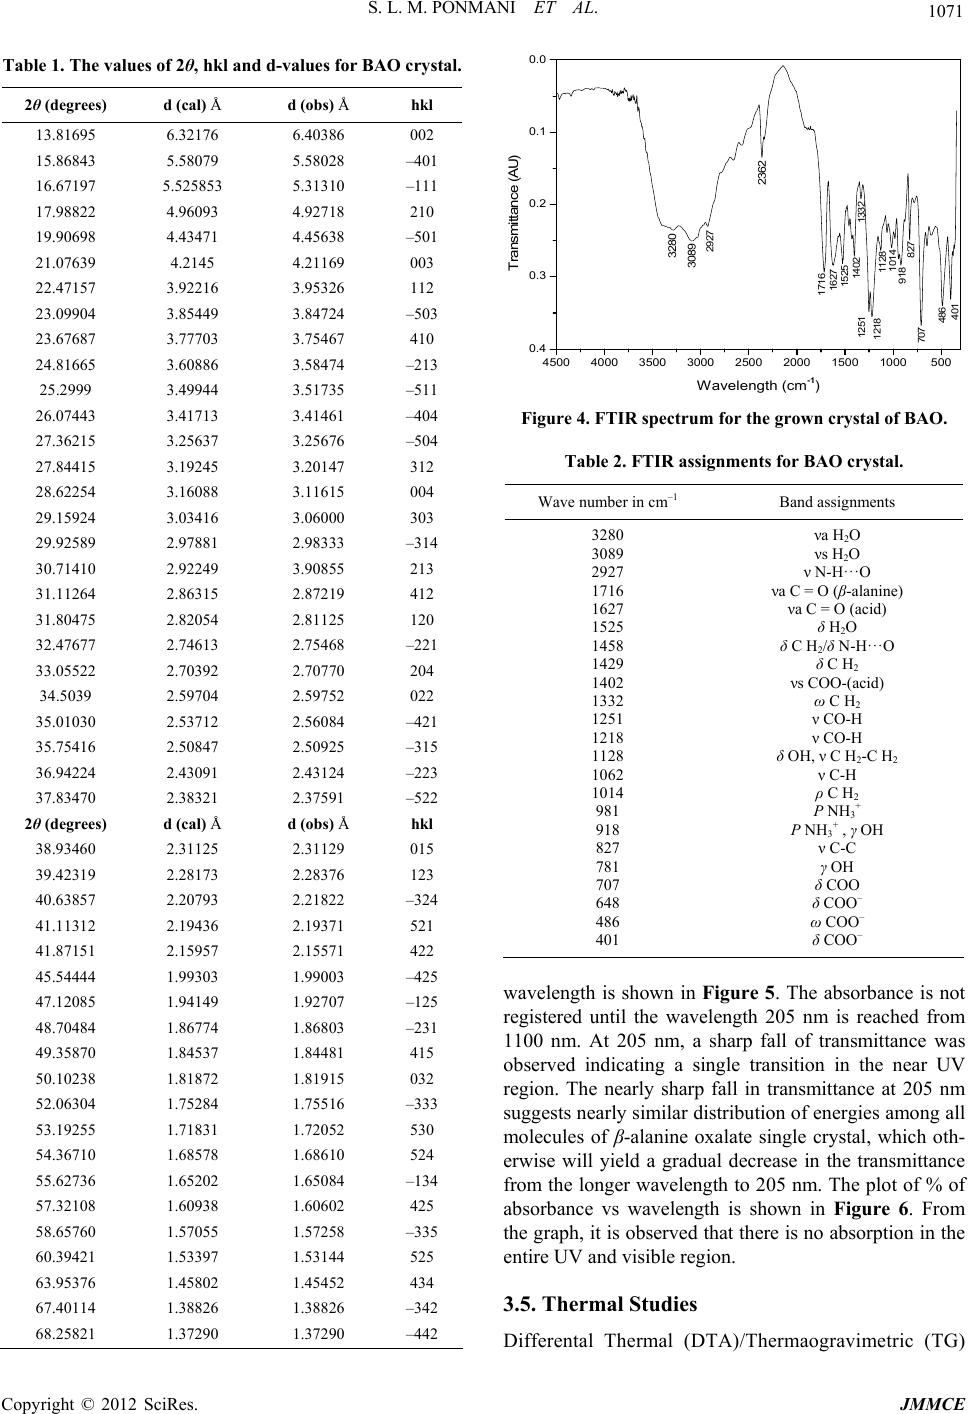 S. L. M. PONMANI ET AL. 1071 Table 1. The values of 2θ, hkl and d-values for BAO crystal. 2θ (degrees) d (cal) Å d (obs) Å hkl 13.81695 6.32176 6.40386 002 15.86843 5.58079 5.58028 –401 16.67197 5.525853 5.31310 –111 17.98822 4.96093 4.92718 210 19.90698 4.43471 4.45638 –501 21.07639 4.2145 4.21169 003 22.47157 3.92216 3.95326 112 23.09904 3.85449 3.84724 –503 23.67687 3.77703 3.75467 410 24.81665 3.60886 3.58474 –213 25.2999 3.49944 3.51735 –511 26.07443 3.41713 3.41461 –404 27.36215 3.25637 3.25676 –504 27.84415 3.19245 3.20147 312 28.62254 3.16088 3.11615 004 29.15924 3.03416 3.06000 303 29.92589 2.97881 2.98333 –314 30.71410 2.92249 3.90855 213 31.11264 2.86315 2.87219 412 31.80475 2.82054 2.81125 120 32.47677 2.74613 2.75468 –221 33.05522 2.70392 2.70770 204 34.5039 2.59704 2.59752 022 35.01030 2.53712 2.56084 –421 35.75416 2.50847 2.50925 –315 36.94224 2.43091 2.43124 –223 37.83470 2.38321 2.37591 –522 2θ (degrees) d (cal) Å d (obs) Å hkl 38.93460 2.31125 2.31129 015 39.42319 2.28173 2.28376 123 40.63857 2.20793 2.21822 –324 41.11312 2.19436 2.19371 521 41.87151 2.15957 2.15571 422 45.54444 1.99303 1.99003 –425 47.12085 1.94149 1.92707 –125 48.70484 1.86774 1.86803 –231 49.35870 1.84537 1.84481 415 50.10238 1.81872 1.81915 032 52.06304 1.75284 1.75516 –333 53.19255 1.71831 1.72052 530 54.36710 1.68578 1.68610 524 55.62736 1.65202 1.65084 –134 57.32108 1.60938 1.60602 425 58.65760 1.57055 1.57258 –335 60.39421 1.53397 1.53144 525 63.95376 1.45802 1.45452 434 67.40114 1.38826 1.38826 –342 68.25821 1.37290 1.37290 –442 4500 4000 3500 3000 2500 2000 1500 1000500 0.4 0.3 0.2 0.1 0.0 1128 1014 918 827 486 401 707 1218 1251 1332 1402 1525 1627 1716 2362 2927 3089 3280 Transmittance (AU) Wavelength (cm -1 ) Figure 4. FTIR spectrum for the grown crystal of BAO. Table 2. FTIR assignments for BAO crystal. Wave number in cm–1 Band assignments 3280 3089 2927 1716 1627 1525 1458 1429 1402 1332 1251 1218 1128 1062 1014 981 918 827 781 707 648 486 401 νa H2O νs H2O ν N-H···O νa C = O (β-alanine) νa C = O (acid) δ H2O δ C H2/δ N-H···O δ C H2 νs COO-(acid) ω C H2 ν CO-H ν CO-H δ OH, ν C H2-C H2 ν C-H ρ C H2 Ρ NH3+ Ρ NH3+ , γ OH ν C-C γ OH δ COO δ COO– ω COO– δ COO– wavelength is shown in Figure 5. The absorbance is not registered until the wavelength 205 nm is reached from 1100 nm. At 205 nm, a sharp fall of transmittance was observed indicating a single transition in the near UV region. The nearly sharp fall in transmittance at 205 nm suggests nearly similar distribution of energies among all molecules of β-alanine oxalate single crystal, which oth- erwise will yield a gradual decrease in the transmittance from the longer wavelength to 205 nm. The plot of % of absorbance vs wavelength is shown in Figure 6. From the graph, it is observed that there is no absorption in the entire UV and visible region. 3.5. Thermal Studies Differental Thermal (DTA)/Thermaogravimetric (TG) Copyright © 2012 SciRes. JMMCE 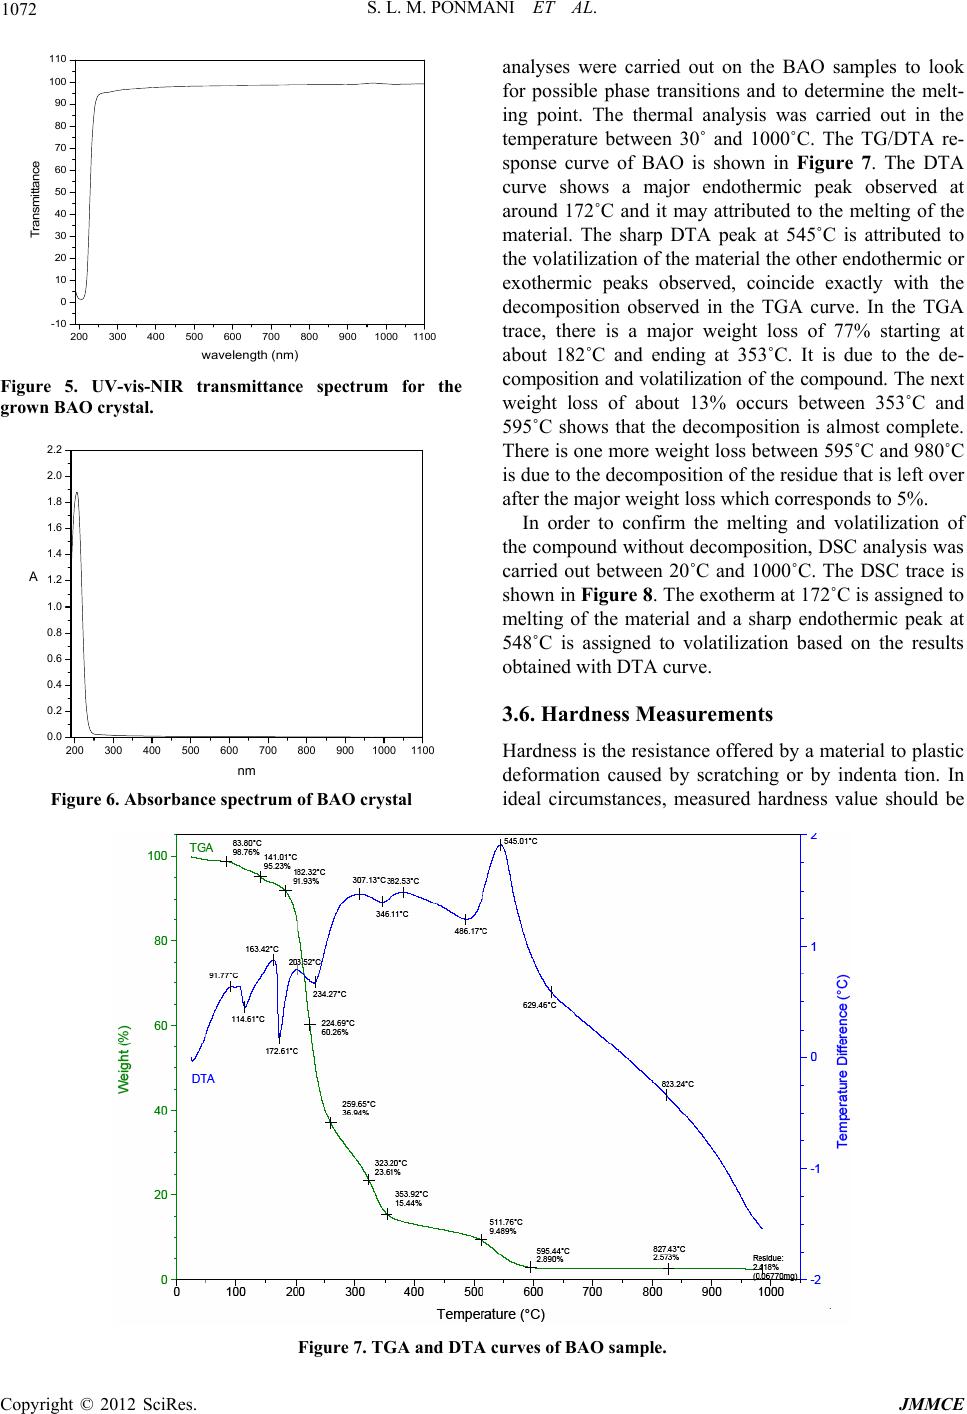 S. L. M. PONMANI ET AL. Copyright © 2012 SciRes. JMMCE 1072 200 300 400 500 600 700 800 9001000110 0 -10 0 10 20 30 40 50 60 70 80 90 100 110 Transmittance wavelength (nm) analyses were carried out on the BAO samples to look for possible phase transitions and to determine the melt- ing point. The thermal analysis was carried out in the temperature between 30˚ and 1000˚C. The TG/DTA re- sponse curve of BAO is shown in Figure 7. The DTA curve shows a major endothermic peak observed at around 172˚C and it may attributed to the melting of the material. The sharp DTA peak at 545˚C is attributed to the volatilization of the material the other endothermic or exothermic peaks observed, coincide exactly with the decomposition observed in the TGA curve. In the TGA trace, there is a major weight loss of 77% starting at about 182˚C and ending at 353˚C. It is due to the de- composition and volatilization of the compound. The next weight loss of about 13% occurs between 353˚C and 595˚C shows that the decomposition is almost complete. There is one more weight loss between 595˚C and 980˚C is due to the decomposition of the residue that is left over after the major weight loss which corresponds to 5%. Figure 5. UV-vis-NIR transmittance spectrum for the grown BAO crystal. 200 300 400 500 600 700 800 90010001100 0.0 0.2 0.4 0.6 0.8 1.0 1.2 1.4 1.6 1.8 2.0 2.2 A nm In order to confirm the melting and volatilization of the compound without decomposition, DSC analysis was carried out between 20˚C and 1000˚C. The DSC trace is shown in Figure 8. The exotherm at 172˚C is assigned to melting of the material and a sharp endothermic peak at 548˚C is assigned to volatilization based on the results obtained with DTA curve. 3.6. Hardness Measurements Hardness is the resistance offered by a material to plastic deformation caused by scratching or by indenta tion. In ideal circumstances, measured hardness value should be Figure 6. Absorbance spectrum of BAO crystal Figure 7. TGA and DTA curves of BAO sample. 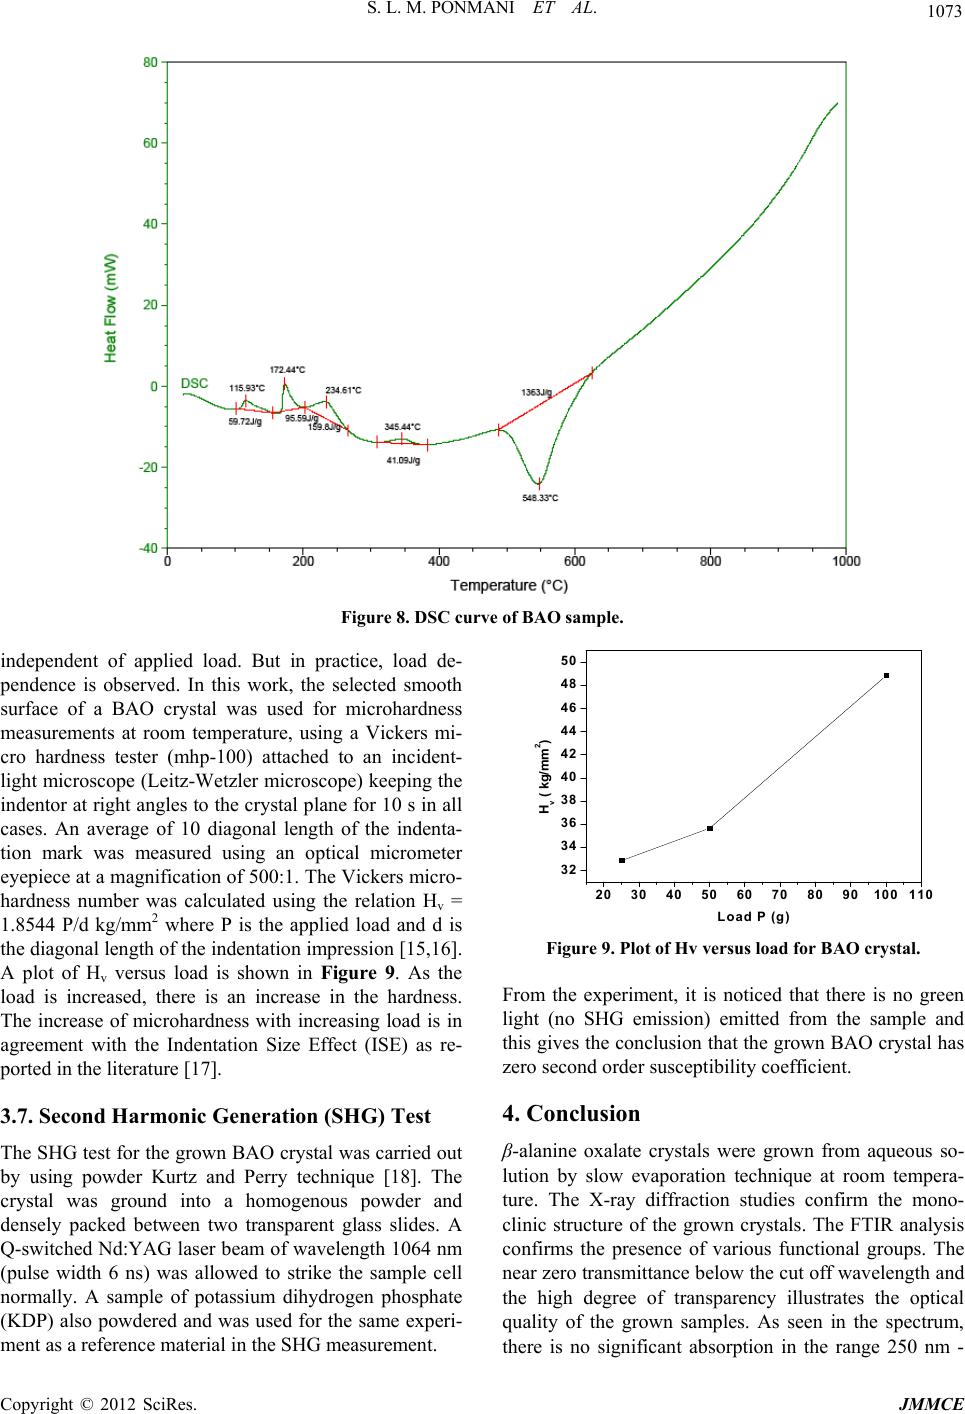 S. L. M. PONMANI ET AL. 1073 Figure 8. DSC curve of BAO sample. independent of applied load. But in practice, load de- pendence is observed. In this work, the selected smooth surface of a BAO crystal was used for microhardness measurements at room temperature, using a Vickers mi- cro hardness tester (mhp-100) attached to an incident- light microscope (Leitz-Wetzler microscope) keeping the indentor at right angles to the crystal plane for 10 s in all cases. An average of 10 diagonal length of the indenta- tion mark was measured using an optical micrometer eyepiece at a magnification of 500:1. The Vickers micro- hardness number was calculated using the relation Hv = 1.8544 P/d kg/mm2 where P is the applied load and d is the diagonal length of the indentation impression [15,16]. A plot of Hv versus load is shown in Figure 9. As the load is increased, there is an increase in the hardness. The increase of microhardness with increasing load is in agreement with the Indentation Size Effect (ISE) as re- ported in the literature [17]. 3.7. Second Harmonic Generation (SHG) Test The SHG test for the grown BAO crystal was carried out by using powder Kurtz and Perry technique [18]. The crystal was ground into a homogenous powder and densely packed between two transparent glass slides. A Q-switched Nd:YAG laser beam of wavelength 1064 nm (pulse width 6 ns) was allowed to strike the sample cell normally. A sample of potassium dihydrogen phosphate (KDP) also powdered and was used for the same experi- ment as a reference material in the SHG measurement. 20 30 40 50 60 70 80 90100110 32 34 36 38 40 42 44 46 48 50 Hv ( kg/mm2) Load P (g) Figure 9. Plot of Hv versus load for BAO crystal. From the experiment, it is noticed that there is no green light (no SHG emission) emitted from the sample and this gives the conclusion that the grown BAO crystal has zero second order susceptibility coefficient. 4. Conclusion β-alanine oxalate crystals were grown from aqueous so- lution by slow evaporation technique at room tempera- ture. The X-ray diffraction studies confirm the mono- clinic structure of the grown crystals. The FTIR analysis confirms the presence of various functional groups. The near zero transmittance below the cut off wavelength and the high degree of transparency illustrates the optical quality of the grown samples. As seen in the spectrum, there is no significant absorption in the range 250 nm - Copyright © 2012 SciRes. JMMCE 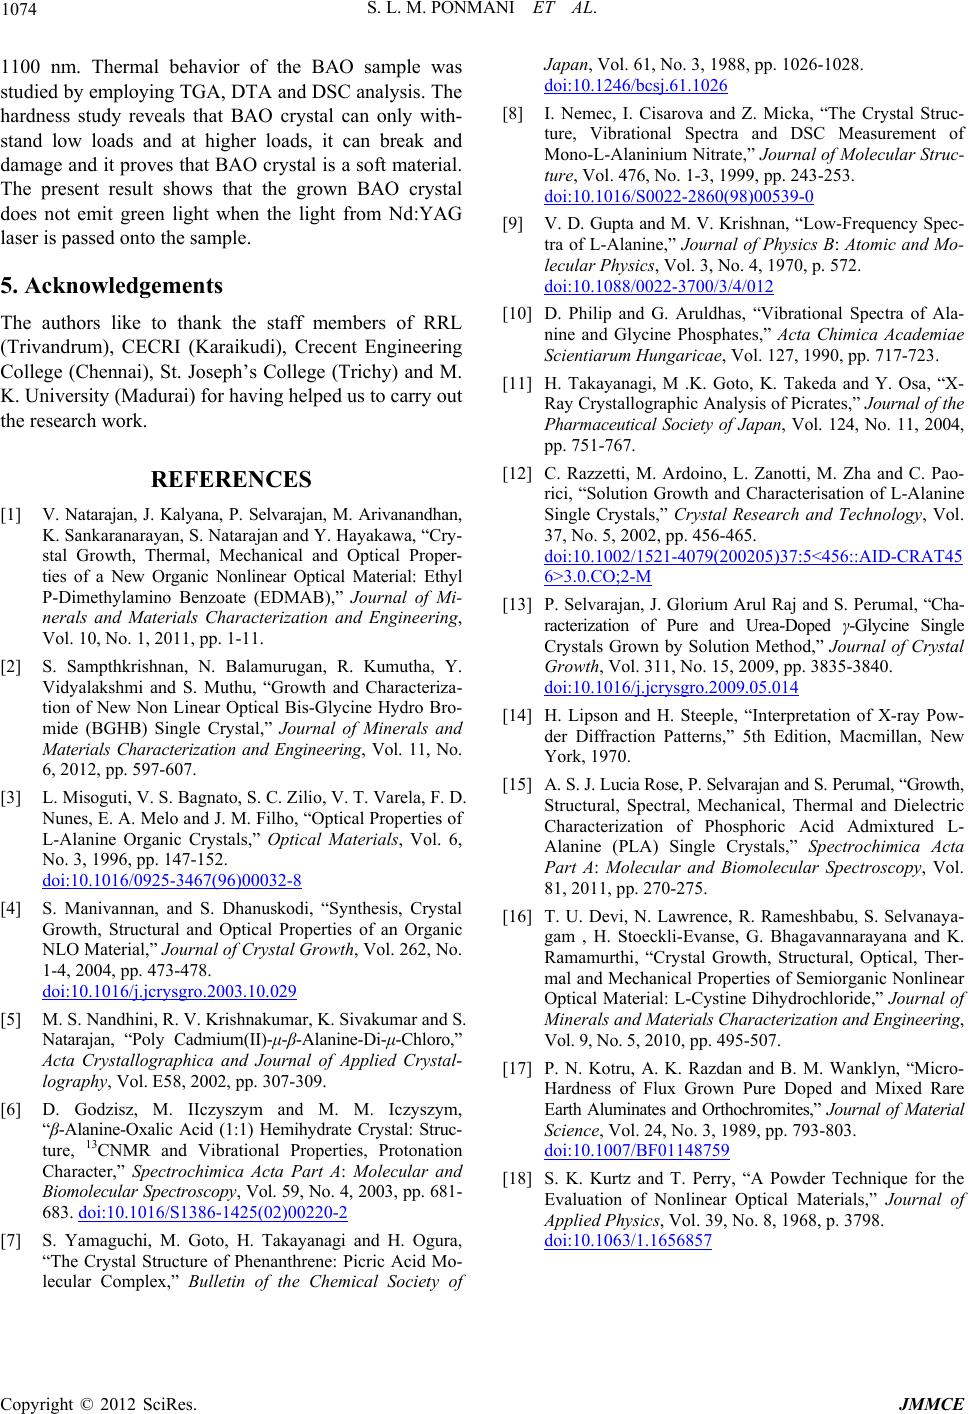 S. L. M. PONMANI ET AL. 1074 1100 nm. Thermal behavior of the BAO sample was studied by employing TGA, DTA and DSC analysis. The hardness study reveals that BAO crystal can only with- stand low loads and at higher loads, it can break and damage and it proves that BAO crystal is a soft material. The present result shows that the grown BAO crystal does not emit green light when the light from Nd:YAG laser is passed onto the sample. 5. Acknowledgements The authors like to thank the staff members of RRL (Trivandrum), CECRI (Karaikudi), Crecent Engineering College (Chennai), St. Joseph’s College (Trichy) and M. K. University (Madurai) for having helped us to carry out the research work. REFERENCES [1] V. Natarajan, J. Kalyana, P. Selvarajan, M. Arivanandhan, K. Sankaranarayan, S. Natarajan and Y. Hayakawa, “Cry- stal Growth, Thermal, Mechanical and Optical Proper- ties of a New Organic Nonlinear Optical Material: Ethyl P-Dimethylamino Benzoate (EDMAB),” Journal of Mi- nerals and Materials Characterization and Engineering, Vol. 10, No. 1, 2011, pp. 1-11. [2] S. Sampthkrishnan, N. Balamurugan, R. Kumutha, Y. Vidyalakshmi and S. Muthu, “Growth and Characteriza- tion of New Non Linear Optical Bis-Glycine Hydro Bro- mide (BGHB) Single Crystal,” Journal of Minerals and Materials Characterization and Engineering, Vol. 11, No. 6, 2012, pp. 597-607. [3] L. Misoguti, V. S. Bagnato, S. C. Zilio, V. T. Varela, F. D. Nunes, E. A. Melo and J. M. Filho, “Optical Properties of L-Alanine Organic Crystals,” Optical Materials, Vol. 6, No. 3, 1996, pp. 147-152. doi:10.1016/0925-3467(96)00032-8 [4] S. Manivannan, and S. Dhanuskodi, “Synthesis, Crystal Growth, Structural and Optical Properties of an Organic NLO Material,” Journal of Crystal Growth, Vol. 262, No. 1-4, 2004, pp. 473-478. doi:10.1016/j.jcrysgro.2003.10.029 [5] M. S. Nandhini, R. V. Krishnakumar, K. Sivakumar and S. Natarajan, “Poly Cadmium(II)-μ-β-Alanine-Di-μ-Chloro,” Acta Crystallographica and Journal of Applied Crystal- lography, Vol. E58, 2002, pp. 307-309. [6] D. Godzisz, M. IIczyszym and M. M. Iczyszym, “β-Alanine-Oxalic Acid (1:1) Hemihydrate Crystal: Struc- ture, 13CNMR and Vibrational Properties, Protonation Character,” Spectrochimica Acta Part A: Molecular and Biomolecular Spectroscopy, Vol. 59, No. 4, 2003, pp. 681- 683. doi:10.1016/S1386-1425(02)00220-2 [7] S. Yamaguchi, M. Goto, H. Takayanagi and H. Ogura, “The Crystal Structure of Phenanthrene: Picric Acid Mo- lecular Complex,” Bulletin of the Chemical Society of Japan, Vol. 61, No. 3, 1988, pp. 1026-1028. doi:10.1246/bcsj.61.1026 [8] I. Nemec, I. Cisarova and Z. Micka, “The Crystal Struc- ture, Vibrational Spectra and DSC Measurement of Mono-L-Alaninium Nitrate,” Journal of Molecular Struc- ture, Vol. 476, No. 1-3, 1999, pp. 243-253. doi:10.1016/S0022-2860(98)00539-0 [9] V. D. Gupta and M. V. Krishnan, “Low-Frequency Spec- tra of L-Alanine,” Journal of Physics B: Atomic and Mo- lecular Physics, Vol. 3, No. 4, 1970, p. 572. doi:10.1088/0022-3700/3/4/012 [10] D. Philip and G. Aruldhas, “Vibrational Spectra of Ala- nine and Glycine Phosphates,” Acta Chimica Academiae Scientiarum Hungaricae, Vol. 127, 1990, pp. 717-723. [11] H. Takayanagi, M .K. Goto, K. Takeda and Y. Osa, “X- Ray Crystallographic Analysis of Picrates,” Journal of the Pharmaceutical Society of Japan, Vol. 124, No. 11, 2004, pp. 751-767. [12] C. Razzetti, M. Ardoino, L. Zanotti, M. Zha and C. Pao- rici, “Solution Growth and Characterisation of L-Alanine Single Crystals,” Crystal Research and Technology, Vol. 37, No. 5, 2002, pp. 456-465. doi:10.1002/1521-4079(200205)37:5<456::AID-CRAT45 6>3.0.CO;2-M [13] P. Selvarajan, J. Glorium Arul Raj and S. Perumal, “Cha- racterization of Pure and Urea-Doped γ-Glycine Single Crystals Grown by Solution Method,” Journal of Crystal Growth, Vol. 311, No. 15, 2009, pp. 3835-3840. doi:10.1016/j.jcrysgro.2009.05.014 [14] H. Lipson and H. Steeple, “Interpretation of X-ray Pow- der Diffraction Patterns,” 5th Edition, Macmillan, New York, 1970. [15] A. S. J. Lucia Rose, P. Selvarajan and S. Perumal, “Growth, Structural, Spectral, Mechanical, Thermal and Dielectric Characterization of Phosphoric Acid Admixtured L- Alanine (PLA) Single Crystals,” Spectrochimica Acta Part A: Molecular and Biomolecular Spectroscopy, Vol. 81, 2011, pp. 270-275. [16] T. U. Devi, N. Lawrence, R. Rameshbabu, S. Selvanaya- gam , H. Stoeckli-Evanse, G. Bhagavannarayana and K. Ramamurthi, “Crystal Growth, Structural, Optical, Ther- mal and Mechanical Properties of Semiorganic Nonlinear Optical Material: L-Cystine Dihydrochloride,” Journal of Minerals and Materials Characterization and Engineering, Vol. 9, No. 5, 2010, pp. 495-507. [17] P. N. Kotru, A. K. Razdan and B. M. Wanklyn, “Micro- Hardness of Flux Grown Pure Doped and Mixed Rare Earth Aluminates and Orthochromites,” Journal of Material Science, Vol. 24, No. 3, 1989, pp. 793-803. doi:10.1007/BF01148759 [18] S. K. Kurtz and T. Perry, “A Powder Technique for the Evaluation of Nonlinear Optical Materials,” Journal of Applied Physics, Vol. 39, No. 8, 1968, p. 3798. doi:10.1063/1.1656857 Copyright © 2012 SciRes. JMMCE |