

Paper Menu >>
Journal Menu >>
 Modern Economy, 2012, 3, 811-816 http://dx.doi.org/10.4236/me.2012.37103 Published Online November 2012 (http://www.SciRP.org/journal/me) The Flypaper and Teflon Effects: Evidence from China* Lyoe Lee, Guillermo Vuletin# Colby College, Waterville, USA Email: #[email protected] Received August 23, 2012; revised September 28, 2012; accepted October 9, 2012 ABSTRACT In this paper, we analyze how public spending responds to income and intergovernmental fiscal transfer shocks in China. Similar to federations around the world, we find the flypaper effect at the provincial level since the country be- came a de facto federation in 1980. Before 1980 we find what we define as the teflon effect at the central government level. We rationalize the latter regularity using collection costs/distortionary taxation arguments. Keywords: Flypaper Effect; Teflon Effect; Fiscal Federalism; Fiscal Reform; China 1. Introduction The flypaper effect is an empirical regularity that refers to the greater responsiveness of subnational government spending to increases in unconditional intergovernmental transfers (hereafter, fiscal transfers) than to increases in private income. The catchy term “flypaper effect” aims to visualize the idea that money sticks where it hits: money from the private sector (i.e., from private income) tends to be spent in the private sector rather than being taxed away, while money from the public sector (i.e., from fiscal transfers) tends to be spent by the public sec- tor rather than being rebated to citizens. This well-known regularity is observed in many federations and at various levels of subnational government. We focus our analysis on China. Since its foundation in 1949 this unitary country has witnessed an intense process of fiscal policy transformation regarding how competencies (i.e., expenditure) and fiscal instruments (i.e., revenue) are allocated across different vertical lev- els of the government. For the period 1949-1979, gov- ernment spending was heavily centralized and an impor- tant bulk of provincial own revenues was remitted to the central government. Figure 1 shows that during this pe- riod central government spending represented, on aver- age, 72 percent of consolidated spending, and central government revenues accounted for 59 percent of con- solidated revenues. This gap was financed with intergov- ernmental transfers from provinces. As Figure 2 shows, provinces remitted 42 percent of their own revenues to the central government. Researchers agree that China started to shift towards a de facto federation in the early 1980s, when the central government initiated a wave of expenditure decentraliza- tion, providing provinces with more discretion over their budget [1-5]. At the same time, revenue collection be- came increasingly centralized. Figure 1 shows that the degree of spending centralization decreased from about 70 percent in early 1970s to 60 percent in early 1990s and further down to 55 percent for late 2000s. On the contrary, the degree of revenue centralization increased from 55 percent in early 1970s to 60 percent in early 1990s and further up to about 70 percent for late 2000s. Indeed, Figure 2 shows that provinces continuously transformed from net remitters of fiscal transfers to net receivers, starting in 19801. Following the 1994 co-participation and tax reforms, central government transfers account for about 64 per- cent of provinces’ spending financing. This figure coin- cides with that of federations (40 percent in Argentina and 60 percent in South Africa and Spain). Exploiting this intense fiscal policy transformation, our paper analyzes how public spending responds to in- come and fiscal transfer shocks. We analyze the behavior of the central government’s spending for the period 1952-1979 and provinces for the period 1980-2008. In each case, own taxation and fiscal transfers financed a majority of public spending. While we observe the fly- *We are grateful to Samara Gunter, Simge Tarhan, Bradley Turner, Andreas Waldkirch, and seminar participants at the 2011 Colby-Bates- Bowdoin Annual Economics Conference for helpful comments and suggestions. #Corres p ondin g autho r . 1The exact transition year from negative to positive provincial vertical fiscal imbalance varies by province. However, with the exception o f few moderate/low income provinces, all of provinces made the defini- tive transition after 1980. C opyright © 2012 SciRes. ME 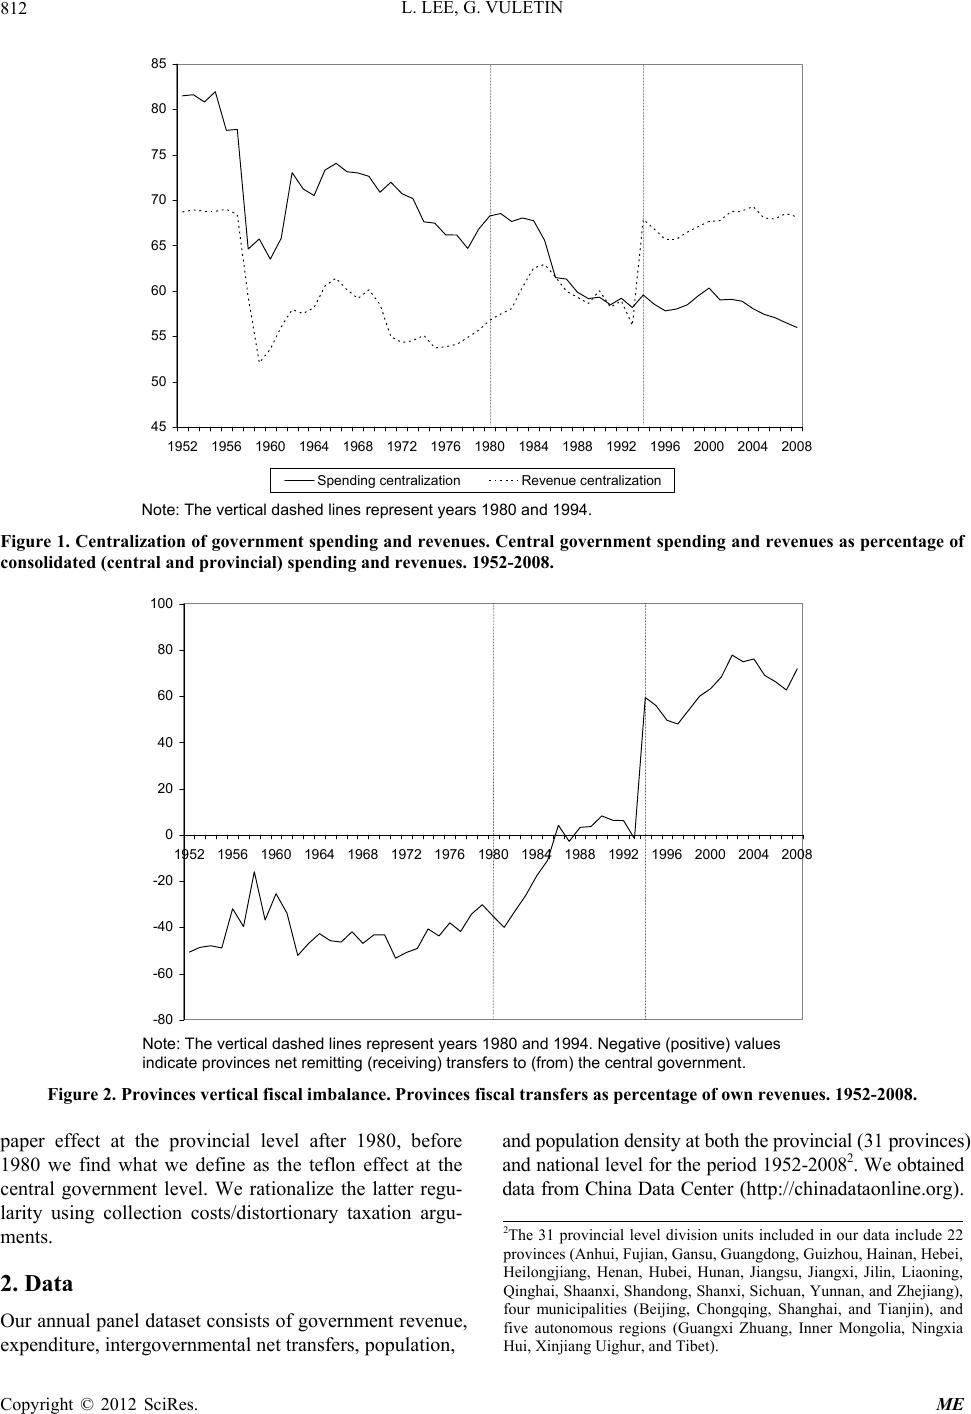 L. LEE, G. VULETIN 812 45 50 55 60 65 70 75 80 85 1952 1956 1960 1964 1968 19721976 1980 1984 1988 1992 1996 2000 2004 2008 Spending centralizationRevenue centralization Note: The vertical dashed lines represent years 1980 and 1994. Figure 1. Centralization of government spending and revenues. Central government spending and revenues as percentage of consolidated (central and provincial) spending and revenues. 1952-2008. -80 -60 -40 -20 0 20 40 60 80 100 1952 1956 1960 1964 1968 1972 1976 19801984 1988 1992 1996 2000 2004 2008 Note: The vertical dashed lines represent years 1980 and 1994. Negative (positive) values indicate provinces net remitting (receiving) transfers to (from) the central government. Figure 2. Provinces vertical fiscal imbalance. Provinces fiscal transfers as percentage of own revenues. 1952-2008. paper effect at the provincial level after 1980, before 1980 we find what we define as the teflon effect at the central government level. We rationalize the latter regu- larity using collection costs/distortionary taxation argu- ments. 2. Data Our annual panel dataset consists of government revenue, expenditure, intergovernmental net transfers, population, and population density at both the provincial (31 provinces) and national level for the period 1952-20082. We obtained data from China Data Center (http://chinadataonline.org). 2The 31 provincial level division units included in our data include 22 p rovinces (Anhui, Fujian, Gansu, Guangdong, Guizhou, Hainan, Hebei, Heilongjiang, Henan, Hubei, Hunan, Jiangsu, Jiangxi, Jilin, Liaoning, Qinghai, Shaanxi, Shandong, Shanxi, Sichuan, Yunnan, and Zhejiang), four municipalities (Beijing, Chongqing, Shanghai, and Tianjin), and five autonomous regions (Guangxi Zhuang, Inner Mongolia, Ningxia Hui, Xinjiang Uighur, and Tibet). Copyright © 2012 SciRes. ME 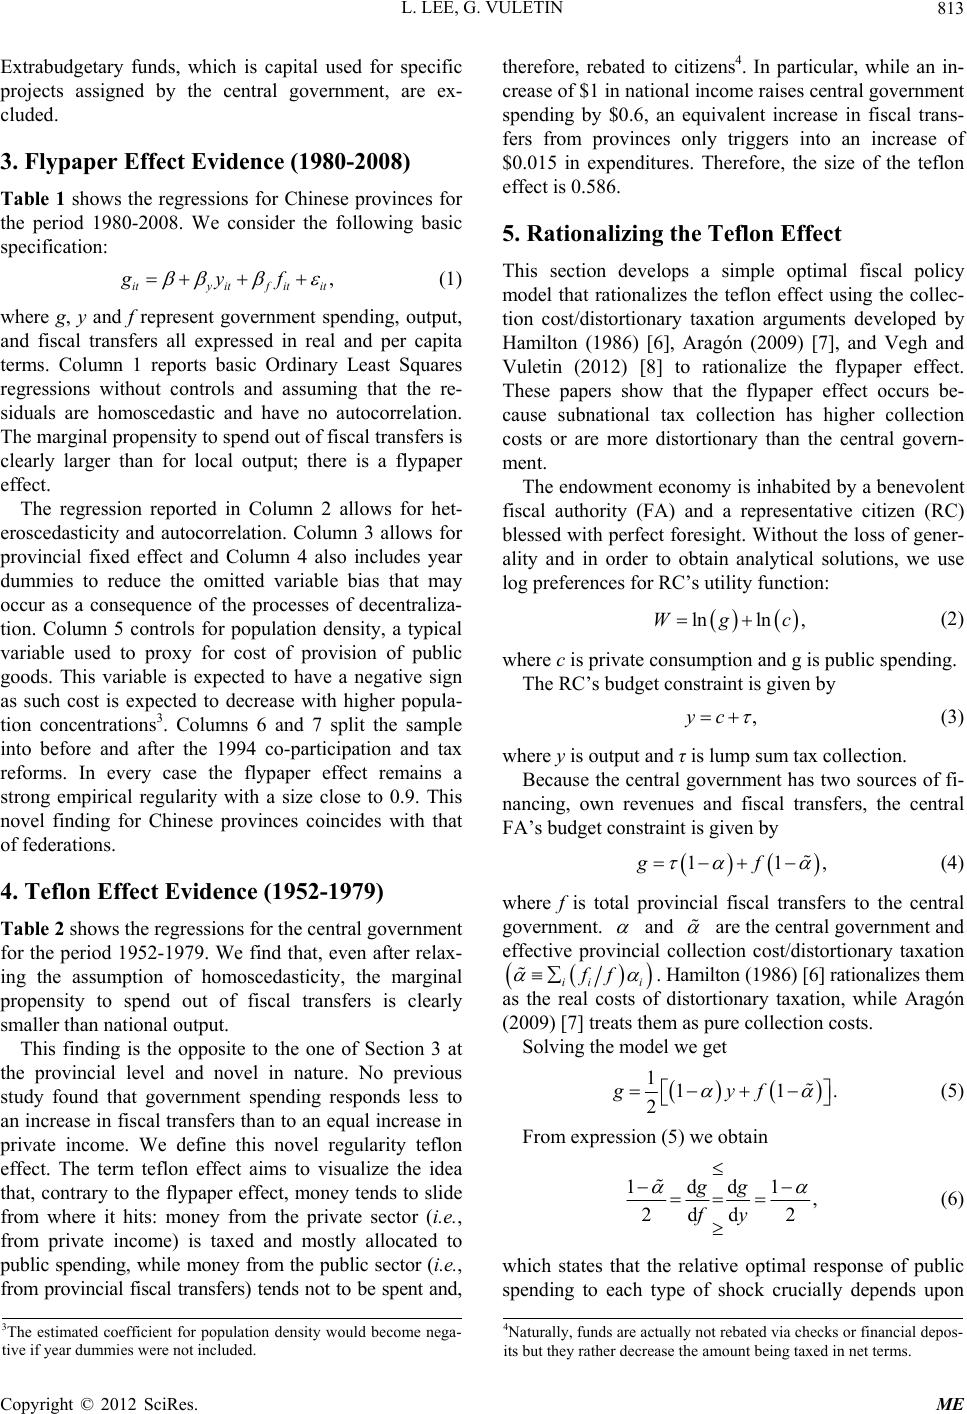 L. LEE, G. VULETIN 813 Extrabudgetary funds, which is capital used for specific projects assigned by the central government, are ex- cluded. 3. Flypaper Effect Evidence (1980-2008) Table 1 shows the regressions for Chinese provinces for the period 1980-2008. We consider the following basic specification: , f itit f ity it gy (1) where g, y and f represent government spending, output, and fiscal transfers all expressed in real and per capita terms. Column 1 reports basic Ordinary Least Squares regressions without controls and assuming that the re- siduals are homoscedastic and have no autocorrelation. The marginal propensity to spend out of fiscal transfers is clearly larger than for local output; there is a flypaper effect. The regression reported in Column 2 allows for het- eroscedasticity and autocorrelation. Column 3 allows for provincial fixed effect and Column 4 also includes year dummies to reduce the omitted variable bias that may occur as a consequence of the processes of decentraliza- tion. Column 5 controls for population density, a typical variable used to proxy for cost of provision of public goods. This variable is expected to have a negative sign as such cost is expected to decrease with higher popula- tion concentrations3. Columns 6 and 7 split the sample into before and after the 1994 co-participation and tax reforms. In every case the flypaper effect remains a strong empirical regularity with a size close to 0.9. This novel finding for Chinese provinces coincides with that of federations. 4. Teflon Effect Evidence (1952-1979) Table 2 shows the regressions for the central government for the period 1952-1979. We find that, even after relax- ing the assumption of homoscedasticity, the marginal propensity to spend out of fiscal transfers is clearly smaller than national output. This finding is the opposite to the one of Section 3 at the provincial level and novel in nature. No previous study found that government spending responds less to an increase in fiscal transfers than to an equal increase in private income. We define this novel regularity teflon effect. The term teflon effect aims to visualize the idea that, contrary to the flypaper effect, money tends to slide from where it hits: money from the private sector (i.e., from private income) is taxed and mostly allocated to public spending, while money from the public sector (i.e., from provincial fiscal transfers) tends not to be spent and, therefore, rebated to citizens4. In particular, while an in- crease of $1 in national income raises central government spending by $0.6, an equivalent increase in fiscal trans- fers from provinces only triggers into an increase of $0.015 in expenditures. Therefore, the size of the teflon effect is 0.586. 5. Rationalizing the Teflon Effect This section develops a simple optimal fiscal policy model that rationalizes the teflon effect using the collec- tion cost/distortionary taxation arguments developed by Hamilton (1986) [6], Aragón (2009) [7], and Vegh and Vuletin (2012) [8] to rationalize the flypaper effect. These papers show that the flypaper effect occurs be- cause subnational tax collection has higher collection costs or are more distortionary than the central govern- ment. The endowment economy is inhabited by a benevolent fiscal authority (FA) and a representative citizen (RC) blessed with perfect foresight. Without the loss of gener- ality and in order to obtain analytical solutions, we use log preferences for RC’s utility function: lnln ,Wg c ,yc (2) where c is private consumption and g is public spending. The RC’s budget constraint is given by (3) where y is output and τ is lump sum tax collection. Because the central government has two sources of fi- nancing, own revenues and fiscal transfers, the central FA’s budget constraint is given by 11,gf (4) where f is total provincial fiscal transfers to the central government. and are the central government and effective provincial collection cost/distortionary taxation ii i ff . Hamilton (1986) [6] rationalizes them as the real costs of distortionary taxation, while Aragón (2009) [7] treats them as pure collection costs. Solving the model we get 111. 2 gyf (5) From expression (5) we obtain 1dd1 , 2dd 2 gg fy (6) which states that the relative optimal response of public spending to each type of shck crucially depends upon o 3The estimated coefficient for population density would become nega- tive if year dummies were not included. 4Naturally, funds are actually not rebated via checks or financial depos- its but they rather decrease the amount being taxed in net terms. Copyright © 2012 SciRes. ME 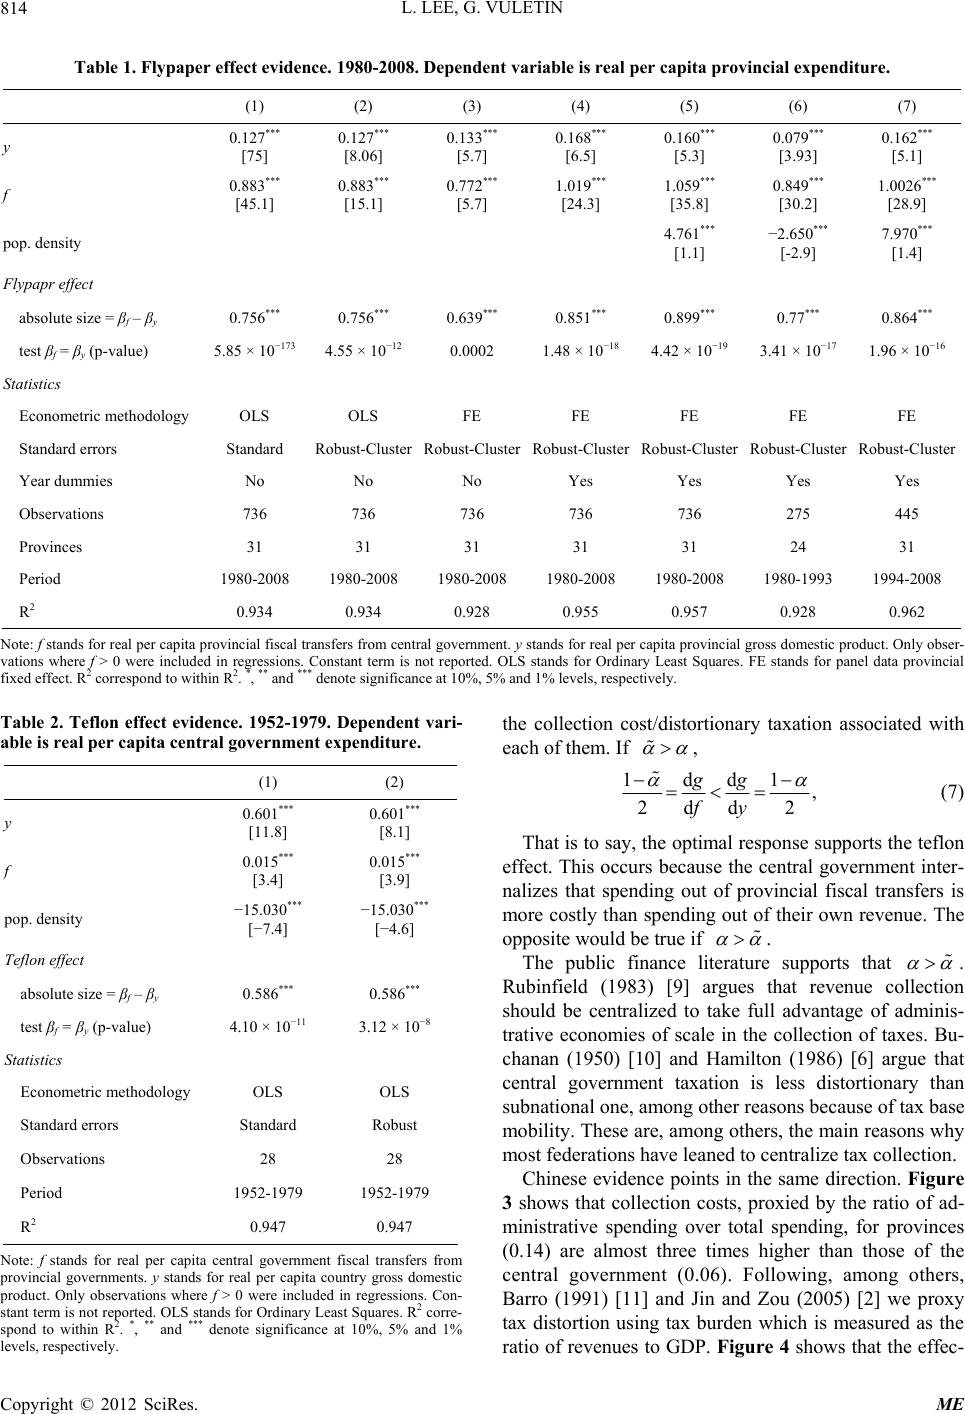 L. LEE, G. VULETIN C© 2012 SciRes. ME 814 Table 1. Flypaper effect evidence. 1980-2008. Dependent variable is real per capita provincial expenditure. (1) (2) (3) (4) (5) (6) (7) y 0.127*** [75] 0.127*** [8.06] 0.133*** [5.7] 0.168*** [6.5] 0.160*** [5.3] 0.079*** [3.93] 0.162*** [5.1] f 0.883*** [45.1] 0.883*** [15.1] 0.772*** [5.7] 1.019*** [24.3] 1.059*** [35.8] 0.849*** [30.2] 1.0026*** [28.9] pop. density 4.761*** [1.1] −2.650*** [-2.9] 7.970*** [1.4] Flypapr effect absolute size = βf – βy 0.756*** 0.756*** 0.639*** 0.851*** 0.899*** 0.77*** 0.864*** test βf = βy (p-value) 5.85 × 10−173 4.55 × 10⁻¹² 0.0002 1.48 × 10⁻¹⁸ 4.42 × 10⁻¹⁹ 3.41 × 10⁻¹⁷ 1.96 × 10⁻¹⁶ Statistics Econometric methodology OLS OLS FE FE FE FE FE Standard errors Standard Robust-ClusterRobust-ClusterRobust-Cluster Robust-Cluster Robust-Cluster Robust-Cluster Year dummies No No No Yes Yes Yes Yes Observations 736 736 736 736 736 275 445 Provinces 31 31 31 31 31 24 31 Period 1980-2008 1980-2008 1980-2008 1980-2008 1980-2008 1980-1993 1994-2008 R2 0.934 0.934 0.928 0.955 0.957 0.928 0.962 Note: f stands for real per capita provincial fiscal transfers from central government. y stands for real per capita provincial gross domestic product. Only obser- vations where f > 0 were included in regressions. Constant term is not reported. OLS stands for Ordinary Least Squares. FE stands for panel data provincial fixed effect. R2 correspond to within R2. *, ** and *** denote significance at 10%, 5% and 1% levels, respectively. Table 2. Teflon effect evidence. 1952-1979. Dependent vari- able is real per capita central government expenditure. the collection cost/distortionary taxation associated with each of them. If , (1) (2) y 0.601*** [11.8] 0.601*** [8.1] f 0.015*** [3.4] 0.015*** [3.9] pop. density −15.030*** [−7.4] −15.030*** [−4.6] Teflon effect absolute size = βf – βy 0.586*** 0.586*** test βf = βy (p-value) 4.10 × 10⁻¹¹ 3.12 × 10⁻⁸ Statistics Econometric methodology OLS OLS Standard errors Standard Robust Observations 28 28 Period 1952-1979 1952-1979 R2 0.947 0.947 opyright Note: f stands for real per capita central government fiscal transfers from provincial governments. y stands for real per capita country gross domestic product. Only observations where f > 0 were included in regressions. Con- stant term is not reported. OLS stands for Ordinary Least Squares. R2 corre- spond to within R2. *, ** and *** denote significance at 10%, 5% and 1% levels, respectively. 1dd1 , 2dd 2 gg fy (7) That is to say, the optimal response supports the teflon effect. This occurs because the central government inter- nalizes that spending out of provincial fiscal transfers is more costly than spending out of their own revenue. The opposite would be true if . The public finance literature supports that . Rubinfield (1983) [9] argues that revenue collection should be centralized to take full advantage of adminis- trative economies of scale in the collection of taxes. Bu- chanan (1950) [10] and Hamilton (1986) [6] argue that central government taxation is less distortionary than subnational one, among other reasons because of tax base mobility. These are, among others, the main reasons why most federations have leaned to centralize tax collection. Chinese evidence points in the same direction. Figure 3 shows that collection costs, proxied by the ratio of ad- ministrative spending over total spending, for provinces (0.14) are almost three times higher than those of the central government (0.06). Following, among others, Barro (1991) [11] and Jin and Zou (2005) [2] we proxy tax distortion using tax burden which is measured as the ratio of revenues to GDP. Figure 4 shows that the effec- 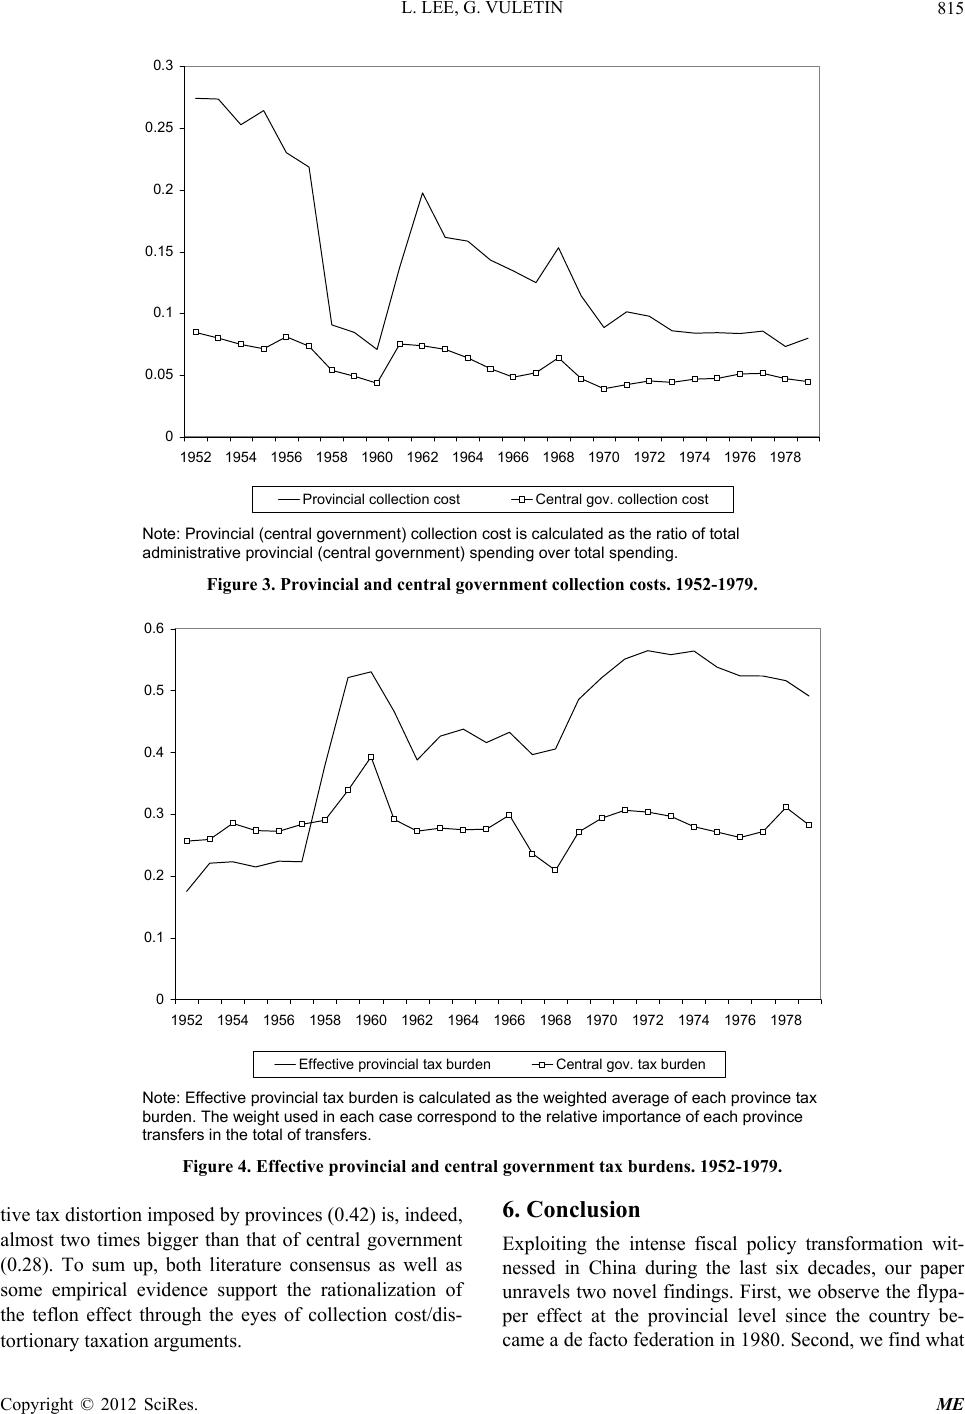 L. LEE, G. VULETIN 815 0 0.05 0.1 0.15 0.2 0.25 0.3 1952 1954 1956 19581960 1962 1964 1966 1968 1970 1972 1974 1976 1978 Provincial collection costCentral gov. collection cost Note: Provincial (central government) collection cost is calculated as the ratio of total administrative provincial (central government) spending over total spending. Figure 3. Provincial and central government collection costs. 1952-1979. 0 0.1 0.2 0.3 0.4 0.5 0.6 1952 1954 1956 1958 1960 1962 1964 1966 1968 1970 1972 1974 1976 1978 Effective provincial tax burdenCentral gov. tax burden Note: Effective provincial tax burden is calculated as the weighted average of each province tax burden. The weight used in each case correspond to the relative importance of each province transfers in the total of transfers. Figure 4. Effective provincial and central government tax burdens. 1952-1979. tive tax distortion imposed by provinces (0.42) is, indeed, almost two times bigger than that of central government (0.28). To sum up, both literature consensus as well as some empirical evidence support the rationalization of the teflon effect through the eyes of collection cost/dis- tortionary taxation arguments. 6. Conclusion Exploiting the intense fiscal policy transformation wit- nessed in China during the last six decades, our paper unravels two novel findings. First, we observe the flypa- per effect at the provincial level since the country be- came a de facto federation in 1980. Second, we find what Copyright © 2012 SciRes. ME 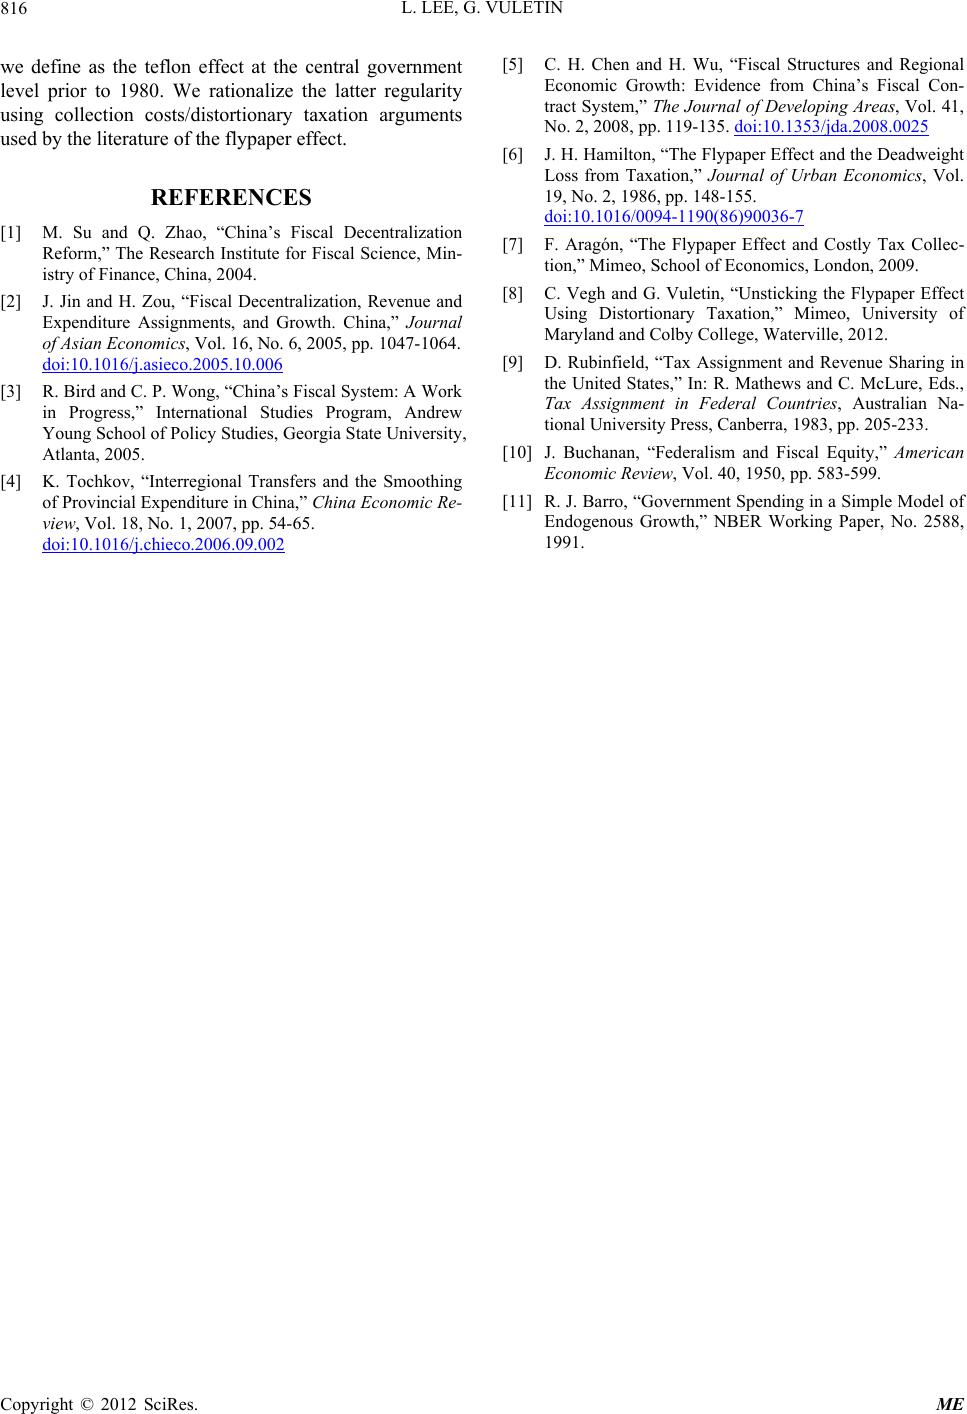 L. LEE, G. VULETIN 816 we define as the teflon effect at the central government level prior to 1980. We rationalize the latter regularity using collection costs/distortionary taxation arguments used by the literature of the flypaper effect. REFERENCES [1] M. Su and Q. Zhao, “China’s Fiscal Decentralization Reform,” The Research Institute for Fiscal Science, Min- istry of Finance, China, 2004. [2] J. Jin and H. Zou, “Fiscal Decentralization, Revenue and Expenditure Assignments, and Growth. China,” Journal of Asian Economics, Vol. 16, No. 6, 2005, pp. 1047-1064. doi:10.1016/j.asieco.2005.10.006 [3] R. Bird and C. P. Wong, “China’s Fiscal System: A Work in Progress,” International Studies Program, Andrew Young School of Policy Studies, Georgia State University, Atlanta, 2005. [4] K. Tochkov, “Interregional Transfers and the Smoothing of Provincial Expenditure in China,” China Economic Re- view, Vol. 18, No. 1, 2007, pp. 54-65. doi:10.1016/j.chieco.2006.09.002 [5] C. H. Chen and H. Wu, “Fiscal Structures and Regional Economic Growth: Evidence from China’s Fiscal Con- tract System,” The Journal of Developing Areas, Vol. 41, No. 2, 2008, pp. 119-135. doi:10.1353/jda.2008.0025 [6] J. H. Hamilton, “The Flypaper Effect and the Deadweight Loss from Taxation,” Journal of Urban Economics, Vol. 19, No. 2, 1986, pp. 148-155. doi:10.1016/0094-1190(86)90036-7 [7] F. Aragón, “The Flypaper Effect and Costly Tax Collec- tion,” Mimeo, School of Economics, London, 2009. [8] C. Vegh and G. Vuletin, “Unsticking the Flypaper Effect Using Distortionary Taxation,” Mimeo, University of Maryland and Colby College, Waterville, 2012. [9] D. Rubinfield, “Tax Assignment and Revenue Sharing in the United States,” In: R. Mathews and C. McLure, Eds., Tax Assignment in Federal Countries, Australian Na- tional University Press, Canberra, 1983, pp. 205-233. [10] J. Buchanan, “Federalism and Fiscal Equity,” American Economic Review, Vol. 40, 1950, pp. 583-599. [11] R. J. Barro, “Government Spending in a Simple Model of Endogenous Growth,” NBER Working Paper, No. 2588, 1991. Copyright © 2012 SciRes. ME |