

Paper Menu >>
Journal Menu >>
 Advances in Physical Education 2012. Vol.2, No.4, 187-196 Published Online November 2012 in SciRes (http://www.SciRP.org/journal/ape) http://dx.doi.org/10.4236/ape.2012.24032 Copyright © 2012 SciRes. 187 Do Anthropometric Measures Influence Torso Muscle Endurance Profiles of Children Aged 7 to 14? Aleksandar Dejanovic1, Erin Harvey2, Jordan Andersen3, Stuart McGill3 1Department of Biochemical and Medicine Science, University of Novi Pazar, Novi Sad, Serbia 2Department of Statistics and Actuarial Science, Faculty of Mathematics, University of Waterloo, Waterloo, Canada 3Department of Kinesiology, Faculty of Applied Health Sciences, University of Waterloo, Waterloo, Canada Email: [email protected] Received August 1st, 2012; revised September 4th, 2012; accepted September 16th, 2012 The aim of this study was to investigate whether torso endurance scores were linked with anthropometric variables in children and to develop a normative scale of anthropometric measures in children in both genders for clinical assessment, rehabilitation, physical education targets and young athletic training pur- poses. It was hypothesized that changes in anthropometric measures through ages 7 to 14 influence en- durance scores in both subsets. It was also hypothesized that boys and girls differ in the relationships be- tween torso muscle endurance and anthropometric measures. Reduced torso muscle endurance has been identified as a potential personal risk factor for developing low back pain and decreased athletic perfor- mance. However, torso muscle endurance data in children is lacking. Further, given that endurance tests require postures where the body is supported horizontally, it makes sense that anthropometric variables would influence endurance. Isometric torso muscle endurance scores established through four tests were performed in random order by healthy children. These were correlated with anthropometric dimensions. Seven hundred and fifty-three children from one elementary school (394 boys and 359 girls) were grouped into 8 age strata (7 to 14). Each age stratum had different number of participants for boys and girls. Four tests established isometric torso muscle endurance: Biering-Sorensen test for extensor endu- rance, flexor endurance test and right and left side bridge tests. The mean, standard deviation of the en- durance tests and anthropometric measures were determined for each gender/age strata. The Pearson product-moment correlation coefficients were determined between the anthropometric dimensions and isometric torso endurance scores for each gender/age strata. Variance in endurance scores were not well explained by anthropometric measures. Variables other than segment length and circumference influence torso endurance as children grow and develop. Given links to future back pain and athletic performance, more investigation would be justified. Keywords: Anthropometric Measures; Torso Muscle Endurance Tests; Correlation; Children Introduction Isometric muscle endurance of the torso has been reported in children (Dejanovic, 2006), adolescents (Salminen et al., 1992) and adults (Biering-Sorensen, 1984; McGill et al., 1999). These values are important as they have been identified as potential risk factors for developing low back pain and decreased athletic performance. Given that endurance test postures require the body to be supported horizontally, it makes sense that anthro- pometrics would influence endurance. It has been shown that correlations between some anthro- pometric measures and fitness variables, such as strength, are important. Evidence indicates that body weight and height, among children, are correlated with grip strength across several populations (Everett & Sills, 1952; Johnson, 1925; Metheny, 1941). Further, there is general agreement that strength and endurance are also important for motor development in children. For example, Rarick and Dobbins (1975) emphasized strength and its relationship to body size as major factors in physical performance and that excess of body fat decreased motor per- formances in children aged 6 - 9. Gabbard and Patterson (1980), however, noted low correlations between muscular endurance, body weight and height among children aged 3 - 5. Specifically, a several reports suggested that endurance scores were lower in tall and high body mass children (Docherty & Gaul, 1991; Slaughter et al., 1977). Furthermore, Jürimäe and Jürimäe (2000) found no correlation between Eurofit test results and body height in boys while there was a relationship in girls. In fact, longitudinal body dimensions in pre-pubertal girls had more influences on motor ability tests when compared with boys. The current study was conducted to investigate the links be- tween selected anthropometric measures and isometric torso muscle endurance in boys and girls aged 7 to 14. Another goal of this study was to develop a database of these measures for children. It was hypothesized that changes in torso endurance scores are associated with anthropometric measures. It was also hypothesized that boys and girls differ in the relationship be- tween torso muscle endurance and anthropometric measures. Methods Anthropometric measurements and torso muscle endurance were obtained from boys and girls at an elementary school us-  A. DEJANOVIC ET AL. ing previously established protocols (Dejanovic et al., 2012) but which are repeated here. First, confirm that you have the correct template for your paper size. This template has been tailored for output on the custom paper size (21 cm * 28.5 cm). Subjects Seven hundred and fifty-three children (394 boys and 359 girls) aged 7 - 14 years from a Serbian elementary school took part. The testing and data collection methods were presented to, and approved by, the Parents’ Committee of the elementary school, City of Novi Sad, Republic of Serbia, as well as from the Teaching and Scientific Council, Faculty of Sport and Physical Education in Nis, Department for Applied Kinesiology, University of Nis, Republic of Serbia. All parents signed in- formed consent documents prior to data collection. To reduce risk of injury and psychological distress, each test was ex- plained and demonstrated in front of the children. The inclusion criteria for participants were: aged from 7 to 14 years; no cur- rent or previous history of neurological or orthopaedic pro- blems of the spine and hips; no upper or lower musculoskeletal disorders or injuries; prior to testing, all subjects needed to feel healthy, which was confirmed verbally before the testing ses- sion. Instrumentation For the anthropometric measurements, the following stan- dard instruments were used: Segment lengths were measured using the Martin anthropometer, scaled 0 - 200 cm with a read- ing accuracy of 0.1 cm. A balance beam scale, accurate to 0.1 kg, measured participants’ weight. Measuring tape 150 cm in length was used to measure segment circumferences, accurate to 0.1 cm. Finally, Martin sliding calipers with ranges of 0 - 40 cm and 0 - 20 cm were used for segment girth measurements, also accurate to 0.1 cm. Data Collection Torso Muscle Endurance Tests Four tests were used to measure isometric torso muscle en- durance after McGill et al. (1999): Biering-Sorensen test, torso flexor endurance test and right and left lateral torso test. McGill et al. found these tests to be reliable with a reliability coeffi- cient >0.97 when tested consecutively over a five-day period. Evans and colleagues (2007) documented high reliability of the lateral endurance tests. Back Extension Test (BET): The Biering-Sorensen test was used to measure back torso muscle endurance. Participants lay on their front with their hips (anterior superior iliac spine (ASIS)) in-line with the edge of a test bench (150 × 110 × 50 cm) so that the upper body was cantilevered out over the end, holding their arms across the chest. To keep the participant in place, the pelvis, knees and hips were secured with padded straps or a research assistant held both ankles. The test ended when the participant could no longer maintain a horizontal position or when they reached 300 seconds. During the test, participants were allowed to be verbally corrected twice to maintain a horizontal position and the test ended on the third correction. Flexor Endurance Test (FET): Participants adopted a sit-up position with arms placed across the chest. The feet were se- cured under toe straps or by a researcher and the back began resting against a jig angled 50˚ from the floor with knees and hips flexed at 90˚. To begin, the jig was pulled back 10 cm while the subject held this position for as long as possible. The test was stopped when the participants’ back touched the jig or when a maximum time of 300 seconds was reached. Left and Right Side Bridge Tests (LS & RS): Lateral torso muscle endurance was tested with the subject lying in the full side-bridge position. Legs were extended, the top foot was placed in the front of the lower foot for support and the partici- pant was asked to bridge up with the elbow while holding their hips off the floor. The test was terminated when the subject lost a straight back posture or when a maximum time of 300 se- conds was reached. Anthropometric Measures The following parameters were used to evaluate the anthro- pometric measurements: 1) longitudinal dimensions—body height, sitting height, upper arm length, arm length and leg length; 2) transversal dimensions—shoulder diameter (bia- cromial diameter), pelvic width (bicristal diameter) and knee diameter; 3) circumferential dimensions—upper arm, forearm, chest, waist, hips, upper leg and calf; and 4) body weight. Body weight was measured to the closest 0.5 kg. All other measure- ments were taken to the closest 0.1 cm. Anthropometric mea- surements were carried out in accordance with the guidelines of the International Biological Program (Lohman et al., 1988). Body height was measured with participants standing bare- foot in an upright position. A measurement was taken from the floor to the top of the participant’s head in a neutral position. Sitting height was done with participants in a flat-seated chair with his or her back in a neutral position. A measurement was taken from the seat of the chair to the top of the participants’ head. For the upper arm, a measurement was taken from the acromion to the olecranon with the elbow flexed at 90˚ and the palm facing up. Arm length was taken from the acromion to the tip of the middle finger when the arm was in front of the par- ticipant parallel to the ground with the palm facing up. Leg length was taken from the floor to the ASIS when the partici- pant was standing upright. Shoulder and pelvic diameter were measured with the Martin sliding caliper. With the participant in an upright standing posi- tion, the anthropometer was placed on the outer part of both acromia for the shoulders and at the top of the iliac crest for the pelvis. Knee diameter was taken around the level of the epi- condyles of the femur with the participant in a seated position and the knee bent to 90˚. All circumference measurements were carried out with the participants in an upright standing posture, except for the calf that was done in a seated position. The upper arm measurement was taken midway between the acromion and the olecranon. The forearm, upper leg and calf measurements were taken at the level of greatest circumference of the segment. Circumfer- ence of the chest was taken from between the attachment of the 3rd and 4th ribs around to the sternum. A measurement was taken at the end of a normal exhalation. Waist circumference was taken at the level of the umbilicus and hip circumference was measured at the greatest circumference of the gluteal mus- cles. Body weight was measured with the participant in a quiet, upright standing posture. Copyright © 2012 SciRes. 188 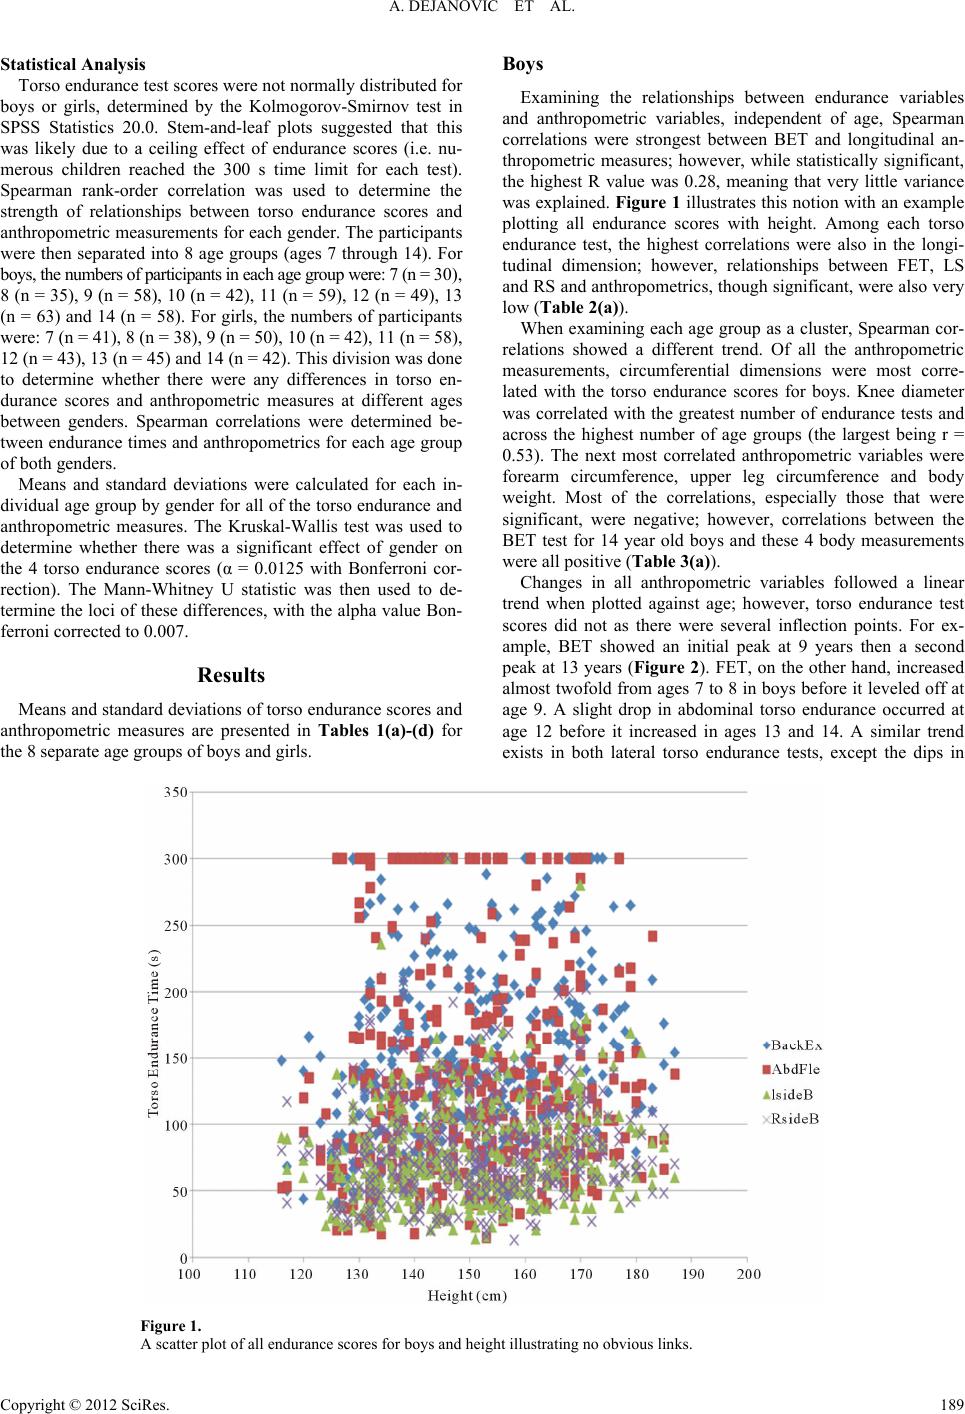 A. DEJANOVIC ET AL. Copyright © 2012 SciRes. 189 Boys Statistical Analysis Torso endurance test scores were not normally distributed for boys or girls, determined by the Kolmogorov-Smirnov test in SPSS Statistics 20.0. Stem-and-leaf plots suggested that this was likely due to a ceiling effect of endurance scores (i.e. nu- merous children reached the 300 s time limit for each test). Spearman rank-order correlation was used to determine the strength of relationships between torso endurance scores and anthropometric measurements for each gender. The participants were then separated into 8 age groups (ages 7 through 14). For boys, the numbers of participants in each age group were: 7 (n = 30), 8 (n = 35), 9 (n = 58), 10 (n = 42), 11 (n = 59), 12 (n = 49), 13 (n = 63) and 14 (n = 58). For girls, the numbers of participants were: 7 (n = 41), 8 (n = 38), 9 (n = 50), 10 (n = 42), 11 (n = 58), 12 (n = 43), 13 (n = 45) and 14 (n = 42). This division was done to determine whether there were any differences in torso en- durance scores and anthropometric measures at different ages between genders. Spearman correlations were determined be- tween endurance times and anthropometrics for each age group of both genders. Examining the relationships between endurance variables and anthropometric variables, independent of age, Spearman correlations were strongest between BET and longitudinal an- thropometric measures; however, while statistically significant, the highest R value was 0.28, meaning that very little variance was explained. Figure 1 illustrates this notion with an example plotting all endurance scores with height. Among each torso endurance test, the highest correlations were also in the longi- tudinal dimension; however, relationships between FET, LS and RS and anthropometrics, though significant, were also very low (Table 2(a)). When examining each age group as a cluster, Spearman cor- relations showed a different trend. Of all the anthropometric measurements, circumferential dimensions were most corre- lated with the torso endurance scores for boys. Knee diameter was correlated with the greatest number of endurance tests and across the highest number of age groups (the largest being r = 0.53). The next most correlated anthropometric variables were forearm circumference, upper leg circumference and body weight. Most of the correlations, especially those that were significant, were negative; however, correlations between the BET test for 14 year old boys and these 4 body measurements were all positive (Table 3(a)). Means and standard deviations were calculated for each in- dividual age group by gender for all of the torso endurance and anthropometric measures. The Kruskal-Wallis test was used to determine whether there was a significant effect of gender on the 4 torso endurance scores (α = 0.0125 with Bonferroni cor- rection). The Mann-Whitney U statistic was then used to de- termine the loci of these differences, with the alpha value Bon- ferroni corrected to 0.007. Changes in all anthropometric variables followed a linear trend when plotted against age; however, torso endurance test scores did not as there were several inflection points. For ex- ample, BET showed an initial peak at 9 years then a second peak at 13 years (Figure 2). FET, on the other hand, increased almost twofold from ages 7 to 8 in boys before it leveled off at age 9. A slight drop in abdominal torso endurance occurred at age 12 before it increased in ages 13 and 14. A similar trend exists in both lateral torso endurance tests, except the dips in Results Means and standard deviations of torso endurance scores and anthropometric measures are presented in Tables 1(a)-(d) for the 8 separate age groups of boys and girls. Figure 1. A scatter plot of all endurance scores for boys and height illustrating no obvious links. 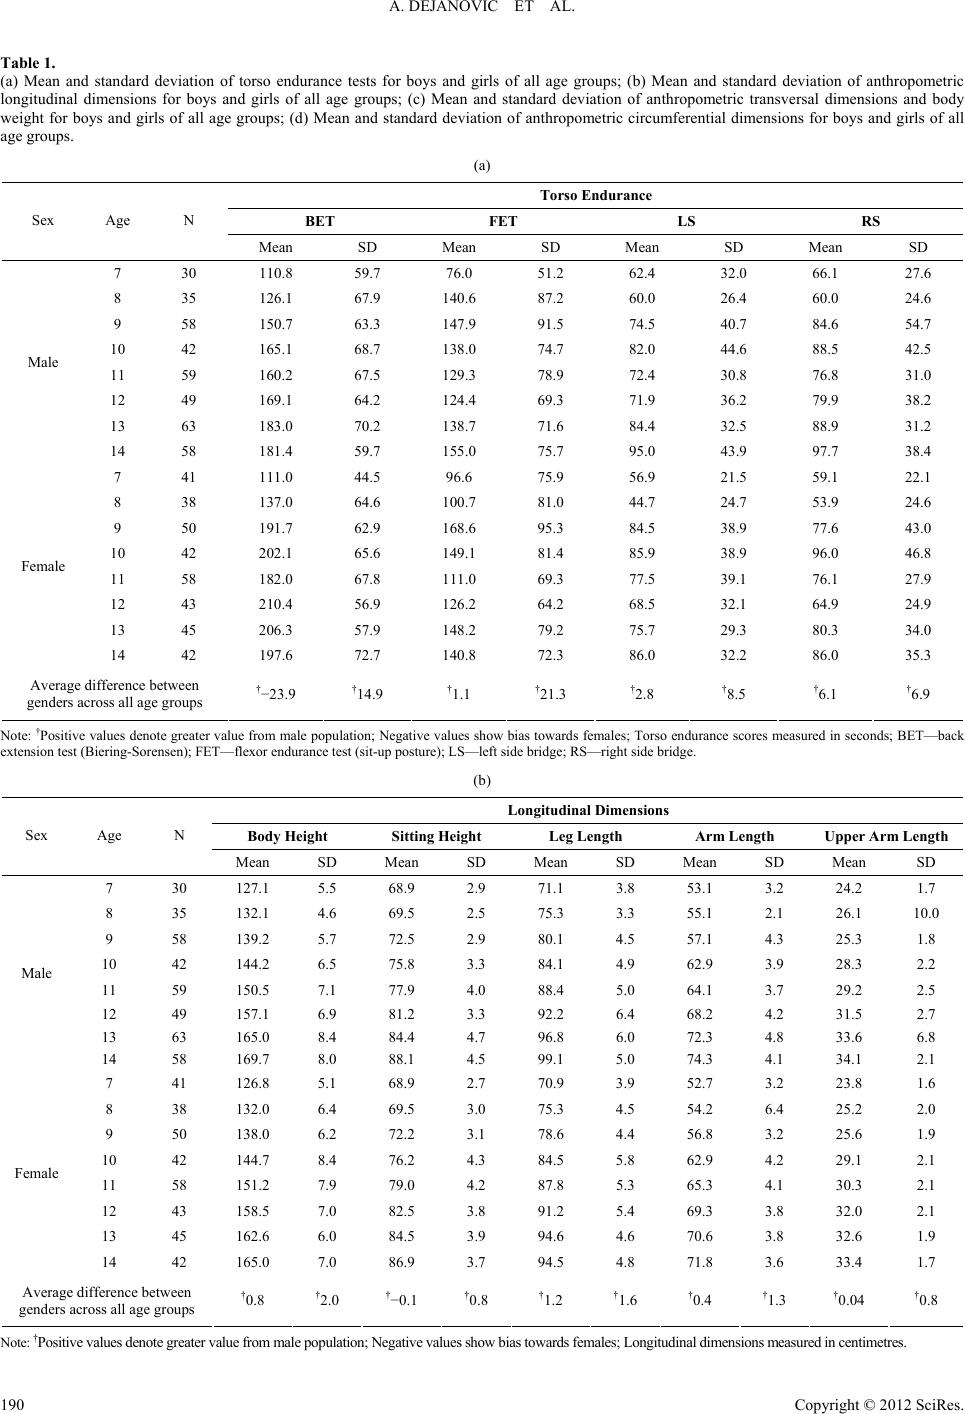 A. DEJANOVIC ET AL. Table 1. (a) Mean and standard deviation of torso endurance tests for boys and girls of all age groups; (b) Mean and standard deviation of anthropometric longitudinal dimensions for boys and girls of all age groups; (c) Mean and standard deviation of anthropometric transversal dimensions and body weight for boys and girls of all age groups; (d) Mean and standard deviation of anthropometric circumferential dimensions for boys and girls of all age groups. (a) Torso Endurance BET FET LS RS Sex Age N Mean SD Mean SD Mean SD Mean SD 7 30 110.8 59.7 76.0 51.2 62.4 32.0 66.1 27.6 8 35 126.1 67.9 140.6 87.2 60.0 26.4 60.0 24.6 9 58 150.7 63.3 147.9 91.5 74.5 40.7 84.6 54.7 10 42 165.1 68.7 138.0 74.7 82.0 44.6 88.5 42.5 11 59 160.2 67.5 129.3 78.9 72.4 30.8 76.8 31.0 12 49 169.1 64.2 124.4 69.3 71.9 36.2 79.9 38.2 13 63 183.0 70.2 138.7 71.6 84.4 32.5 88.9 31.2 Male 14 58 181.4 59.7 155.0 75.7 95.0 43.9 97.7 38.4 7 41 111.0 44.5 96.6 75.9 56.9 21.5 59.1 22.1 8 38 137.0 64.6 100.7 81.0 44.7 24.7 53.9 24.6 9 50 191.7 62.9 168.6 95.3 84.5 38.9 77.6 43.0 10 42 202.1 65.6 149.1 81.4 85.9 38.9 96.0 46.8 11 58 182.0 67.8 111.0 69.3 77.5 39.1 76.1 27.9 12 43 210.4 56.9 126.2 64.2 68.5 32.1 64.9 24.9 13 45 206.3 57.9 148.2 79.2 75.7 29.3 80.3 34.0 Female 14 42 197.6 72.7 140.8 72.3 86.0 32.2 86.0 35.3 Average difference between genders across all age groups †−23.9 †14.9 †1.1 †21.3 †2.8 †8.5 †6.1 †6.9 Note: †Positive values denote greater value from male population; Negative values show bias towards females; Torso endurance scores measured in seconds; BET—back extension test (Biering-Sorensen); FET—flexor endurance test (sit-up posture); LS—left side bridge; RS—right side bridge. (b) Longitudinal Dimensions Body Height Sitting Height Leg Length Arm Length Upper Arm Length Sex Age N Mean SD Mean SD Mean SD Mean SD Mean SD 7 30 127.1 5.5 68.9 2.9 71.1 3.8 53.1 3.2 24.2 1.7 8 35 132.1 4.6 69.5 2.5 75.3 3.3 55.1 2.1 26.1 10.0 9 58 139.2 5.7 72.5 2.9 80.1 4.5 57.1 4.3 25.3 1.8 10 42 144.2 6.5 75.8 3.3 84.1 4.9 62.9 3.9 28.3 2.2 11 59 150.5 7.1 77.9 4.0 88.4 5.0 64.1 3.7 29.2 2.5 12 49 157.1 6.9 81.2 3.3 92.2 6.4 68.2 4.2 31.5 2.7 13 63 165.0 8.4 84.4 4.7 96.8 6.0 72.3 4.8 33.6 6.8 Male 14 58 169.7 8.0 88.1 4.5 99.1 5.0 74.3 4.1 34.1 2.1 7 41 126.8 5.1 68.9 2.7 70.9 3.9 52.7 3.2 23.8 1.6 8 38 132.0 6.4 69.5 3.0 75.3 4.5 54.2 6.4 25.2 2.0 9 50 138.0 6.2 72.2 3.1 78.6 4.4 56.8 3.2 25.6 1.9 10 42 144.7 8.4 76.2 4.3 84.5 5.8 62.9 4.2 29.1 2.1 11 58 151.2 7.9 79.0 4.2 87.8 5.3 65.3 4.1 30.3 2.1 12 43 158.5 7.0 82.5 3.8 91.2 5.4 69.3 3.8 32.0 2.1 13 45 162.6 6.0 84.5 3.9 94.6 4.6 70.6 3.8 32.6 1.9 Female 14 42 165.0 7.0 86.9 3.7 94.5 4.8 71.8 3.6 33.4 1.7 Average difference between genders across all age groups †0.8 †2.0 †−0.1 †0.8 †1.2 †1.6 †0.4 †1.3 †0.04 †0.8 Note: †Positive values denote greater value from male population; Negative values show bias towards females; Longitudinal dimensions measured in centimetres. Copyright © 2012 SciRes. 190  A. DEJANOVIC ET AL. (c) Transversal Dimensions Body Weight Shoulder Diameter Pelvis Diameter Knee Diameter Sex Age N Mean SD Mean SD Mean SD Mean SD 7 30 27.6 1.5 19.2 1.1 8.3 0.7 26.4 4.5 8 35 28.7 1.5 19.7 1.1 8.5 0.7 30.1 4.7 9 58 30.0 1.5 20.6 1.3 8.8 0.7 35.1 6.4 10 42 30.5 3.8 21.6 1.7 8.7 0.9 39.0 9.1 11 59 32.2 2.1 21.7 1.8 9.8 1.0 44.7 10.9 12 49 34.0 2.0 23.4 1.7 9.6 0.9 48.4 10.3 13 63 35.3 2.3 23.6 1.7 9.9 0.9 54.4 12.1 Male 14 58 35.6 2.5 24.7 2.5 10.0 0.8 57.0 9.1 7 41 26.9 1.3 18.9 1.1 8.0 0.7 26.2 4.1 8 38 28.7 1.5 19.8 1.3 8.2 0.7 29.3 5.3 9 50 29.3 1.6 20.6 1.5 8.6 0.8 33.0 7.5 10 42 29.7 2.3 21.4 1.8 8.3 0.9 37.2 8.3 11 58 31.8 2.0 22.6 2.0 9.2 0.8 42.9 9.2 12 43 33.0 2.6 24.2 3.7 9.0 0.9 47.0 8.6 13 45 34.6 1.6 24.6 1.6 9.5 1.0 53.1 10.1 Female 14 42 34.2 2.2 24.9 1.7 9.2 0.7 54.6 8.8 Average difference between genders across all age groups †0.7 †0.4 †−0.3 †0.5 †0.5 †0.2 †1.5 †0.7 Note: †Positive values denote greater value from male population; Negative values show bias towards females; Transversal dimensions measured in centimeters; Body weight measured in kilograms. (d) Circumferential Dimensions Chest Circumference Upper Arm Circumference Forearm Circumference Hip Circumference Waist Circumference Upper Leg Circumference Calf Circumference Sex Age N Mean SD Mean SD Mean SD Mean SD MeanSD Mean SD MeanSD 7 30 61.6 4.2 18.1 2.1 17.91.8 65.7 5.3 55.7 5.1 37.2 3.6 25.4 2.5 8 35 64.4 4.8 19.4 1.9 19.11.5 69.1 5.2 59.1 4.9 39.7 4.1 26.9 1.9 9 58 68.8 5.6 20.0 2.1 19.51.4 73.2 6.3 62.3 6.9 43.6 4.9 28.6 2.5 10 42 72.0 7.9 21.1 2.8 20.52.0 75.4 8.3 65.2 9.5 43.0 6.7 28.9 3.1 11 59 74.3 7.6 22.1 3.1 20.62.0 81.1 8.6 67.1 8.7 48.0 6.7 31.0 3.3 12 49 76.7 7.0 22.9 3.2 21.82.0 81.1 9.2 67.3 7.6 47.7 8.8 31.1 3.4 13 63 78.8 7.9 23.7 3.2 22.42.2 86.6 8.4 69.6 7.5 51.0 8.6 33.3 3.8 Male 14 58 80.6 7.2 24.0 2.4 23.21.9 86.0 7.4 69.1 5.1 48.4 5.3 33.3 2.9 7 41 60.9 4.1 18.8 1.9 17.81.3 66.6 4.9 54.8 4.3 39.0 3.8 25.9 1.9 8 38 63.6 4.8 19.1 2.1 18.31.6 69.8 5.6 57.2 5.4 40.3 4.2 26.9 2.2 9 50 66.0 6.4 19.6 2.8 18.91.9 72.9 7.6 57.5 7.0 42.8 5.5 27.9 2.7 10 42 70.0 6.9 20.6 2.5 19.82.0 75.8 7.3 60.5 6.7 43.7 5.1 28.4 3.1 11 58 74.3 7.9 22.4 3.1 20.92.0 80.5 8.1 63.4 8.4 46.1 6.4 30.9 3.3 12 43 78.2 7.0 23.2 3.0 21.52.1 83.1 6.9 64.1 5.6 48.8 5.3 31.9 3.3 13 45 80.4 6.8 23.4 3.1 21.52.1 89.1 8.3 66.0 6.5 51.5 6.0 33.3 2.9 Female 14 42 84.2 5.7 23.5 2.4 22.11.9 85.2 7.9 67.3 6.7 53.4 5.1 32.7 3.4 Average difference between genders across all age groups †−0.1 †2.1 †0.1 †0.5 †0.5 †0.4 †−0.6 †1.2 †3.1 †1.4 †−0.9 †2.0 †0.1 †0.5 Note: †Positive values denote greater value from male population; Negative values show bias towards females; Circumferential dimensions measured in centi- metres. Copyright © 2012 SciRes. 191  A. DEJANOVIC ET AL. Table 2. (a) Correlation values between torso endurance scores and anthropometric measurements for boys; (b) Correlation values between torso endurance scores and anthropometric measurements for girls. (a) Longitudinal Dimensions Transversal Dimensions Boys Body HeightSitting Height Leg LengthArm LengthUpper Arm Length Shoulder Diameter Pelvis Diameter Knee Diameter R 0.27** 0.25** 0.26** 0.28** 0.27** 0.26** 0.23** 0.09 BET alpha <0.001 <0.001 <0.001 <0.001 <0.001 <0.001 <0.001 0.09 R 0.09 0.10 0.09 0.08 0.08 0.06 0.03 −0.04 FET alpha 0.08 0.06 0.07 0.12 0.13 0.23 0.55 0.40 R 0.16** 0.18** 0.13** 0.15** 0.16** 0.15** 0.10* −0.05 LS alpha <0.001 <0.001 0.01 <0.001 <0.001 <0.001 0.04 0.35 R 0.13** 0.14** 0.11* 0.13* 0.10* 0.12* 0.05 −0.09 RS alpha <0.001 <0.001 0.03 0.01 0.04 0.02 0.29 0.09 Circumferential Dimensions Boys Chest Circumference Upper Arm Circumference Forearm Circumference Hip Circumference Waist Circumference Upper Leg Circumference Calf Circumference Body Weight R 0.12* 0.04 0.06 0.11* 0.05 0.06 0.11* 0.16** BET alpha 0.01 0.46 0.24 0.03 0.37 0.25 0.04 <0.001 R 0.00 −0.03 −0.04 0.00 −0.03 −0.01 −0.03 0.01 FET alpha 0.98 0.51 0.47 0.96 0.56 0.80 0.57 0.77 R 0.05 −0.04 0.04 −0.01 −0.07 −0.06 0.02 0.03 LS alpha 0.37 0.40 0.45 0.87 0.15 0.23 0.76 0.50 R −0.01 −0.10* −0.03 −0.05 −0.12* −0.09 −0.04 −0.02 RS alpha 0.91 0.05 0.60 0.35 0.01 0.08 0.42 0.74 Note: Statistically significant (*p < 0.05, **p < 0.01); BET—back extension test (Biering-Sorensen); FET—flexor endurance test (sit-up posture); LS—left side bridge; RS—right side bridge. (b) Longitudinal Dimensions Transversal Dimensions Girls Body Height Sitting Height Leg Length Arm Length Upper Arm Length Shoulder Diameter Pelvis Diameter Knee Diameter R 0.35** 0.32** 0.37** 0.35** 0.34** 0.30** 0.26** 0.17** BET alpha <0.001 <0.001 <0.001 <0.001 <0.001 <0.001 <0.001 0.001 R 0.16** 0.14** 0.17** 0.13* 0.15** 0.101 0.090 0.048 FET alpha 0.002 0.007 0.002 0.012 0.004 0.055 0.088 0.363 R 0.19** 0.20** 0.15** 0.18** 0.18** 0.12* 0.12* −0.049 LS alpha <0.001 <0.001 0.004 0.001 0.001 0.019 0.026 0.357 R 0.17** 0.19** 0.14** 0.17** 0.16** 0.092 0.12* −0.063 RS alpha 0.001 <0.001 0.008 0.001 0.003 0.081 0.028 0.237 Circumferential Dimensions Girls Chest Circumference Upper Arm Circumference Forearm Circumference Hip Circumference Waist Circumference Upper Leg Circumference Calf Circumference Body Weight R 0.24** 0.17** 0.22** 0.26** 0.17** 0.24** 0.22** 0.27** BET alpha <0.001 0.002 <0.001 <0.001 0.002 <0.001 <0.001 <0.001 R 0.064 0.065 0.042 0.097 0.040 0.086 0.062 0.11* FET alpha 0.229 0.217 0.430 0.066 0.448 0.105 0.245 0.043 R 0.071 −0.013 0.052 0.018 −0.061 0.013 0.033 0.072 LS alpha 0.182 0.800 0.322 0.739 0.252 0.809 0.527 0.176 R 0.061 −0.015 0.040 0.018 −0.049 <0.001 0.040 0.062 RS alpha 0.250 0.779 0.449 0.728 0.351 0.996 0.449 0.238 Note: Statistically significant (*p < 0.05, **p < 0.01); BET—back extension test (Biering-Sorensen); FET—flexor endurance test (sit-up posture); LS—left side bridge; RS—right side bridge. Copyright © 2012 SciRes. 192  A. DEJANOVIC ET AL. Table 3. (a) Correlation values for boys of the 4 most correlated anthropometric variables with the 4 torso endurance tests; (b) Correlation values for girls of the 4 most correlated anthropometric variables with the 4 torso endurance tests. (a) Knee Diameter Forearm Circumference Age 7 8 9 10 11 12 13 14 7 8 9 10 11 12 13 14 R −0.21 −0.16 0.00−0.32* −0.25 −0.03 −0.25*0.13 −0.25 −0.12 −0.25 −0.30* −0.27* −0.35* −0.28*0.17 BET Sig. 0.27 0.35 0.98 0.04 0.06 0.82 0.05 0.340.180.480.05 0.05 0.04 0.02 0.03 0.20 R 0.14 −0.24 0.12−0.39* −0.11 −0.32*−0.28*−0.16 −0.01−0.23 −0.03 −0.39* −0.27* −0.25 −0.24 −0.27* FET Sig. 0.47 0.17 0.35 0.01 0.39 0.03 0.03 0.240.960.180.82 0.01 0.04 0.08 0.06 0.04 R −0.28 −0.19 −0.03 −0.31* −0.33** −0.12 −0.27*−0.26*−0.04 −0.02 −0.21 −0.44** −0.22 −0.10 −0.12 −0.07 LS Sig. 0.14 0.27 0.81 0.04 0.01 0.41 0.03 0.050.820.910.11 0.00 0.10 0.48 0.33 0.62 R −0.07 −0.39* −0.07 −0.51** −0.53** −0.23 −0.41** −0.140.06 −0.11 −0.28*−0.50** −0.53** −0.19 −0.28*0.06 RS Sig. 0.70 0.02 0.58 0.00 0.00 0.12 0.00 0.290.740.540.03 0.00 0.00 0.20 0.03 0.64 Upper Leg Circumference Body Weight Age 7 8 9 10 11 12 13 14 7 8 9 10 11 12 13 14 R −0.03 −0.09 −0.18 −0.31* −0.29* −0.12 −0.31*0.15 −0.20 −0.14 −0.09 −0.32* −0.22 −0.22 −0.26*0.19 BET Sig. 0.88 0.63 0.18 0.04 0.03 0.40 0.01 0.260.280.440.51 0.04 0.09 0.12 0.04 0.16 R −0.11 −0.20 0.06−0.42** −0.14 −0.25 −0.12 −0.240.01 −0.220.04 −0.46** −0.17 −0.34* −0.15 −0.27* FET Sig. 0.56 0.24 0.64 0.01 0.28 0.09 0.36 0.070.980.210.75 0.00 0.21 0.02 0.23 0.04 R 0.11 −0.08 −0.26* −0.54** −0.34** −0.14 −0.18 −0.26*−0.11 −0.06 −0.21 −0.53** −0.36** −0.20 −0.22 −0.23 LS Sig. 0.57 0.66 0.05 0.00 0.01 0.34 0.16 0.050.560.720.12 0.00 0.01 0.18 0.09 0.09 R 0.24 −0.20 −0.38** −0.68** −0.51** −0.20 −0.30*0.040.05 −0.17 −0.30*−0.70** −0.55** −0.33* −0.40** −0.08 RS Sig. 0.21 0.25 0.00 0.00 0.00 0.17 0.02 0.780.800.320.02 0.00 0.00 0.02 0.00 0.54 Note: Significant correlations (*p < 0.05, **p < 0.01); BET—back extension test (Biering-Sorensen); FET—flexor endurance test (sit-up posture); LS—left side bridge; RS—right side bridge. (b) Body Height Sitting Hei ght Age 7 8 9 10 11 12 13 14 7 8 9 10 11 12 13 14 R 0.35* 0.38* −0.12 0.21 0.08 0.05−0.04 −0.16 0.290.40*−0.100.12 0.03 −0.19 −0.13 −0.19 BET Sig. 0.02 0.02 0.420.19 0.53 0.770.800.300.060.010.47 0.47 0.85 0.23 0.400.23 R 0.47** 0.15 −0.27 −0.13 0.06 0.02 −0.150.130.413** 0.17 −0.296*−0.15 −0.01 −0.08 −0.23 0.10 FET Sig. 0.00 0.37 0.050.40 0.66 0.910.320.410.010.290.04 0.34 0.97 0.62 0.130.52 R −0.10 0.07 −0.35* 0.04 −0.03 0.07−0.12−0.270.080.17 −0.34*0.00 0.03 −0.03 −0.06 −0.44** LS Sig. 0.53 0.69 0.010.81 0.82 0.640.450.090.620.310.02 0.99 0.84 0.86 0.690.00 R −0.06 0.38* −0.44** −0.02 0.00 0.100.00−0.32*0.08 0.50**−0.38** −0.05 0.07 0.14 0.01−0.43** RS Sig. 0.72 0.02 0.000.89 0.97 0.530.980.040.640.000.01 0.77 0.62 0.36 0.920.00 Leg Length Pelvic Diameter Age 7 8 9 10 11 12 13 14 7 8 9 10 11 12 13 14 R 0.35* 0.34* −0.11 0.22 0.09 0.29−0.02 −0.160.210.06 −0.28*0.17 −0.03 −0.15 −0.17 −0.34* BET Sig. 0.03 0.04 0.430.15 0.48 0.060.880.320.180.700.05 0.29 0.84 0.35 0.280.03 R 0.41** 0.10 −0.31* −0.04 −0.01 0.21−0.09 0.050.38*−0.05 −0.17 −0.14 −0.36** 0.06 −0.19 −0.07 FET Sig. 0.01 0.54 0.030.81 0.97 0.180.570.760.020.750.25 0.36 0.01 0.71 0.220.68 R −0.17 −0.06 −0.31* 0.04 −0.19 0.03−0.17 −0.33*0.03 −0.04−0.54** −0.12 −0.20 −0.08 −0.02−0.26 LS Sig. 0.29 0.70 0.030.79 0.16 0.850.270.030.880.810.00 0.43 0.14 0.63 0.890.10 R −0.11 0.19 −0.43** −0.03 −0.10 0.02−0.15 −0.40** −0.040.14 −0.40** −0.12 −0.16 0.27 −0.10 −0.32* RS Sig. 0.48 0.26 0.000.85 0.48 0.920.320.010.810.420.00 0.47 0.22 0.08 0.530.04 Note: Significant correlations (*p < 0.05, **p < 0.01); BET—back extension test (Biering-Sorensen); FET—flexor endurance test (sit-up posture); LS—left side bridge; RS—right side bridges. Copyright © 2012 SciRes. 193  A. DEJANOVIC ET AL. Copyright © 2012 SciRes. 194 Figure 2. Torso extensor and flexor endurance and anthropometric changes with age in boys illustrating progressive increase in anthropometric variables with age while endurance scores showed inflection points. performance for these tests occurred at age 8 and between ages 11 and 12 before increases were seen. Figures 2 and 3 show the non-linear changes in torso extensor/flexor endurance and la- teral torso endurance, respectively, along with the year by year systematic increase in the 4 anthropometric variables that were most correlated with the torso endurance tests (knee diameter, forearm circumference, upper leg circumference and body weight). Girls Similar to the boys, correlations were strongest between BET and longitudinal measures for the girls when taken across all ages; however, the girls showed higher correlations than the boys. The girls followed the same pattern of significant, but weak, correlations between FET, LS and RS and anthropome- trics (Table 2(b)). While transversal and circumferential dimensions and body weight were most correlated with torso endurance scores within each age group for the boys, the longitudinal dimensions dominated these correlations in the girls. Body height, followed by sitting height, leg length and pelvic diameter were the high- est correlated anthropometric measures with BET, FET, RS and LS (Table 3(b)). There were also similarities in the changes in anthropometric variables and torso endurance scores between the boys and girls; however, there were differences in the torso endurance inflec- tion peaks and valleys. BET scores demonstrated the first peak at age 10 before dropping at age 11 and increasing to age 12, leveling out for ages 13 and 14. FET times increased a year later in girls than they did in boys and did not increase as dra- matically; an increase in scores of 74% was seen from age 8 to 9. There was a drop from age 9 to 10 and then even more sub- stantial from 10 to 11 before an increase was seen through age 13. Lateral torso endurance scores in girls changed most simi- larly to boys; there was, however, an initial peak in RS and LS at age 10. Figures 4 and 5 show these changes along with the linear changes in the anthropometric variables that were most correlated with the 4 torso endurance tests (body height, sitting height, leg length and pelvic diameter). Boys vs. Girls Girls had better BET scores than boys with an average dif- ference of 23.9s across all age groups. Though boys had higher scores in the other 3 endurance tests, the greatest difference between the genders was only 6.1s (LS) (Table 1). The Kruskal-Wallis test determined there was a significant effect of gender on BET (H(1) = 17.675, p < 0.001) and RS (H(1) = 9.366, p = 0.002), but not FET (p = 0.216) and LS (p = 0.111) scores. The Mann-Whitney U statistic showed that girls had significantly greater BET scores than the boys at ages 9 (U = 929.5, p = 0.001) and 12 (U = 628, p = 0.001). There were no significant differences between the genders in RS scores (p > 0.047). Discussion The most surprising result of this study was that torso en- durance scores seem to change independently of age. When all individuals were considered together regardless of age, the only pattern that was detected existed between longitudinal dimen- sions and endurance times. Though significant correlations existed between several anthropometric variables and torso endurance times, the magnitudes were very low. Despite the wide range of body measurements taken in multiple dimensions, there were no notable trends in the correlations. There are other factors in children, less related to body size, which must influ- ence torso muscle endurance. Perhaps hormonal changes asso- ciated with puberty or other variables that affect one’s effort during physical exertions may have more of an impact on torso endurance testing than the length of their legs. Thus, the first hypothesis must be rejected that anthropometric features influ- ence endurance times. The second hypothesis suggesting boys and girls differ both in endurance profiles and their links to anthropometric variables is accepted. There are divided opinions regarding gender differences for back muscle endurance in the literature. Some authors found significantly higher endurance scores in females (Kankaanpää 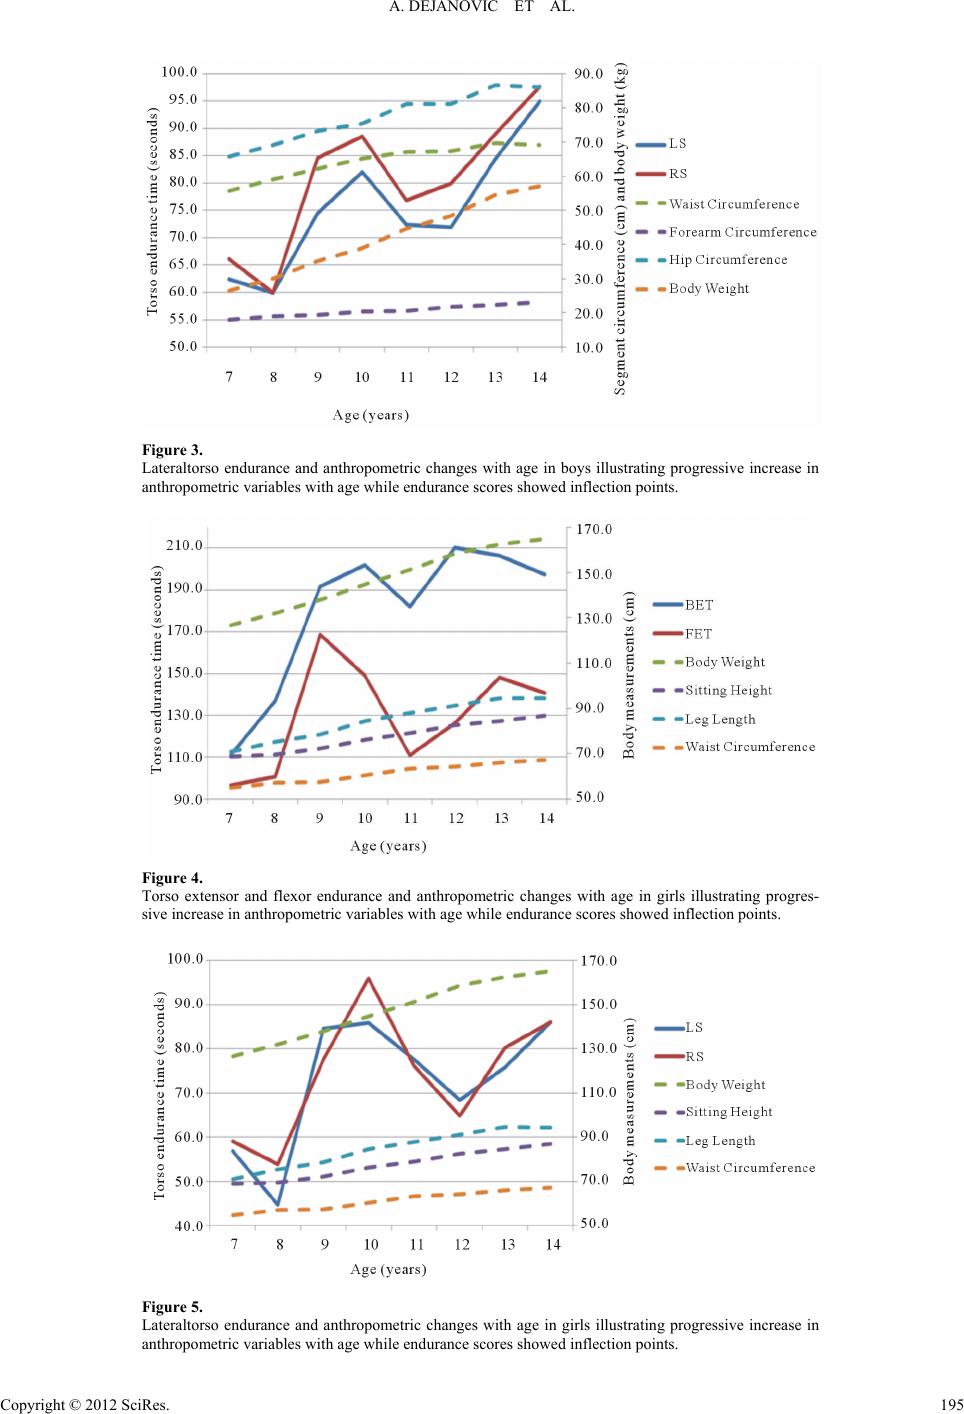 A. DEJANOVIC ET AL. Figure 3. Lateraltorso endurance and anthropometric changes with age in boys illustrating progressive increase in anthropometric variables with age while endurance scores showed inflection points. Figure 4. Torso extensor and flexor endurance and anthropometric changes with age in girls illustrating progres- sive increase in anthropometric variables with age while endurance scores showed inflection points. Figure 5. Lateraltorso endurance and anthropometric changes with age in girls illustrating progressive increase in anthropometric variables with age while endurance scores showed inflection points. Copyright © 2012 SciRes. 195 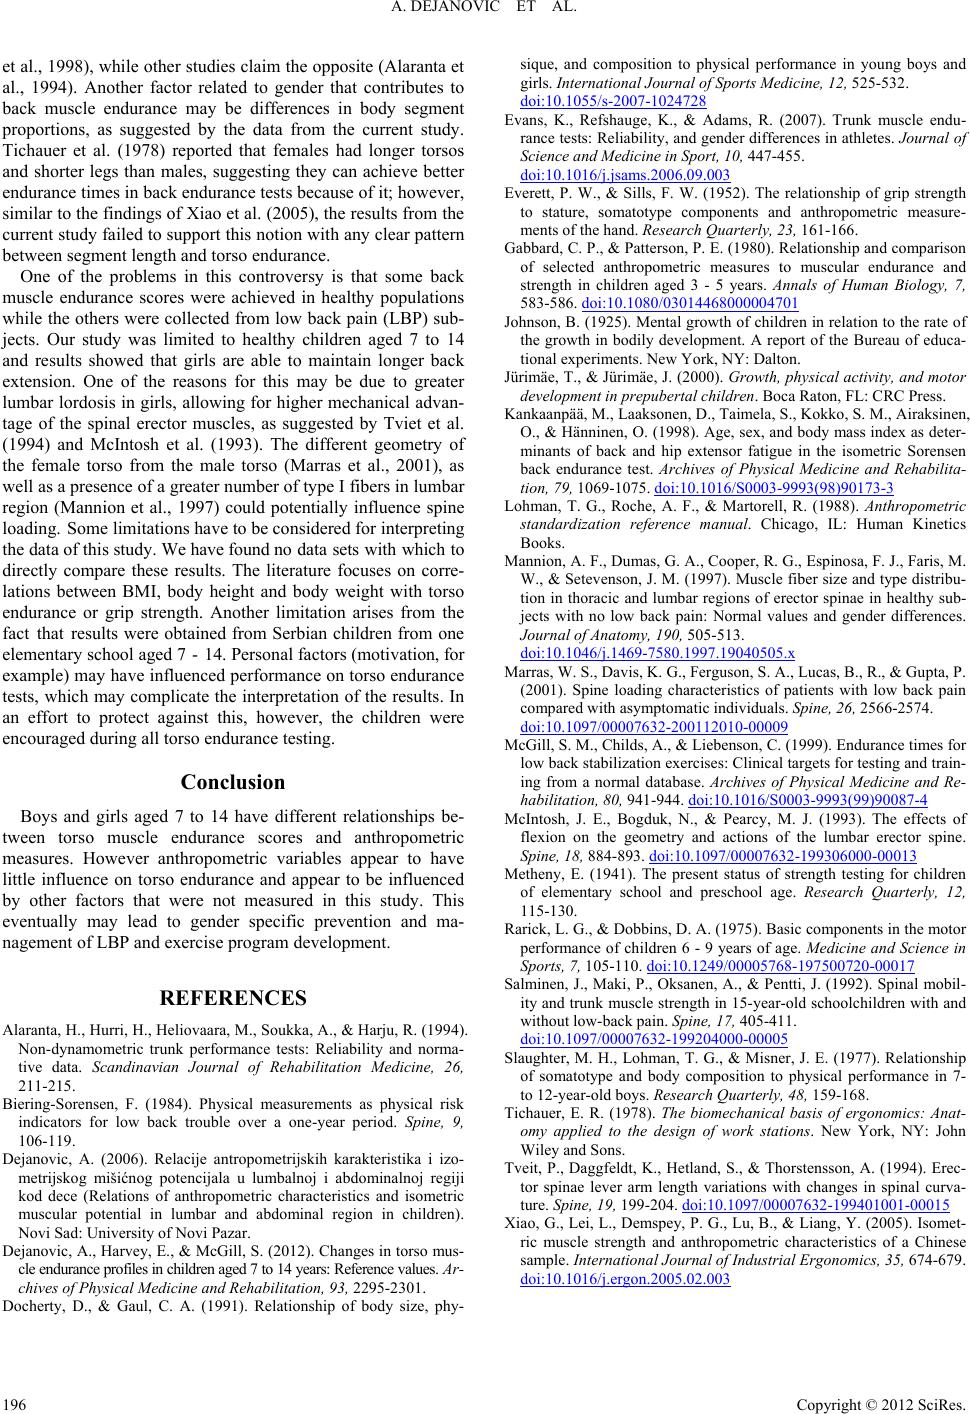 A. DEJANOVIC ET AL. Copyright © 2012 SciRes. 196 et al., 1998), while other studies claim the opposite (Alaranta et al., 1994). Another factor related to gender that contributes to back muscle endurance may be differences in body segment proportions, as suggested by the data from the current study. Tichauer et al. (1978) reported that females had longer torsos and shorter legs than males, suggesting they can achieve better endurance times in back endurance tests because of it; however, similar to the findings of Xiao et al. (2005), the results from the current study failed to support this notion with any clear pattern between segment length and torso endurance. One of the problems in this controversy is that some back muscle endurance scores were achieved in healthy populations while the others were collected from low back pain (LBP) sub- jects. Our study was limited to healthy children aged 7 to 14 and results showed that girls are able to maintain longer back extension. One of the reasons for this may be due to greater lumbar lordosis in girls, allowing for higher mechanical advan- tage of the spinal erector muscles, as suggested by Tviet et al. (1994) and McIntosh et al. (1993). The different geometry of the female torso from the male torso (Marras et al., 2001), as well as a presence of a greater number of type I fibers in lumbar region (Mannion et al., 1997) could potentially influence spine loading. Some limitations have to be considered for interpreting the data of this study. We have found no data sets with which to directly compare these results. The literature focuses on corre- lations between BMI, body height and body weight with torso endurance or grip strength. Another limitation arises from the fact that results were obtained from Serbian children from one elementary school aged 7 - 14. Personal factors (motivation, for example) may have influenced performance on torso endurance tests, which may complicate the interpretation of the results. In an effort to protect against this, however, the children were encouraged during all torso endurance testing. Conclusion Boys and girls aged 7 to 14 have different relationships be- tween torso muscle endurance scores and anthropometric measures. However anthropometric variables appear to have little influence on torso endurance and appear to be influenced by other factors that were not measured in this study. This eventually may lead to gender specific prevention and ma- nagement of LBP and exercise program development. REFERENCES Alaranta, H., Hurri, H., Heliovaara, M., Soukka, A., & Harju, R. (1994). Non-dynamometric trunk performance tests: Reliability and norma- tive data. Scandinavian Journal of Rehabilitation Medicine, 26, 211-215. Biering-Sorensen, F. (1984). Physical measurements as physical risk indicators for low back trouble over a one-year period. Spine, 9, 106-119. Dejanovic, A. (2006). Relacije antropometrijskih karakteristika i izo- metrijskog mišićnog potencijala u lumbalnoj i abdominalnoj regiji kod dece (Relations of anthropometric characteristics and isometric muscular potential in lumbar and abdominal region in children). Novi Sad: University of Novi Pazar. Dejanovic, A., Harvey, E., & McGill, S. (2012). Changes in torso mus- cle endurance profiles in children aged 7 to 14 years: Reference values. Ar- chives of Physical Medicine and Rehabilitation, 93, 2295-2301. Docherty, D., & Gaul, C. A. (1991). Relationship of body size, phy- sique, and composition to physical performance in young boys and girls. International Journal of Sports Me d i c i ne, 12, 525-532. doi:10.1055/s-2007-1024728 Evans, K., Refshauge, K., & Adams, R. (2007). Trunk muscle endu- rance tests: Reliability, and gender differences in athletes. Journal of Science and Medicine in Sport , 10, 447-455. doi:10.1016/j.jsams.2006.09.003 Everett, P. W., & Sills, F. W. (1952). The relationship of grip strength to stature, somatotype components and anthropometric measure- ments of the hand. Research Quarterly, 23, 161-166. Gabbard, C. P., & Patterson, P. E. (1980). Relationship and comparison of selected anthropometric measures to muscular endurance and strength in children aged 3 - 5 years. Annals of Human Biology, 7, 583-586. doi:10.1080/03014468000004701 Johnson, B. (1925). Mental growth of children in relation to the rate of the growth in bodily development. A report of the Bureau of educa- tional experiments. New York, NY: Dalton. Jürimäe, T., & Jürimäe, J. (2000). Growth, physical activity, and motor development in prepubertal children. Boca Raton, FL: CRC Press. Kankaanpää, M., Laaksonen, D., Taimela, S., Kokko, S. M., Airaksinen, O., & Hänninen, O. (1998). Age, sex, and body mass index as deter- minants of back and hip extensor fatigue in the isometric Sorensen back endurance test. Archives of Physical Medicine and Rehabilita- tion, 79, 1069-1075. doi:10.1016/S0003-9993(98)90173-3 Lohman, T. G., Roche, A. F., & Martorell, R. (1988). Anthropometric standardization reference manual. Chicago, IL: Human Kinetics Books. Mannion, A. F., Dumas, G. A., Cooper, R. G., Espinosa, F. J., Faris, M. W., & Setevenson, J. M. (1997). Muscle fiber size and type distribu- tion in thoracic and lumbar regions of erector spinae in healthy sub- jects with no low back pain: Normal values and gender differences. Journal of Anatomy, 190 , 505-513. doi:10.1046/j.1469-7580.1997.19040505.x Marras, W. S., Davis, K. G., Ferguson, S. A., Lucas, B., R., & Gupta, P. (2001). Spine loading characteristics of patients with low back pain compared with asymptomatic individuals. Spine, 26, 2566-2574. doi:10.1097/00007632-200112010-00009 McGill, S. M., Childs, A., & Liebenson, C. (1999). Endurance times for low back stabilization exercises: Clinical targets for testing and train- ing from a normal database. Archives of Physical Medicine and Re- habilitation, 80, 941-944. doi:10.1016/S0003-9993(99)90087-4 McIntosh, J. E., Bogduk, N., & Pearcy, M. J. (1993). The effects of flexion on the geometry and actions of the lumbar erector spine. Spine, 18, 884-893. doi:10.1097/00007632-199306000-00013 Metheny, E. (1941). The present status of strength testing for children of elementary school and preschool age. Research Quarterly, 12, 115-130. Rarick, L. G., & Dobbins, D. A. (1975). Basic components in the motor performance of children 6 - 9 years of age. Medicine and Science in Sports, 7, 105-110. doi:10.1249/00005768-197500720-00017 Salminen, J., Maki, P., Oksanen, A., & Pentti, J. (1992). Spinal mobil- ity and trunk muscle strength in 15-year-old schoolchildren with and without low-back pain. Spine, 17, 405-411. doi:10.1097/00007632-199204000-00005 Slaughter, M. H., Lohman, T. G., & Misner, J. E. (1977). Relationship of somatotype and body composition to physical performance in 7- to 12-year-old boys. Research Quart erly, 48, 159-168. Tichauer, E. R. (1978). The biomechanical basis of ergonomics: Anat- omy applied to the design of work stations. New York, NY: John Wiley and Sons. Tveit, P., Daggfeldt, K., Hetland, S., & Thorstensson, A. (1994). Erec- tor spinae lever arm length variations with changes in spinal curva- ture. Spine, 19, 199-204. doi:10.1097/00007632-199401001-00015 Xiao, G., Lei, L., Demspey, P. G., Lu, B., & Liang, Y. (2005). Isomet- ric muscle strength and anthropometric characteristics of a Chinese sample. International Journal of Ind ustrial Ergonomics , 35, 674-679. doi:10.1016/j.ergon.2005.02.003 |