

Paper Menu >>
Journal Menu >>
 Open Journal of Physical Chemistry, 2012, 2, 195-203 http://dx.doi.org/10.4236/ojpc.2012.24027 Published Online November 2012 (http://www.SciRP.org/journal/ojpc) Solar Water Splitting by Semiconductor Nanocomposites and Hydrogen Storage with Quinoid Systems Thorsten Wilke, Daniela Schricker, Josefin Rolf, Karl Kleinermanns* Institute of Physical Chemistry, Heinrich-Heine-University, Duesseldorf, Germany Email: *[email protected] Received August 6, 2012; revised September 7, 2012; accepted October 9, 2012 ABSTRACT Photocatalytic splitting of water was carried out in a two-phase system. The efficiencies of different types of nanocrys- talline semiconductors were investigated and compared with commercialised TiO2 nanopowder. Generated hydrogen was chemically stored by use of a quinoid system, which seems to be useable for fuel cells. Solar light sensitive nano- composites of CdSe/TiO2 and CdSxSey/TiO2 type were prepared and their good photocatalytic performance was demon- strated. In the visible range of 400 - 600 nm CdSxSey/TiO2 composites show comparable good results as in the UV range, which is very promising for their use as solar light water splitters. The concept of sensitising TiO2 with different kind of semiconductor nanoparticles, which is already known from quantum dot sensitised solar cells (QDSC), was demonstrated here for water splitting as well. Furthermore the kinetics of the storage reaction was investigated by UV-Vis spectroscopy and found to proceed via a consecutive reaction with an 1:1 charge transfer complex of quinone and hy- droquinone as intermediate. The electron transfer process via a Fe2+/Fe3+ redox couple was investigated by UV-Vis spectroscopy as well as by a dye reaction on the TiO2 surface. A light microscopic view of the surface of larger aggre- gates of TiO2 nanoparticles indicated different areas of photocatalytic activity with photocatalysis preferentially at cata- lyst edges. The global electron transfer process could be traced by following the dye colour in real time. Keywords: Water Splitting; Nanocomposites; Cadmium Selenosulphide; Titanium Dioxide; Hydrogen Storage 1. Introduction By the year 2050 the total energy consumption is ex- pected to double, as the world’s population is steadily increasing. Fossil fuels are not able to meet this energy demand in the long term, therefore, renewable energy resources will come more sharply into focus. The most promising alternative is solar light, because the amount of energy that arrives on earth every hour from the sun is greater than the amount that is required by the entire hu- manity in one year [1]. Yet, there is no practical way to transform and store this huge energy reserve efficiently, because the widely used silicon solar cells are of limited use here due to their high costs. Therefore it is necessary to look for less expensive and in sufficient quantities available alternatives to high-purity silicon. Storage of solar energy is possible for example by batteries and ca- pacitors, but, compared to chemical bonds, these storage systems feature a low energy density. In this regard hy- drogen is a good energy reservoir. It can be used as fuel for vehicles or can be converted into electrical energy by the use of fuel cells. The generation of hydrogen by elec- trolysis requires electrical energy, which could be ob- tained by use of solar cells, but the effectiveness is just approximately 8% for large-scale facilities [2]. Thus, di- rect photolytic water splitting by the use of suitable and inexpensive nanocrystalline semiconductors would be an promising alternative. Here the water is split without use of electricity and with high efficiency by solar light [1,3]. The semiconductor titanium dioxide has a band gap of about 3 eV and its conduction band potential is high enough for water splitting [4]. By absorption of photons electrons can be promoted to the excited state and elec- tron-hole pairs are generated, which diffuse separately on the surface of the TiO2 particles: 2 TiOe hh (1) The formed holes in the valence band are able to oxi- dize molecules, for example water: 22 1 HO 2hO2H 2 (2) The electrons in the conduction band can reduce spe- cies, for example H+ to hydrogen because the reduction potential of TiO2 is sufficiently negative (–0.65 V [5]): 2 2H 2eH (3) For water splitting by TiO2 we finally obtain the fol- *Corresponding author. C opyright © 2012 SciRes. OJPC  T. WILKE ET AL. 196 lowing overall reaction [6]: 2 1 HO 2OH 2 h 22 (4) Depending on the particle size, TiO2 nanoparticles (NPs) absorb at <350 - 380 nm [7]. Larger particles show smaller band gaps so that the absorption is red-shifted. Pure titanium dioxide can thus only use the UV part of the solar spectrum. However, most UV radiation is al- ready absorbed by the ozone layer, which means that its fraction on earth is low. Therefore, extension of TiO2’s light absorption to the visible region is of great interest. Depending on particle size cadmium selenide nanoparti- cles have a band gap of about 2.1 eV [8] and absorb in the range up to 600 nm [9]. So by sensitization of tita- nium dioxide with cadmium selenide nanoparticles, a much better use of the solar spectrum is possible. An efficient electron injection from the photoexcited nano- particle into the TiO2 conduction band requires a close contact, which can not be achieved by simple mixing of both semiconductors. Therefore we prepared nanocom- posites by annealing a homogenous mixture of TiO2 and CdSe nanoparticles at 450˚C. Cadmium selenosulphide CdSxSey are a novel class of photocatalysts. Their good ability as sensitizer in Quan- tum Dot Solar Cells (QDSC) has already been shown by our group. Their absorption depends strongly on the composition. The best results have been achieved with CdS6Se1 with an absorption up to 800 nm [7]. In princi- ple, organic dyes can be used for sensitisation as well [10-12] and results obtained with this class of sensitisers for water splitting with solar light will be published elsewhere [13]. For the chemical storage of the generated hydrogen quinoid systems are suitable. Their use mimics natural processes, e.g. photosynthesis, which also use quinoid systems like plastoquinone for hydrogen transfer [6]. 2,3-Dichloro-5,6-dicyano-1,4-benzoquinone (DDQ) is known from literature as a good hydrogen acceptor [14]. An advantage of this benzoquinone derivate is that DDQ and DDHQ are well distinguishable by UV-VIS spec- troscopy allowing rather easy quantitative analysis. The constraint of using DDQ is its high reactivity towards water resulting in the evolution of hydrocyanic acid. Be- cause of this behaviour the water splitting must be car- ried out in a two-phase system. In 1999 Matsumura et al. presented a photocatalytic reaction system for splitting water by use of TiO2 nano- particles [14]. The experimental setup consists of two compartments connected by an oil phase, which consists of DDQ and DDHQ dissolved in an organic solvent. The photocatalytic water splitting takes place in the first com- partment containing TiO2 as photocatalyst in an aqueous iron(III) solution, where gaseous oxygen is generated. In the second compartment hydrogen is generated by use of platinum-loaded TiO2 nanoparticles in an aqueous bro- mine/bromide solution. DDQ/DDHQ serves as a hydro- gen transporter between both compartments. The group of Matsumura has given a proof of principle; however, their hydrogen yields were very low and could be achi- eved only by very long and intense irradiation. In this paper we present a further development of the scheme used in Ref. [14] and its extension to use visible solar light for photocatalysis. We compared TiO2, CdSe sensitised TiO2 and CdS6Se1 sensitised TiO2 for their efficiency of DDQ reduction by visible light. We also report investigations of the kinetics of the hydrogen storage reaction based on time-resolved UV-Vis investi- gations of DDQ conversion. For a closer look at the processes on the surface of the nanocatalysts we recorded successive light microscopic images of TiO2 aggregates in an aqueous suspension. For visual detection of the electron transfer process a simple dye reaction was used, which verified a fast conversion of Fe3+ to Fe2+ on the surface of TiO2 aggregates. A magnification of the micrographs clearly visualised high active areas as bright spots on the surface of TiO2 nano- particle aggregates. 2. Experiments This article is dealing with the investigation of titanium dioxide, cadmium selenide and cadmium selenosulphide nanoparticles as well as nanocomposites of TiO2 with both semiconductors for their ability to split water photo- catalytically. 2.1. Preparation of the Photocatalysts Titanium dioxide nanopowder (Aerosil TiO2 P-25) was purchased by Degussa Evonik and used without any treatment. Cadmium selenide nanoparticles are synthesised as follows [15]: Cd(ClO4)2 · 6 H2O (985 mg, 2.35 mmol, Aldrich) was dissolved in 125 mL water. Afterwards 5.7 mmol of thioglycolic acid (TGA, Aldrich) as thiol-stabi- lizer were added during stirring and the pH of the solu- tion was adjusted between 11.2 and 11.8 by dropwise ad- dition of 1 M NaOH (Aldrich). A three neck flask with Al2Se3 lumps (134 mg, 0.46 mmol, Aldrich) was con- nected and flushed with N2 for about 30 minutes. The cadmium solution was deaerated in the same way. Subse- quently 10 - 20 mL of 0.5 M H2SO4 (Aldrich) was added to the Al2Se3 lumps via a septum and the generated H2Se gas was passed to the solution via a slow nitrogen flow for about 20 minutes. The colour of the solution changed to orange due to the formation of CdSe particles. The CdSe precursors grew to CdSe nanoparticles under reflux (100˚C, 24 hours). For precipitation of the CdSe NCs, Copyright © 2012 SciRes. OJPC  T. WILKE ET AL. 197 isopropanol (Fluka) was added. The suspension was cen- trifuged for 5 minutes at 13000 rmp, the aqueous phase was discarded and the residual solid was dried in an ex- siccator for 1 week. This route gave particles with a size of 2 - 4 nm. As precursor for the preparation of cadmium seleno- sulphide nanoparticles, cadmium sulphide nanoparticles were prepared with a size distribution of 2 - 4 nm [16]. 1-thioglycerol (TG, 1.87 mL, 22 mmol, Aldrich) was added to 30 mL of a 80 mM aqueous cadmium sulphate solution (CdSO4 · 8/3 H2O, Fluka). During constant stir- ring for 5 minutes ammonium sulphide (12.4 ml, 36 mmol, 20 % aqueous solution, Aldrich) was added. An intense yellow solution with yellow precipitation was obtained thereafter, which was centrifuged and dried for 1 week in an exsiccator. Cadmium selenosulphide nanocomposites were pre- pared as follows: In a specific molar ratio of 6:1 (S:Se) cadmium sulphide nanoparticles and selenium powder (99.5 %, Aldrich) were suspended in methanol. After 1 hour of stirring the methanol was evaporated at 80˚C. The resulting CdS:CdSe solid was sintered at 550˚C for 15 minutes. The colour of the remaining CdS6Se1 nano- composite is intensive red. CdS6Se1 is not soluble in common solvents, which precludes their direct TEM investigation. The CdS6Se1 nanoparticles were absorbed on the surface of small TiO2 nanoparticles by mixing the finely grinded solid with a clear and colourless solution of TiO2 nanoparticles. The resulting nanocomposites could be investigated by TEM and elementary analysis by EDX showed their composi- tion. The clear and colourless solution of TiO2 nanoparticles was prepared as follows [17]: titanium (IV) butoxide (8.5 mL, 0.025 mmol, Aldrich) was dissolved in ethanol (19 mL, Aldrich) and diethanolamine (2 mL, 20.8 mmol, Fluka). Subsequently 19 mL ethanol and 0.5 mL H2O were added very slowly. The solution was stirred over night. CdSe/TiO2 respectively CdS6Se1/TiO2 nanocomposites were prepared by mixing with a suitable TiO2 paste. TiO2 nanopowder (5 g Aearosil TiO2 P25, Evonik) was sus- pended in nitric acid (1 N, Fluka). This suspension was heated at 80˚C for 24 hours. Afterwards the nitric acid was evaporated and the TiO2 solid was dried for 3 days at 100˚C. Finally the TiO2 solid was treated with 25 ml wa- ter, acetylacetone (2.5 g, 24.97 mmol, Merck), Triton-X- 100 (1.25 g, 1.92 mmol, Avocado) and polyethylene oxi- de (M.W. 100000, Alfa Aesar) to give a homogenous paste. 40 mg of CdSe or CdS6Se1 were mixed with 1 mL of this TiO2 suspension in an agate mortar to produce a smooth and uniformly coloured paste, which was dried in a ceramic crucible at 80˚C for 2 hours. Afterwards the solid was sintered at 450˚C in a muffle furnace for about 30 minutes and ground to a fine powder. 2.2. Photocatalytic Water Splitting 2,3-Dichloro-5,6-dicyano-1,4-benzoquinone (98%, Al- drich), iron(III) chloride (>97%, Aldrich) and n-buty- ronitrile (purum, ≥99.0%, Fluka) was used without puri- fication. The water splitting experiments were carried out in a quartz cuvette of 2 × 4 × 4 cm size. 30 mg of the photo- catalyst were dispersed in 16 mL of an aqueous iron (III) chloride solution (8.0 mM). 5 mL of a DDQ solution in n-butyronitrile (1.9 mM) was placed carefully on top of the aqueous phase to form the organic phase. In order to avoid an evaporation of the organic solvent, the cuvette was covered by a glass plate of adequate size. To avert heating of the reaction system during irradiation and to reduce diffusion of DDQ into the aqueous phase, the vessel was cooled to 15˚C by a water flushed aluminium block, connected to the cuvette by a heat-conductive paste. The irradiation was carried out for 90 minutes by a 80 W mercury-vapor lamp (Oriel, Germany), which was mildly focused to give 100 mW/cm2. To prevent irradiation of the organic phase and photo- degradation of DDQ and DDHQ an aluminium mask of adequate size was used. For investigation of the efficiency of the photocata- lysts in the range of the visible solar spectrum, the water splitting experiment was performed by irradiation of the aqueous phase with the unfiltered Hg lamp spectrum and, for comparison, with a filtered lamp spectrum (400 - 600 nm). For this purpose a suitable cut-off filter (Edmund optics GmbH, Karlsruhe) was placed between lamp and reaction vessel. To exclude contributions to the spectra, which were not due to the process of water splitting, a reference solu- tion of the organic phase was kept in the dark without contact to the aqueous phase during irradiation. After 90 min irradiation a sample of the organic phase was taken, diluted 1:25 with n-butyronitrile and analysed by UV-Vis spectroscopy. 2.3. Kinetics of the Hydrogen Storage Reaction The water splitting experiment described above was car- ried out with 30 mg of P-25 TiO2. Irradiation of the aqueous phase was performed over 100 minutes with the unfiltered Hg lamp spectrum (100 mW/cm2). Every 10 minutes a 100 µL sample of the organic phase was taken at exactly the same position via a rigidly adjusted stainless steal cannula. The samples were diluted 1:25 with n-butyronitrile and analysed by UV-Vis spectros- copy. The recorded spectra were processed by a peak analysing software (OriginPro 8G, OriginLab Coopera- Copyright © 2012 SciRes. OJPC 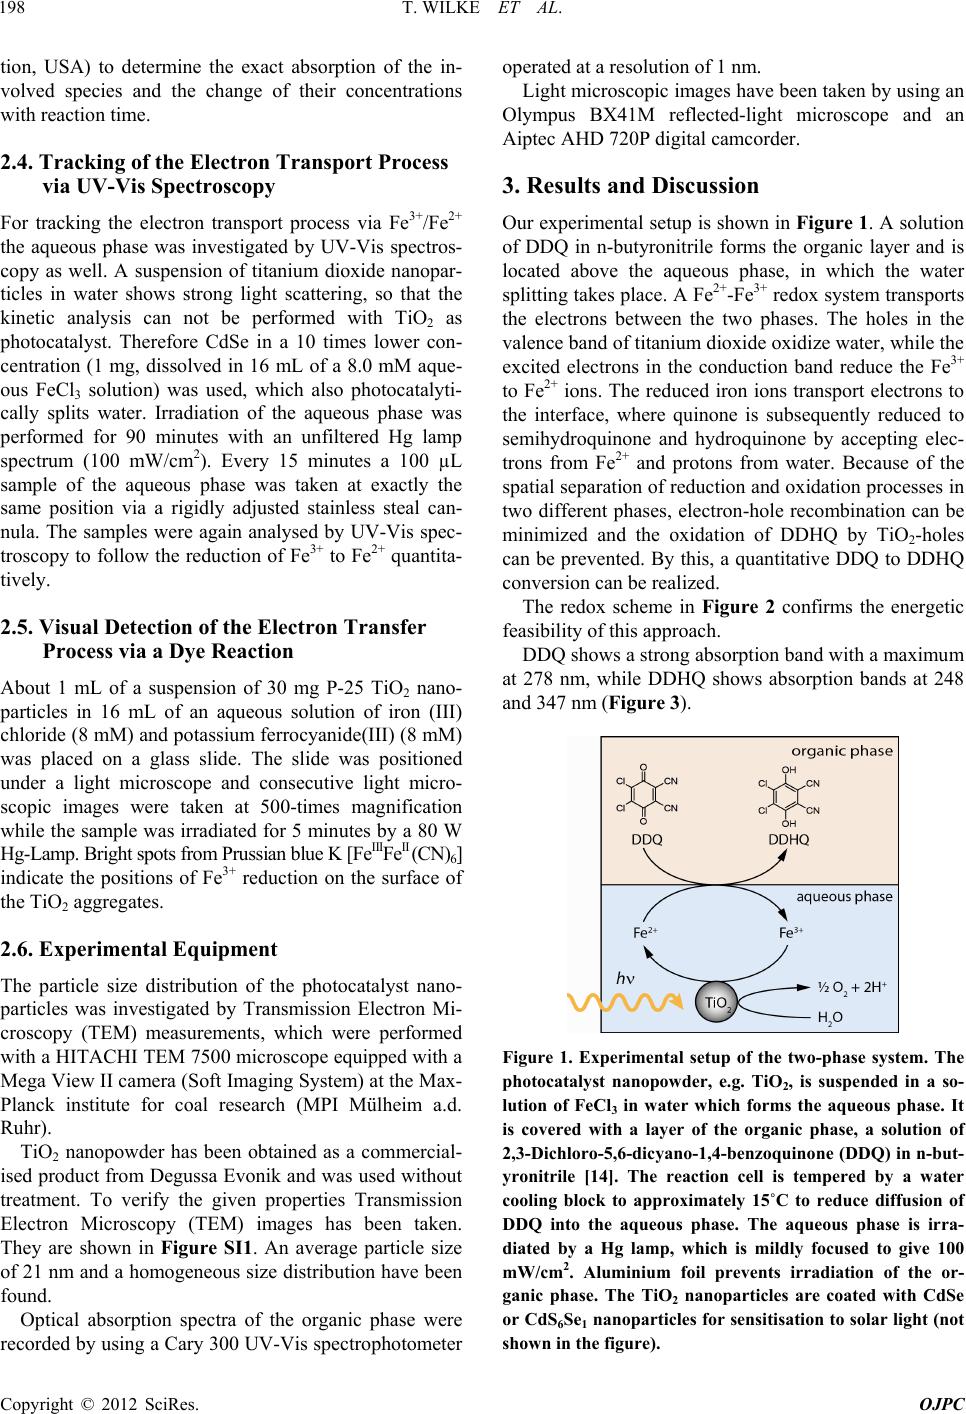 T. WILKE ET AL. 198 tion, USA) to determine the exact absorption of the in- volved species and the change of their concentrations with reaction time. 2.4. Tracking of the Electron Transport Process via UV-Vis Spectroscopy For tracking the electron transport process via Fe3+/Fe2+ the aqueous phase was investigated by UV-Vis spectros- copy as well. A suspension of titanium dioxide nanopar- ticles in water shows strong light scattering, so that the kinetic analysis can not be performed with TiO2 as photocatalyst. Therefore CdSe in a 10 times lower con- centration (1 mg, dissolved in 16 mL of a 8.0 mM aque- ous FeCl3 solution) was used, which also photocatalyti- cally splits water. Irradiation of the aqueous phase was performed for 90 minutes with an unfiltered Hg lamp spectrum (100 mW/cm2). Every 15 minutes a 100 µL sample of the aqueous phase was taken at exactly the same position via a rigidly adjusted stainless steal can- nula. The samples were again analysed by UV-Vis spec- troscopy to follow the reduction of Fe3+ to Fe2+ quantita- tively. 2.5. Visual Detection of the Electron Transfer Process via a Dye Reaction About 1 mL of a suspension of 30 mg P-25 TiO2 nano- particles in 16 mL of an aqueous solution of iron (III) chloride (8 mM) and potassium ferrocyanide(III) (8 mM) was placed on a glass slide. The slide was positioned under a light microscope and consecutive light micro- scopic images were taken at 500-times magnification while the sample was irradiated for 5 minutes by a 80 W Hg-Lamp. Bright spots from Prussian blue K [FeIIIFeII (CN)6] indicate the positions of Fe3+ reduction on the surface of the TiO2 aggregates. 2.6. Experimental Equipment The particle size distribution of the photocatalyst nano- particles was investigated by Transmission Electron Mi- croscopy (TEM) measurements, which were performed with a HITACHI TEM 7500 microscope equipped with a Mega View II camera (Soft Imaging System) at the Max- Planck institute for coal research (MPI Mülheim a.d. Ruhr). TiO2 nanopowder has been obtained as a commercial- ised product from Degussa Evonik and was used without treatment. To verify the given properties Transmission Electron Microscopy (TEM) images has been taken. They are shown in Figure SI1. An average particle size of 21 nm and a homogeneous size distribution have been found. Optical absorption spectra of the organic phase were recorded by using a Cary 300 UV-Vis spectrophotometer operated at a resolution of 1 nm. Light microscopic images have been taken by using an Olympus BX41M reflected-light microscope and an Aiptec AHD 720P digital camcorder. 3. Results and Discussion Our experimental setup is shown in Figure 1. A solution of DDQ in n-butyronitrile forms the organic layer and is located above the aqueous phase, in which the water splitting takes place. A Fe2+-Fe3+ redox system transports the electrons between the two phases. The holes in the valence band of titanium dioxide oxidize water, while the excited electrons in the conduction band reduce the Fe3+ to Fe2+ ions. The reduced iron ions transport electrons to the interface, where quinone is subsequently reduced to semihydroquinone and hydroquinone by accepting elec- trons from Fe2+ and protons from water. Because of the spatial separation of reduction and oxidation processes in two different phases, electron-hole recombination can be minimized and the oxidation of DDHQ by TiO2-holes can be prevented. By this, a quantitative DDQ to DDHQ conversion can be realized. The redox scheme in Figure 2 confirms the energetic feasibility of this approach. DDQ shows a strong absorption band with a maximum at 278 nm, while DDHQ shows absorption bands at 248 and 347 nm (Figure 3). Figure 1. Experimental setup of the two-phase system. The photocatalyst nanopowder, e.g. TiO2, is suspended in a so- lution of FeCl3 in water which forms the aqueous phase. It is covered with a layer of the organic phase, a solution of 2,3-Dichloro-5,6-dicyano-1, 4-benzoquinone (DDQ) in n-but- yronitrile [14]. The reaction cell is tempered by a water cooling block to approximately 15˚C to reduce diffusion of DDQ into the aqueous phase. The aqueous phase is irra- diated by a Hg lamp, which is mildly focused to give 100 mW/cm2. Aluminium foil prevents irradiation of the or- ganic phase. The TiO2 nanoparticles are coated with CdSe or CdS6Se1 nanoparticles for sensitisation to solar light (not shown in the figure). Copyright © 2012 SciRes. OJPC  T. WILKE ET AL. 199 Figure 2. Energy scheme of the two-phase water splitting experiment. Redox potentials are given in Volts [V] against Standard Hydrogen Potential [SHE]. The w orking principle is based on excitation of the photocatalyst, e.g. TiO2. The excited electron (e–) is stored by reducing Fe3+ to Fe2+ and transported to the interphase by diffusion. The electron transporter is regenerated to Fe3+ by reducing DDQ. Holes (h+) in the valence band are filled by oxidation of water leading to O2 and H+. DDHQ is formed at the interface by reaction of H+ with the reduced DDQ. . . . . . . Figure 3. UV-Vis spectra of DDQ (red) and DDHQ (blue) measured in THF (solid curves) and n-butyronitrile (dotted curves). The spectra were obtained using a suprasil quartz cell with 1 cm path length and a double-beam UV-Vis spec- trophotometer operated at a resolution of 1 nm. Figure 4(a) displays a TEM image of synthesized CdSe nanoparticles stabilised with thioglycolic acid (TGA). A narrow size distribution has been found and is presented in the inset. Typical size ranges are 2 - 4 nm. Based on our TEM images we propose Ostwald ripening to be re- sponsible for the formation of the nanoparticles. A TEM image of the CdS6Se1 nanocomposite in con- tact with TiO2 is displayed in Figure 4(b). The compo- site particles show an average size of 50 nm. Elemental analysis by local Energy Dispersive X-ray spectroscopy (EDX) indeed showed that the composite particles con- tain Ti, Cd, S and Se. (a) (b) Figure 4. (a) TEM images of CdSe nanoparticles stabilised with thioglycolic acid (TGA). The synthesis is described in the experimental section. The insets indicate the size distri- bution as obtained from diameter measurements of 20 - 40 particles. Typical size ranges are 2 - 4 nm; (b). TEM image of CdSxSey/TiO2 nanocomposites obtained from dispersion of CdSxSey particles in a colourless, clear TiO2 solution. The results of the water splitting experiments are pre- sented in Figures SI2-SI4 and Figure 5(a). Compared are the UV-Vis spectra of the diluted organic phase after 90 minutes irradiation with the unfiltered Hg lamp spec- tra and a filtered Hg lamp spectrum (400 - 600 nm). Irra- diation for <90 minutes shows a significant slower con- version of DDQ to DDHQ when using the filtered Hg lamp and TiO2, TiO2/CdSe or CdSe photocatalyst. The conversion of DDQ to DDHQ proceeds via an interme- diate 1:1 complex of DDQ and DDHQ. The reaction process can be described as follows: DDHQ is formed by reduction of DDQ and acceptance of two protons. DDQ 2e2HDDHQ (5) A 1:1 charge-transfer complex is formed with remain- ing DDQ. DDQDDHQDDQ DDHQ (6) The complex is degraded by reducing and accepting two further protons and electrons to obtain two DDHQ molecules. DDQ DDHQ2e2H2DDHQ (7) Copyright © 2012 SciRes. OJPC  T. WILKE ET AL. 200 . . . . . . . (a) . . . . . . (b) Figure 5 (a) Water splitting by TiO2/CdS6Se1 nanocompo- sites as photocatalyst. Shown are the UV-Vis spectra of the organic phase after 90 minutes reaction time. The black line shows the conversion of DDQ to DDHQ after 90 minutes irradiation of the aqueous phase with the unfiltered Hg lamp spectrum. The red line shows the result after 90 mi- nutes irradiation with a filtered lamp spectrum (400 - 600 nm) by using an optical glass filter. The recorded absorp- tion bands can be assigned to three different species: DDQ (absorption at 278 nm), DDHQ (absorption at 248 nm, 347 nm) and complexed [DDQ·DDHQ] (absorption at 448 nm, 509 nm, 552 nm, 593 nm). The remaining DDQ and [DDQ·DDHQ] indicates the achieved conversion of DDQ and is a measure of the efficiency of the used photocatalyst for water splitting and hydrogen storage; (b) Temporal progress of the conversion reaction DDQ to DDHQ. Shown are the UV-Vis spectra of the organic phase measured over 100 minutes. The recorded absorption bands can be as- signed to three different species: DDQ (absorption at 278 nm), DDHQ (absorption at 248 nm, 347 nm) and complexed [DDQ·DDHQ] (absorption at 448 nm, 509 nm, 552 nm, 593 nm). Increase and decrease of absorption bands are indi- cated by arrows. A decrease of the DDQ concentration and a simultaneous increase of the DDHQ concentration with time can be observed. Complexed [DDQ·DDHQ] is formed as an intermediate, whose absorption quickly emerges, in- creases within 20 minutes, afterwards decreases and com- pletely vanishes after 80 minutes. The absence of isosbestic points indicates at least one further intermediate in the course of the reaction. The observed absorption bands, shown in Figure SI2- SI4 and Figure 5(a), can be assigned to these three dif- ferent species. DDQ shows a strong absorption at 278 nm, whereas DDHQ has two different absorption bands at 248 nm and 347 nm. Therefore the absorption bands of educt and product can be distinguished. The intermediate charge-transfer complex [DDQ·DDHQ] exhibits a wide absorption in the range of 400 - 650 nm with absorption maxima at 448 nm, 509 nm, 552 nm and 593 nm. Effi- cient photocatalytic water splitting process and hydrogen storage by quinine reduction is indicated by a complete conversion of DDQ into DDHQ without remaining [DDQ·DDHQ] complex. The observed absorption of re- maining free and complexed DDQ is a measure of the efficiency of the photocatalyst and the hydrogen storage system. Considering that the irradiation of the earth by the sun has only a small UV component, the performance of the catalyst using the visible part of the sun spectrum is of particular interest. This has been investigated by us- ing a filtered Hg lamp spectrum in the range of 400 - 600 nm. The resulting spectrum is displayed as red line in Figure SI2-SI4 and Figure 5(a). The black line shows the absorption of the organic phase after irradiation of the aqueous phase with the unfiltered lamp spectrum. Figure SI2 summarises the performance of TiO2 na- noparticles without sensitiser. It can clearly be seen that the efficiency of TiO2 in the visible range is very low. A strong absorption at 278 nm indicates a large amount of unconverted DDQ while the observed absorption bands of DDHQ at 248 nm and 347 nm are, compared with the result of the unfiltered irradiation, rather small. Weak absorptions at 448 nm, 509 nm, 552 nm and 593 nm are referring to a small [DDQ·DDHQ] complex concentra- tion. The performance of CdSe nanoparticles under the same conditions is presented in Figure SI3. For irradia- tion with a strong UV component a comparably good performance as TiO2 could be demonstrated. Due to its absorption up to 600 nm the efficiency in the visible range is significantly higher compared to TiO2. Never- theless a complete DDQ conversion could not be achi- eved, which is clearly evident from the observed absorp- tion of unconverted DDQ and complexed DDQ. Quite contrary to these results, nanocomposites of tita- nium dioxide and cadmium selenide, characterised by a very close contact between both semiconductors, behave quite differently. Our results are given in Figure SI4. Even though a strong absorption in the range of 400 - 650 nm indicates a quite high complex concentration, the conversion of DDQ to DDHQ is higher compared to the exclusive use of CdSe. This strategy to combine TiO2 with its excellent pro- perties for water splitting with a sensitising semiconduc- tor for good absorption in the visible range is very pro- Copyright © 2012 SciRes. OJPC  T. WILKE ET AL. 201 mising. The efficiency can be further enhanced by using CdS6Se1 in close contact with TiO2. The performance of this TiO2/Cd6Se1 nanocomposite is shown in Figure 5(a). Compared to TiO2/CdSe the efficiency is significantly higher. Even though [DDQ·DDHQ] can still be observed, its concentration is lower than the concentration, which was found by using TiO2, CdSe or TiO2/CdSe for visible light catalysis. Taking the high concentration of formed DDHQ in account it can be clearly concluded that the con- version reaction is already far proceeded. The progress of the conversion reaction from DDQ to DDHQ with time was studied via UV-Vis investigations of the organic phase as function of time for 100 minutes. The UV-Vis spectra are shown in Figure 5(b). The ob- served absorption bands can be assigned to the three spe- cies DDQ (278 nm), DDHQ (248 nm, 347 nm) and [DDQ·DDHQ] (448 nm, 509 nm, 552 nm, 593 nm). The mechanism of the conversion reaction is described above. The spectra indicate a fast degradation of DDQ and a corresponding increase of [DDQ · DDHQ] as intermedi- ate. After 20 minutes the absorption of complexed DDQ starts to decrease for about 1 hour until it is completely reduced to DDHQ. The absorption of DDHQ is found to increase simultaneously with the decrease of DDQ. Based on these UV-Vis measurements the kinetics of the conversion reaction was assigned. The kinetic curves are presented in Figure 6. The temporal course is typical for a consecutive reaction. Contrary to our expectations a small decrease of the DDHQ concentration was observed at the end of the reaction. This can be explained as the result of a number of minor side reactions, which leads to loss of DDHQ, for example diffusion of DDHQ into the aqueous phase, photochemical degradation due to light scattering by the photocatalyst particles into the organic phase and/or hydrolysis of DDHQ at the interphase. Therefore we do not obtain a 100% mass balance. A small quantity of DDHQ and [DDQ · DDHQ] was ob- served before irradiation which seems to be formed by a side reaction. This portion was assumed to be constant during irradiation and therefore subtracted from the meas- ured concentrations. The results of our UV-Vis studies of the aqueous phase during the irradiation process are shown in Figure SI5. The electron transport via the redox couple Fe3+/Fe2+ from the surface of the excited photocatalyst through the aqueous phase to the interface was tracked over 90 min- utes. Due to an overlap of the absorption bands of Fe3+ and Fe2+ the absorption of Fe2+ can just be found as a shoulder in the absorption band of Fe3+. For comparison the absorption maxima of Fe3+ and Fe2+ are indicated by arrows. A rapid decrease of the Fe3+ absorption was ob- served with irradiation time. At ~90 min the Fe2+/Fe3+ concentration ratio does not change anymore with time (concentration equilibrium) because Fe2+ is not consumed anymore for DDQ reduc- tion (nearly complete conversion to DDHQ). Figures 7 and SI6 gives a more detailed, spatially re- solved view of the electron transfer at the surface of photoexcited TiO2. The transfer process was followed by a simple dye reaction. After irradiation an electron is transferred from the surface of an excited TiO2 particle to an iron(III) ion to form an iron(II) ion, which is immedi- ately trapped by potassium ferrocyanide(III). The so formed complex K[FeIIIFeII(CN)6] is well-know as a sta- ble and intensive blue coloured dye called Prussian blue. In our experiment it was used as a visual detector for the formation of Fe2+ at the surface of photoexcited TiO2 particles. The dye reaction was followed by use of a light microscope. As single TiO2 nanoparticles are much too small to be observable by light microscopic magnifi- cation, aggregates of TiO2 nanoparticles with a size of 10 - 15 µm were used. The aggregates were formed by using a particularly highly concentrated TiO2 suspension. Within the first two minutes a green and turquoise colour appears, which is due to a mixture of the yellow-orange . . . . . . . . Figure 6. Kinetics of the hydrogen storage reaction. Illus- trated are the time-depenent changes in concentration of DDQ (red), DDHQ (blue) and [DDQ·DDHQ] complex (black). The shown kinetic curves are based on UV-Vis measure- ments of the organic phase for 100 minutes; see Figure 5(b). The kinetics c omplies w i t h a typical c onsecutive reaction. Figure 7. Enlarged detail of the light optical micrograph, see Figure SI6. Bright spots on the surface of the aggregated TiO2 nanoparticles are clearly visible and indicate highly active areas. Copyright © 2012 SciRes. OJPC  T. WILKE ET AL. Copyright © 2012 SciRes. OJPC 202 colour of remaining FeCl3 and the blue colour of already formed Prussian blue. After 5 minutes of irradiation the surface of the TiO2 aggregates appears intensive blue coloured, see Supplementary Information. It can be assumed that the surface of the TiO2 aggre- gates is rough with different kind of edges. An enlarge- ment of the light optical micrograph, which is presented in Figure 7, indicates high active reaction areas, which are visible as bright spots on the surface of the TiO2 ag- gregates, mostly near edges. Edges therefore appear to be the areas of higher photoreduction activity. 4. Conclusion We presented an experimental setup to investigate the performance of nanocrystalline semiconductors for photo- catalytic water splitting. Chemical storage of the gener- ated hydrogen by quinoid systems seems to be a good alternative to evolution of gaseous H2 as it is easy to handle and can be use as recyclable fuel for fuel cells, as we show in a further publication [18]. 5. Acknowledgements The authors gratefully acknowledge Dr. Christian W. Lehmann and his group (Max-Planck Institut für Koh- lenforschung, Mülheim/Ruhr) for the implementation of the TEM measurements and Dr. Daniel Ogermann (In- stitute of Physical Chemistry, Heinrich-Heine-University, Düsseldorf) for his assistance in preparation of the pho- tocatalyst samples. REFERENCES [1] R. Pike and P. Earis, “Powering the World with Sun- light,” Energy & Enviromental Sc ience, Vol. 3, No. 2, 2010, p. 173. doi:10.1039/b924940k [2] N. Kelly, T. Gibson and D. Ouwerkerk, “Generation of High-Pressure Hydrogen for Fuel Cell Electric Vehicles Using Photovoltaic-Powered Water Electrolysis,” Inter- national Journal of Hydrogen Energy, Vol. 36, No. 24, 2011, pp. 15803-15825. doi:10.1016/j.ijhydene.2011.08.058 [3] E. Durgun, S. Ciraci, W. Zhou and T. Yildirim, “Transi- tion-Metal-Ethylene Complexes as High-Capacity Hydro- gen-Storage Media,” Physical Review Letters, Vol. 97, No. 22, 2006, pp. 1-4. doi:10.1103/PhysRevLett.97.226102 [4] M. Grätzel, “Photoelectrochemical Cells,” Nature, Vol. 414, No. 6861, 2001, pp. 338-344. doi:10.1038/35104607 [5] A. Hagfeldt and M. Grätzel, “Light-Induced Redox Reac- tions in Nanocrystalline Systems,” Chemical Reviews, Vol. 95, No. 1, 1995, pp. 49-68. doi:10.1021/cr00033a003 [6] M. Kaneko and I. Okura, “Photocatalysis—Science and Technology,” Springer, Heidelberg, 2002. [7] D. Ogermann, T. Wilke and K. Kleinermanns, “CdSxSey/ TiO2 Solar Cell Prepared with Sintered Mixture Deposi- tion,” Open Journal of Physical Chemistry, Vol. 2, No. 1, 2012, pp. 47-57. doi:10.4236/ojpc.2012.21007 [8] D. R. Cooper and N. M. Dimitrijevic, “Photosensitization of CdSe/ZnS QDs and Reliability of Assays for Reactive Oxygen Species Production,” Nanoscale, Vol. 2, No. 1, 2010, pp. 114-121. doi:10.1039/b9nr00130a [9] I. Robel, M. Kuno and P. V. Kamat, “Size-Dependent Electron Injection from Excited CdSe Quantum Dots into TiO2 Nanoparticles,” Journal of the American Chemical Society, Vol. 129, No. 14, 2007, pp. 4136-4137. doi:10.1021/ja070099a [10] M. Grätzel, “Dye-Sensitized Solar Cells,” Journal of Pho- tochemistry and Photobiology C, Vol. 4, No. 2, 2003, pp. 145-153. doi:10.1016/S1389-5567(03)00026-1 [11] T. Meyer, D. Ogermann, A. Pankrath, K. Kleinermanns and T. J. J. Müller, “Phenothiazinyl Rhodanylidene Mero- cyanines for Dye-Sensitized Solar Cells,” The Journal of Organic Chemistry, Vol. 77, No. 8, 2012, pp. 3704-3715. doi:10.1016/10.1021/jo202608w [12] R. Menzel, D. Ogermann, S. Kupfer, D. Weib, H. Görls, K. Kleinermanns, L. González and R. Beckert, “4-Meth- oxy-1,3-thiazole Based Donor-Acceptor Dyes: Charac- terization, X-Ray Structure, DFT Calculations and Test as Sensitizers for DSSC,” Dyes and Pigments, Vol. 94, No. 3, 2012, pp. 512-524. doi:10.1016/j.dyepig.2012.02.014 [13] T. Wilke and K. Kleinermanns, to be published, 2012. [14] T. Ohno, K. Fujihara, K. Sarukawa, F. Tanigawa and M. Matsumura, “Splitting of Water by Combining Two Photo- catalytic Reactions through a Quinone Compound Dis- solved in an Oil Phase,” Zeitschrift für Physikalische Chemie, Vol. 213, No. 2, 1999, pp. 165-174. doi:10.1524/zpch.1999.213.Part_2.165 [15] A. L. Rogach, A. Kornowski, M. Gao, A. Eychmüller and H. Weller, “Synthesis and Characterization of a Size Se- ries of Extremely Small Thiol-Stabilized CdSe Nano- crystals,” The Journal Of Physical Chemistry B, Vol. 103, No. 16, 1999, pp. 3065-3069. doi:10.1021/jp984833b [16] G. A. Martínez-Castañón, M. G. Sánchez-Loredo, J. R. Mar- tínez-Mendoza and F. Ruiz, “Synthesis of CdS Nanopar- ticles: A Simple Method in Aqueous Media,” Azojomo, Vol. 1, No. 1, 2005, pp. 1-2. doi:10.2240/azojomo0170 [17] J. Yu, X. Zhao, J. Du and W. Chen, “Preparation, Micro- structure and Photocatalytic Activity of the Porous TiO2 Anatase Coating by Sol-Gel Processing”, Journal of Sol- Gel Science and Technology, Vol. 17, No. 2, 2000, pp. 163-171. doi:10.1023/A:1008703719929 [18] T. Wilke, M. Schneider and K. Kleinermanns, “1,4-Hy- droquinone is a Hydrogen Reservoir for Fuel Cells and Recyclable via Water Splitting,” 2012. 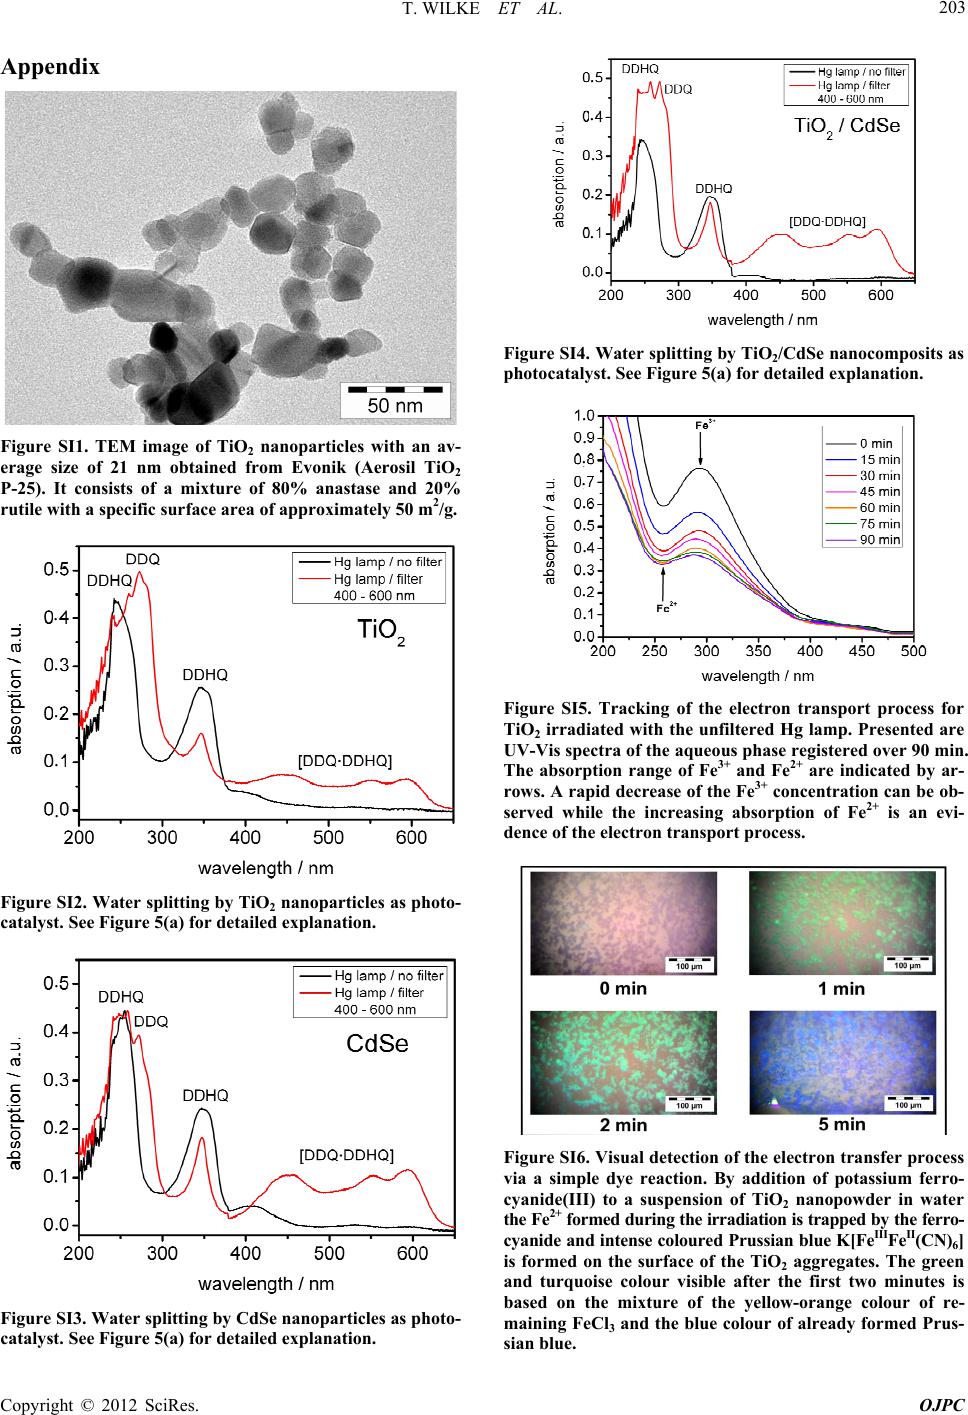 T. WILKE ET AL. 203 Appendix Figure SI1. TEM image of TiO2 nanoparticles with an av- erage size of 21 nm obtained from Evonik (Aerosil TiO2 P-25). It consists of a mixture of 80% anastase and 20% rutile with a specific surface area of approximately 50 m2/g. . . . . . . Figure SI2. Water splitting by TiO2 nanoparticles as photo- catalyst. See Figure 5(a) for detailed explanation. . . . . . . Figure SI3. Water splitting by CdSe nanopart icles as photo- catalyst. See Figure 5(a) for detailed explanation. . . . . . . Figure SI4. Water splitting by TiO2/CdSe nanocomposits as photocatalyst. See Figure 5(a) for detailed explanation. . . . . . . . . . . . Figure SI5. Tracking of the electron transport process for TiO2 irradiated with the unfiltered Hg lamp. Presented are UV-Vis spectra of the aqueous phase registered over 90 min. The absorption range of Fe3+ and Fe2+ are indicated by ar- rows. A rapid decrease of the Fe3+ concentration can be ob- served while the increasing absorption of Fe2+ is an evi- dence of the electron transport process. Figure SI6. Visual detection of the electron transfer process via a simple dye reaction. By addition of potassium ferro- cyanide(III) to a suspension of TiO2 nanopowder in water the Fe2+ forme d duri ng the irra dia tion i s trap ped by th e ferro - cyanide and intense coloured Prussian blue K[FeIIIFeII(CN)6] is formed on the surface of the TiO2 aggregates. The green and turquoise colour visible after the first two minutes is based on the mixture of the yellow-orange colour of re- maining FeCl3 and the blue colour of already formed Prus- sian blue. Copyright © 2012 SciRes. OJPC |