

Paper Menu >>
Journal Menu >>
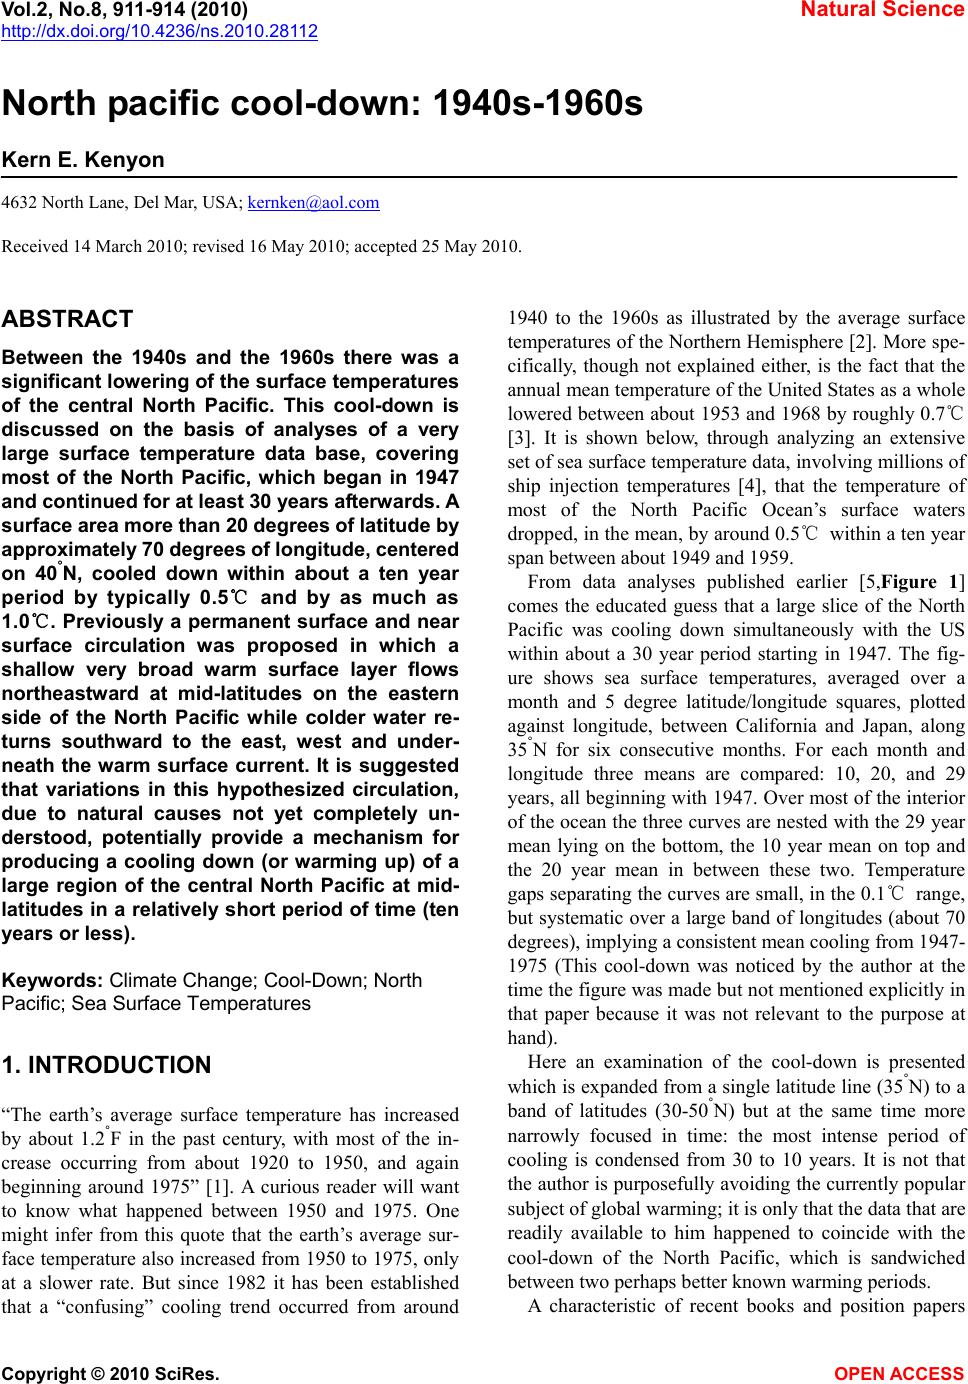 Vol.2, No.8, 911-914 (2010) Natural Science http://dx.doi.org/10.4236/ns.2010.28112 Copyright © 2010 SciRes. OPEN ACCESS North pacific cool-down: 1940s-1960s Kern E. Kenyon 4632 North Lane, Del Mar, USA; [email protected] Received 14 March 2010; revised 16 May 2010; accepted 25 May 2010. ABSTRACT Between the 1940s and the 1960s there was a significant lowering of the surface temperatures of the central North Pacific. This cool-down is discussed on the basis of analyses of a very large surface temperature data base, covering most of the North Pacific, which began in 1947 and continued for at least 30 years afterwards. A surface area more than 20 degrees of latitude by approximately 70 degrees of longitude, centered on 40°N, cooled down within about a ten year period by typically 0.5℃ and by as much as 1.0℃. Previously a permanent surface and near surface circulation was proposed in which a shallow very broad warm surface layer flows northeastward at mid-latitudes on the eastern side of the North Pacific while colder water re- turns southward to the east, west and under- neath the warm surface current. It is suggested that variations in this hypothesized circulation, due to natural causes not yet completely un- derstood, potentially provide a mechanism for producing a cooling down (or warming up) of a large region of the central North Pacific at mid- latitudes in a relatively short period of time (ten years or less). Keywords: Climate Change; Cool-Down; North Pacific; Sea Surface Temperatures 1. INTRODUCTION “The earth’s average surface temperature has increased by about 1.2°F in the past century, with most of the in- crease occurring from about 1920 to 1950, and again beginning around 1975” [1]. A curious reader will want to know what happened between 1950 and 1975. One might infer from this quote that the earth’s average sur- face temperature also increased from 1950 to 1975, only at a slower rate. But since 1982 it has been established that a “confusing” cooling trend occurred from around 1940 to the 1960s as illustrated by the average surface temperatures of the Northern Hemisphere [2]. More spe- cifically, though not explained either, is the fact that the annual mean temperature of the United States as a whole lowered between about 1953 and 1968 by roughly 0.7℃ [3]. It is shown below, through analyzing an extensive set of sea surface temperature data, involving millions of ship injection temperatures [4], that the temperature of most of the North Pacific Ocean’s surface waters dropped, in the mean, by around 0.5℃ within a ten year span between about 1949 and 1959. From data analyses published earlier [5,Figure 1] comes the educated guess that a large slice of the North Pacific was cooling down simultaneously with the US within about a 30 year period starting in 1947. The fig- ure shows sea surface temperatures, averaged over a month and 5 degree latitude/longitude squares, plotted against longitude, between California and Japan, along 35°N for six consecutive months. For each month and longitude three means are compared: 10, 20, and 29 years, all beginning with 1947. Over most of the interior of the ocean the three curves are nested with the 29 year mean lying on the bottom, the 10 year mean on top and the 20 year mean in between these two. Temperature gaps separating the curves are small, in the 0.1℃ range, but systematic over a large band of longitudes (about 70 degrees), implying a consistent mean cooling from 1947- 1975 (This cool-down was noticed by the author at the time the figure was made but not mentioned explicitly in that paper because it was not relevant to the purpose at hand). Here an examination of the cool-down is presented which is expanded from a single latitude line (35°N) to a band of latitudes (30-50°N) but at the same time more narrowly focused in time: the most intense period of cooling is condensed from 30 to 10 years. It is not that the author is purposefully avoiding the currently popular subject of global warming; it is only that the data that are readily available to him happened to coincide with the cool-down of the North Pacific, which is sandwiched between two perhaps better known warming periods. A characteristic of recent books and position papers 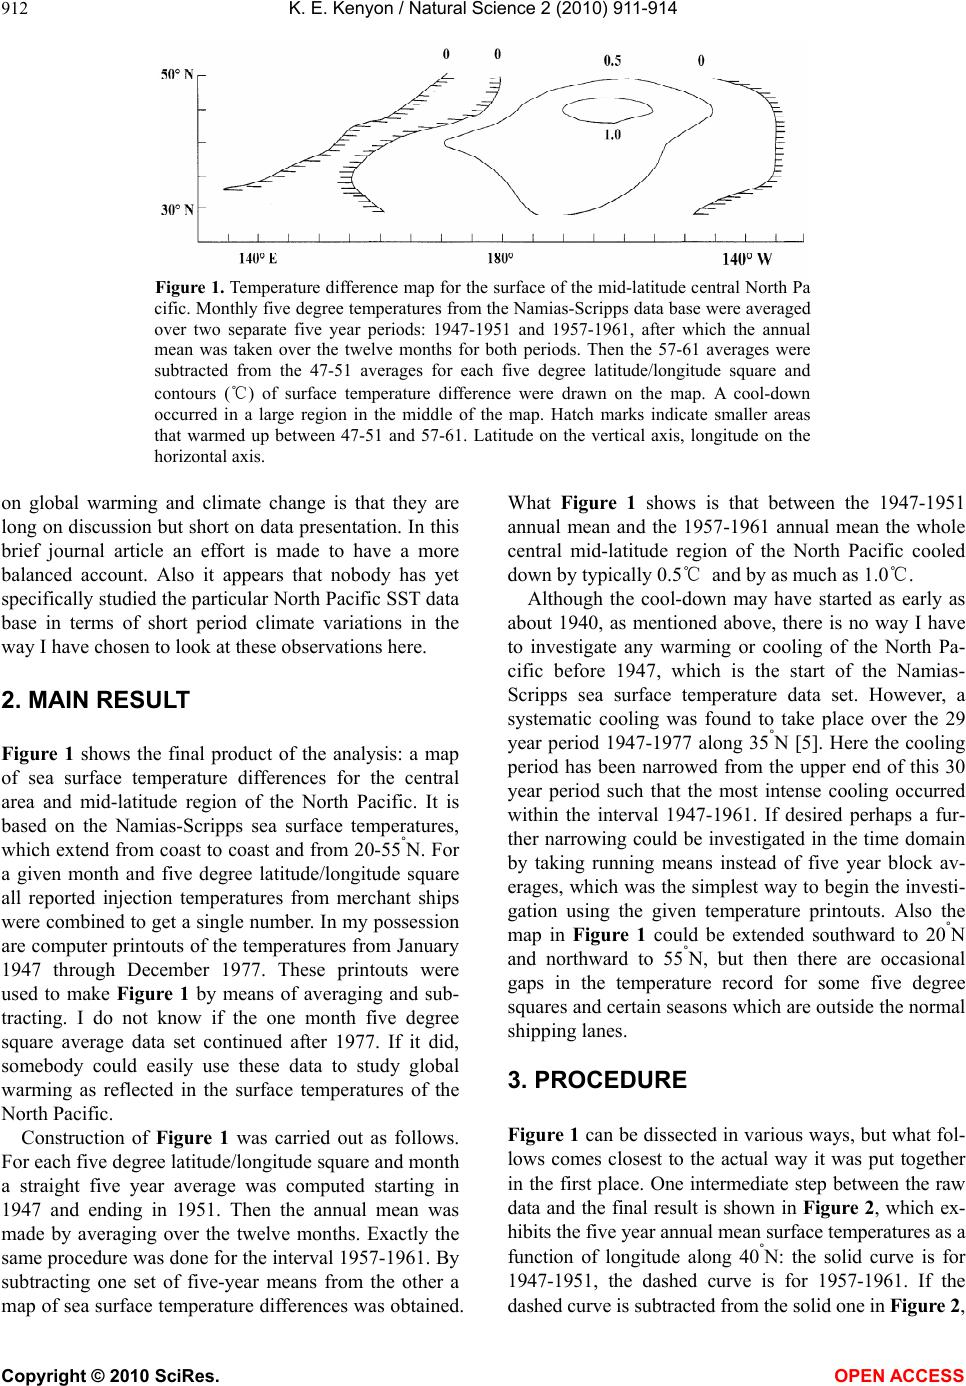 K. E. Kenyon / Natural Science 2 (2010) 911-914 Copyright © 2010 SciRes. OPEN ACCESS 912 Figure 1. Temperature difference map for the surface of the mid-latitude central North Pa cific. Monthly five degree temperatures from the Namias-Scripps data base were averaged over two separate five year periods: 1947-1951 and 1957-1961, after which the annual mean was taken over the twelve months for both periods. Then the 57-61 averages were subtracted from the 47-51 averages for each five degree latitude/longitude square and contours (℃) of surface temperature difference were drawn on the map. A cool-down occurred in a large region in the middle of the map. Hatch marks indicate smaller areas that warmed up between 47-51 and 57-61. Latitude on the vertical axis, longitude on the horizontal axis. on global warming and climate change is that they are long on discussion but short on data presentation. In this brief journal article an effort is made to have a more balanced account. Also it appears that nobody has yet specifically studied the particular North Pacific SST data base in terms of short period climate variations in the way I have chosen to look at these observations here. 2. MAIN RESULT Figure 1 shows the final product of the analysis: a map of sea surface temperature differences for the central area and mid-latitude region of the North Pacific. It is based on the Namias-Scripps sea surface temperatures, which extend from coast to coast and from 20-55°N. For a given month and five degree latitude/longitude square all reported injection temperatures from merchant ships were combined to get a single number. In my possession are computer printouts of the temperatures from January 1947 through December 1977. These printouts were used to make Figure 1 by means of averaging and sub- tracting. I do not know if the one month five degree square average data set continued after 1977. If it did, somebody could easily use these data to study global warming as reflected in the surface temperatures of the North Pacific. Construction of Figure 1 was carried out as follows. For each five degree latitude/longitude square and month a straight five year average was computed starting in 1947 and ending in 1951. Then the annual mean was made by averaging over the twelve months. Exactly the same procedure was done for the interval 1957-1961. By subtracting one set of five-year means from the other a map of sea surface temperature differences was obtained. What Figure 1 shows is that between the 1947-1951 annual mean and the 1957-1961 annual mean the whole central mid-latitude region of the North Pacific cooled down by typically 0.5℃ and by as much as 1.0℃. Although the cool-down may have started as early as about 1940, as mentioned above, there is no way I have to investigate any warming or cooling of the North Pa- cific before 1947, which is the start of the Namias- Scripps sea surface temperature data set. However, a systematic cooling was found to take place over the 29 year period 1947-1977 along 35°N [5]. Here the cooling period has been narrowed from the upper end of this 30 year period such that the most intense cooling occurred within the interval 1947-1961. If desired perhaps a fur- ther narrowing could be investigated in the time domain by taking running means instead of five year block av- erages, which was the simplest way to begin the investi- gation using the given temperature printouts. Also the map in Figure 1 could be extended southward to 20°N and northward to 55°N, but then there are occasional gaps in the temperature record for some five degree squares and certain seasons which are outside the normal shipping lanes. 3. PROCEDURE Figure 1 can be dissected in various ways, but what fol- lows comes closest to the actual way it was put together in the first place. One intermediate step between the raw data and the final result is shown in Figure 2, which ex- hibits the five year annual mean surface temperatures as a function of longitude along 40°N: the solid curve is for 1947-1951, the dashed curve is for 1957-1961. If the dashed curve is subtracted from the solid one in Figure 2, 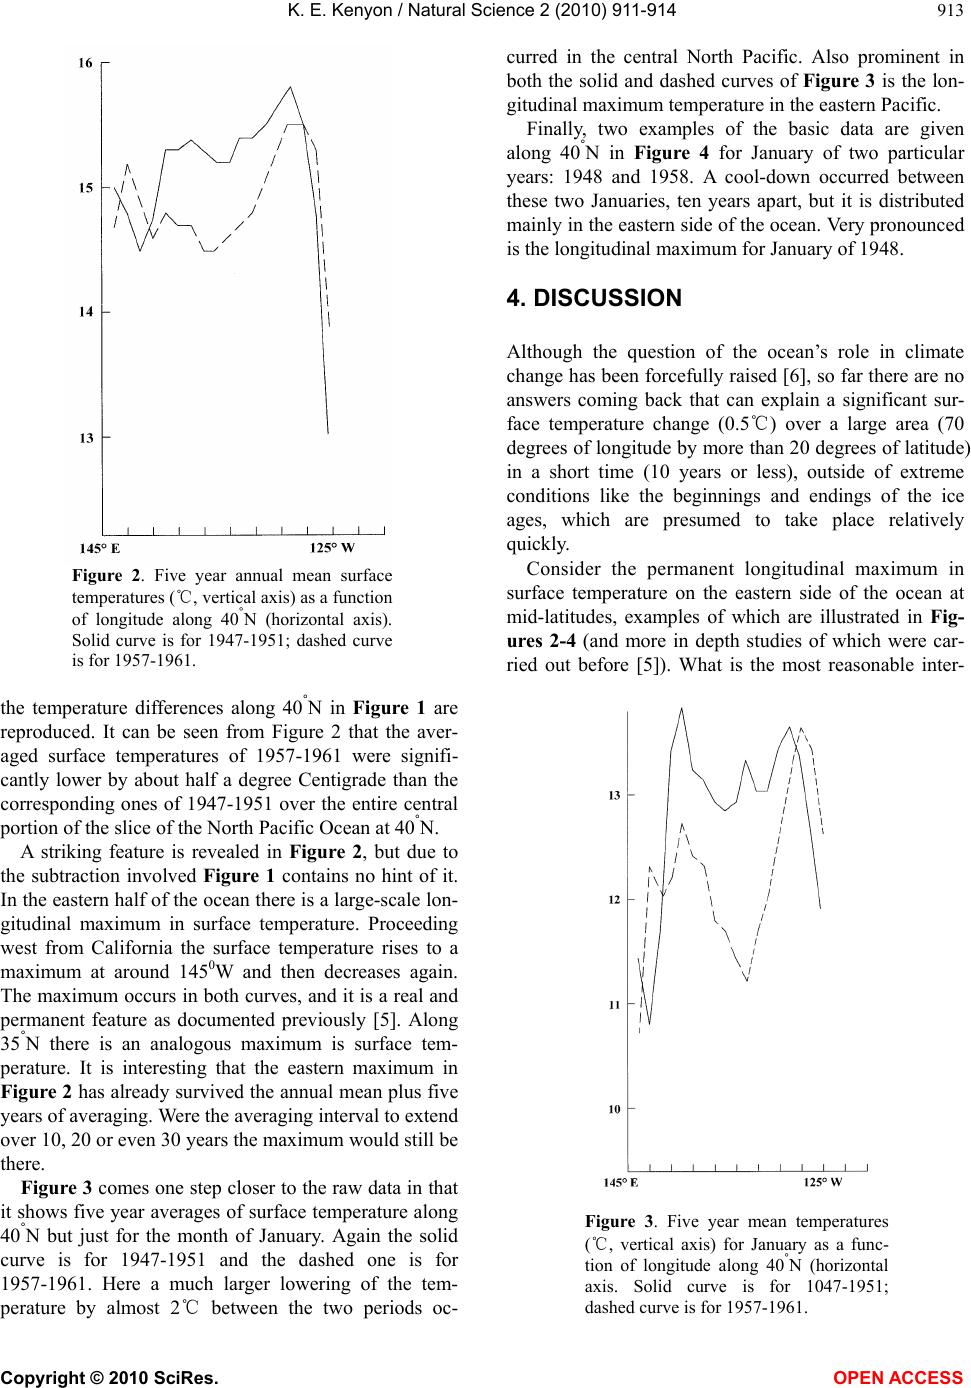 K. E. Kenyon / Natural Science 2 (2010) 911-914 Copyright © 2010 SciRes. OPEN ACCESS 913 Figure 2. Five year annual mean surface temperatures (℃, vertical axis) as a function of longitude along 40°N (horizontal axis). Solid curve is for 1947-1951; dashed curve is for 1957-1961. the temperature differences along 40°N in Figure 1 are reproduced. It can be seen from Figure 2 that the aver- aged surface temperatures of 1957-1961 were signifi- cantly lower by about half a degree Centigrade than the corresponding ones of 1947-1951 over the entire central portion of the slice of the North Pacific Ocean at 40°N. A striking feature is revealed in Figure 2, but due to the subtraction involved Figure 1 contains no hint of it. In the eastern half of the ocean there is a large-scale lon- gitudinal maximum in surface temperature. Proceeding west from California the surface temperature rises to a maximum at around 1450W and then decreases again. The maximum occurs in both curves, and it is a real and permanent feature as documented previously [5]. Along 35°N there is an analogous maximum is surface tem- perature. It is interesting that the eastern maximum in Figure 2 has already survived the annual mean plus five years of averaging. Were the averaging interval to extend over 10, 20 or even 30 years the maximum would still be there. Figure 3 comes one step closer to the raw data in that it shows five year averages of surface temperature along 40°N but just for the month of January. Again the solid curve is for 1947-1951 and the dashed one is for 1957-1961. Here a much larger lowering of the tem- perature by almost 2℃ between the two periods oc- curred in the central North Pacific. Also prominent in both the solid and dashed curves of Figure 3 is the lon- gitudinal maximum temperature in the eastern Pacific. Finally, two examples of the basic data are given along 40°N in Figure 4 for January of two particular years: 1948 and 1958. A cool-down occurred between these two Januaries, ten years apart, but it is distributed mainly in the eastern side of the ocean. Very pronounced is the longitudinal maximum for January of 1948. 4. DISCUSSION Although the question of the ocean’s role in climate change has been forcefully raised [6], so far there are no answers coming back that can explain a significant sur- face temperature change (0.5℃) over a large area (70 degrees of longitude by more than 20 degrees of latitude) in a short time (10 years or less), outside of extreme conditions like the beginnings and endings of the ice ages, which are presumed to take place relatively quickly. Consider the permanent longitudinal maximum in surface temperature on the eastern side of the ocean at mid-latitudes, examples of which are illustrated in Fig- ures 2-4 (and more in depth studies of which were car- ried out before [5]). What is the most reasonable inter- Figure 3. Five year mean temperatures (℃, vertical axis) for January as a func- tion of longitude along 40°N (horizontal axis. Solid curve is for 1047-1951; dashed curve is for 1957-1961. 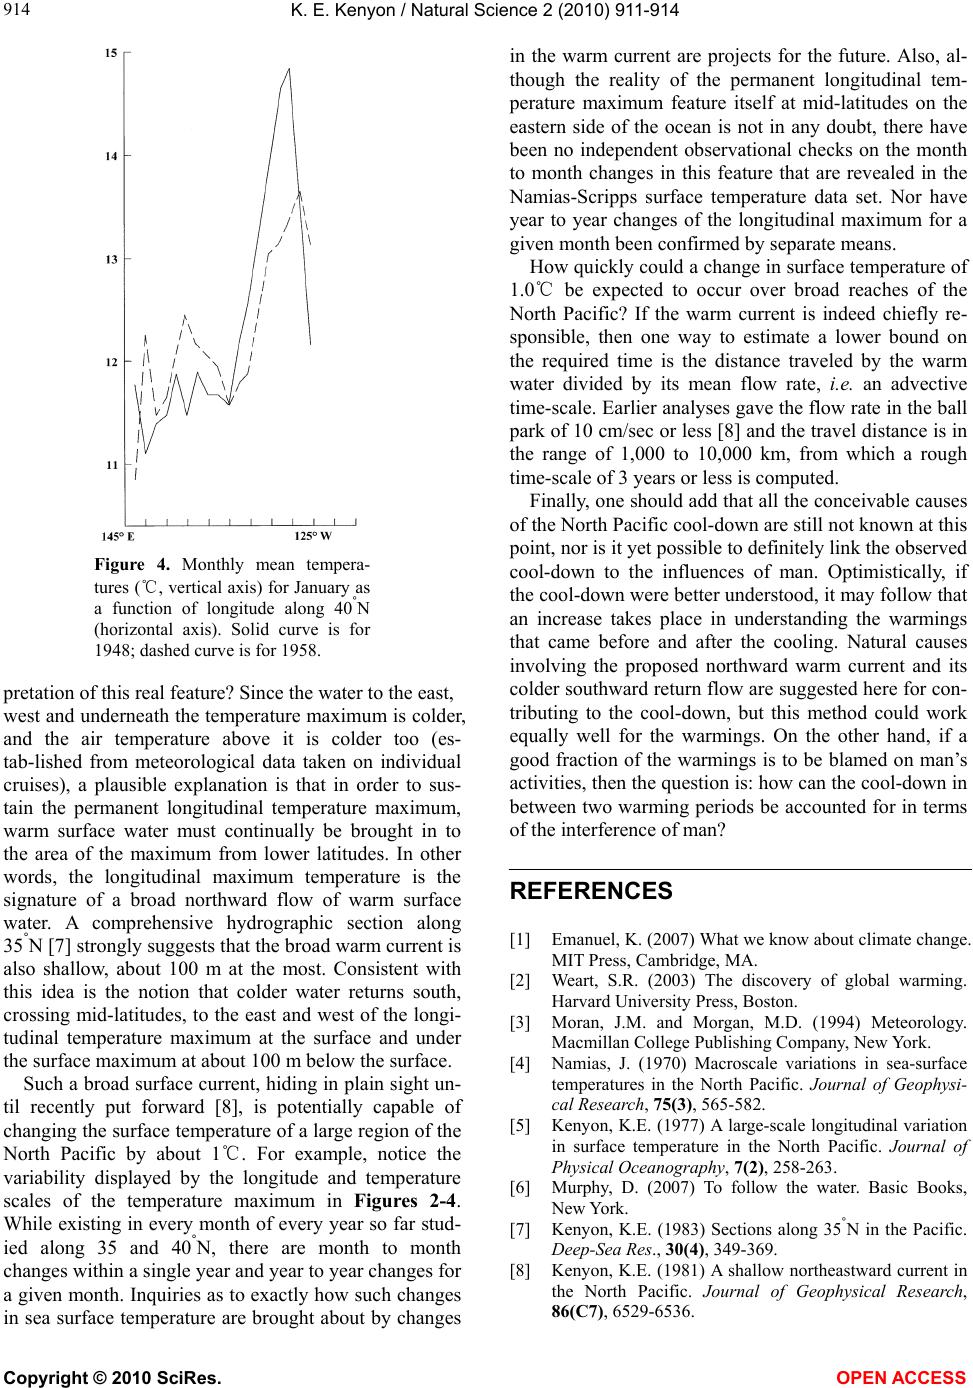 K. E. Kenyon / Natural Science 2 (2010) 911-914 Copyright © 2010 SciRes. OPEN ACCESS 914 Figure 4. Monthly mean tempera- tures (℃, vertical axis) for January as a function of longitude along 40°N (horizontal axis). Solid curve is for 1948; dashed curve is for 1958. pretation of this real feature? Since the water to the east, west and underneath the temperature maximum is colder, and the air temperature above it is colder too (es- tab-lished from meteorological data taken on individual cruises), a plausible explanation is that in order to sus- tain the permanent longitudinal temperature maximum, warm surface water must continually be brought in to the area of the maximum from lower latitudes. In other words, the longitudinal maximum temperature is the signature of a broad northward flow of warm surface water. A comprehensive hydrographic section along 35°N [7] strongly suggests that the broad warm current is also shallow, about 100 m at the most. Consistent with this idea is the notion that colder water returns south, crossing mid-latitudes, to the east and west of the longi- tudinal temperature maximum at the surface and under the surface maximum at about 100 m below the surface. Such a broad surface current, hiding in plain sight un- til recently put forward [8], is potentially capable of changing the surface temperature of a large region of the North Pacific by about 1℃. For example, notice the variability displayed by the longitude and temperature scales of the temperature maximum in Figures 2-4. While existing in every month of every year so far stud- ied along 35 and 40°N, there are month to month changes within a single year and year to year changes for a given month. Inquiries as to exactly how such changes in sea surface temperature are brought about by changes in the warm current are projects for the future. Also, al- though the reality of the permanent longitudinal tem- perature maximum feature itself at mid-latitudes on the eastern side of the ocean is not in any doubt, there have been no independent observational checks on the month to month changes in this feature that are revealed in the Namias-Scripps surface temperature data set. Nor have year to year changes of the longitudinal maximum for a given month been confirmed by separate means. How quickly could a change in surface temperature of 1.0℃ be expected to occur over broad reaches of the North Pacific? If the warm current is indeed chiefly re- sponsible, then one way to estimate a lower bound on the required time is the distance traveled by the warm water divided by its mean flow rate, i.e. an advective time-scale. Earlier analyses gave the flow rate in the ball park of 10 cm/sec or less [8] and the travel distance is in the range of 1,000 to 10,000 km, from which a rough time-scale of 3 years or less is computed. Finally, one should add that all the conceivable causes of the North Pacific cool-down are still not known at this point, nor is it yet possible to definitely link the observed cool-down to the influences of man. Optimistically, if the cool-down were better understood, it may follow that an increase takes place in understanding the warmings that came before and after the cooling. Natural causes involving the proposed northward warm current and its colder southward return flow are suggested here for con- tributing to the cool-down, but this method could work equally well for the warmings. On the other hand, if a good fraction of the warmings is to be blamed on man’s activities, then the question is: how can the cool-down in between two warming periods be accounted for in terms of the interference of man? REFERENCES [1] Emanuel, K. (2007) What we know about climate change. MIT Press, Cambridge, MA. [2] Weart, S.R. (2003) The discovery of global warming. Harvard University Press, Boston. [3] Moran, J.M. and Morgan, M.D. (1994) Meteorology. Macmillan College Publishing Company, New York. [4] Namias, J. (1970) Macroscale variations in sea-surface temperatures in the North Pacific. Journal of Geophysi- cal Research, 75(3), 565-582. [5] Kenyon, K.E. (1977) A large-scale longitudinal variation in surface temperature in the North Pacific. Journal of Physical Oceanography, 7(2), 258-263. [6] Murphy, D. (2007) To follow the water. Basic Books, New York. [7] Kenyon, K.E. (1983) Sections along 35°N in the Pacific. Deep-Sea Res., 30(4), 349-369. [8] Kenyon, K.E. (1981) A shallow northeastward current in the North Pacific. Journal of Geophysical Research, 86(C7), 6529-6536. |