

Paper Menu >>
Journal Menu >>
 Atmospheric and Climate Sciences, 2012, 2, 562-567 http://dx.doi.org/10.4236/acs.2012.24051 Published Online October 2012 (http://www.SciRP.org/journal/acs) The Impact of Climate Modes on Summer Temperature and Precipitation of Darwin, Australia, 1870-2011 Cameron Hunter, Jacqueline Binyamin* University of Winnipeg, Department of Geography, Winnipeg, Canada Email: *[email protected] Received August 23, 2012; revised September 25, 2012; accepted October 5, 2012 ABSTRACT Monthly mean summer (DJF) temperature and precipitation from Global Historical Climate Network (GHCN-V3) for the period of 1870-2011, are analyzed to assess the role of teleconnections on climate of Darwin, Australia. Indices of El Niño-Southern Oscillation (ENSO), Antarctic Oscillation (AAO), Pacific Decadal Oscillation (PDO), North Atlantic Oscillation (NAO), Arctic Oscillation (AO), and Pacific North American Oscillation (PNA) are extracted from monthly means and compared with climatic data of Darwin. Most of these climate modes are shown to have a strong influence on the monthly mean summer temperature and precipitation. ENSO is shown to have a positive relationship with the amount of precipitation received and a negative relationship with the temperature. Where an El Niño event produces warmer drier conditions and a La Niña event produces colder wetter conditions. The AAO is shown to cause cold and dry condition s during the positive phase and warm and wet conditions during the neg ative phase. The PDO is shown to cause El Niño like co ndition during the p ositive phase causing warmer, drier weather, and La Niña like conditio ns dur- ing the negative phase causing cooler, wetter weather. Through the analysis it is also shown that the NAO, AO, and PNA have little effect on the temperature and precipitation patterns of Darwin. Keywords: Climate Modes; Teleconnections; Climate of Darwin; Climate Change; Climate Variability; ENSO; AAO; PDO 1. Introduction Darwin, Australia latitude 12.4˚ south, longitude 130.9˚ east is located on Australia’s northwestern coast. Month- ly average temperature and total precipitation data for Darwin International Airport, which is approximately 3 km from the Indian Ocean and is 30 m above sea level are obtained from Global Historical Climate Network (GHCN-V3) for the period of 1870-2011. Darwin receives an average of 1693 mm of precipita- tion yearly, with the distribution of precipitation being very seasonal. Most of Darwin’s yearly total precipita- tion is received in the summer months (DJF), while Dar- win receives nearly no precipitation in the winter months (JJA). Darwin’s average annual temperature is 27.6˚C and due to its proximity to the ocean does not fluctuate much throughout the year. The temperature ranges from approximately 29˚C in summer to a low of 25.5˚C in winter. The proximity to the ocean mediated Darwin’s temperature, cooling the air during the summer months and warming the air during the winter months. This mod- erating effect causes Darwin’s small temperature range. This paper investigates the effect of six teleconnec- tions on summer temperature and precipitation of Darwin. These teleconnections include El Niño-Southern Oscilla- tion (ENSO), Antarctic Oscillation (AAO), Pacific De cadal Oscillation (PDO), North Atlantic Oscillation (NAO), Arctic Oscillation (AO), and Pacific North American Oscillation (PNA). Our study is important be- cause little work has been done on the effect that climate modes have on Darwin’s temperature and precipitation. The ENSO is categorized by sea surface temperature and atmospheric pressure anomalies, and measured using the Southern Oscillation Index (SOI) which is the pres- sure difference between Tahiti, and Darwin. ENSO has the strongest effect on the climate of the South Pacific, causing below average rainfall amounts during El Niño and above average rainfall amounts during La Niña for Darwin [1,2]. Several studies have explored the precipi- tation variability over Darwin and across the Australian continent [3-5]. While others have explored ENSO’s effect on the Australian continent [1,2,6-9]. The AAO is measured using the Antarctic Oscillation Index (AOI) which is the difference between the surface pressures at 40˚S and 65˚S [10]. The two phases of AAO, the positive phase and the negative phase, are classified by the strength of the subtropical high and the subpolar *Corresponding a uthor. C opyright © 2012 SciRes. ACS  C. HUNTER, J. BINYAMIN 563 low. The positive phase shows a strengthening of the subtropical high and a deepening of the subpolar low, creating a greater than normal pressure difference be- tween the two [11]. While the negative phase shows a weakening of th e subtropical high and subpolar low, cre- ating a weak pressure gradient [10]. The AAO has a strong effect on the location of the southern hemisphere midlatitudejet stream and through this affects the tem- perature and precipitation patterns throughout southern hemisph ere [4,10]. The PDO is a long-lived El Niño-like pattern of Pa- cific climate variability. Its events can persist for 20 - 30 years and have a strong effect on the climate of North America. Fluctuating sea surface temperatures (SSTs) in the central North Pacific and along the west coast of North America distinguishes the positive and negative phases of this climate mode. When the PDO is in its warm or positive phase, SSTs in the western coast of North America are relatively warm and central North Pacific SSTs are cooler and vice versa in the cool or negative phase causing a change in the temperature and precipitation patterns in these areas [12,13 ]. The NAO is the result of pressure differences between the Azores high and the Icelandic low [14,15]. NAO af- fects the northern hemisphere winter climates of eastern North America and Europe, and as well affects the posi- tion of the Atlantic storm track. The AO is identified by the pressure difference be- tween the polar high and the atmospheric low south of the pole [16]. The strong pressure gradient causes the circumpolar vortex to strengthen keeping the cold polar air north [17,18]. The strengthening of the circumpolar vortex causes mild weather throughout Europe and cold weather in Greenland and Newfoundland during the nor- thern hemisphere winter. The weak polar vortex brings cold weather to Europe and the United States and warm weather to Greenland and Newfoundland during the nor- thern hemisphere win t e r. The PNA affects the climate of the northern hemi- sphere. It deals with the 700 mb heights for the locations, Hawaii, the Aleutian Islands, southeastern United States and the Intermountain region of North America. The positive phase of the PNA shows higher than average heights over Hawaii and the Intermountain region of North American, while below average heights are re- corded over the Aleutian Islands and the southeastern United States. The negative phase shows a reversal of the heights of these areas [19]. These height anomalies affect the position of the East Asian jet stream and in the posi- tive phase produce above average temperature in the western United States and Canada and below average temperatures across the southern United States. PNA also affects the precipitation patterns of North America with the positive phase causing above average precipitantion on the Gulf of Alaska and below average precipitation for the Midwestern United States [19,20]. Section 2 describes temperature and precipitation resu- lts; and Section 3; summary and conclusions. 2. Results and Discussion 2.1. Temperature Most of the Australian continent has experienced a war- ming trend in the past century, except for a region of cooling in the northwest [5]. Risbey [5] links this region of cooling to the increased amount of precipitation re- ceived in this area in the past century, and a greater per- mcentage of cloudy days blocking incoming solar radia- tion. Figure 1 shows that the temperature of Darwin has cooled approximately by 1.5˚C over the past 129 years. While there is a large amount of year-to-year variation in the annual average temperature, there is clearly a strong cooling trend in the temperature. As Darwin is located along the northwest coast of Australia and as it is shown in Section 2.2., has seen an increase in the total precip ita- tion received, this blocking of solar radiation by cloud cover could be one of the causes of the cooling tempera- ture trend. Crowley [21] suggested that this cooling could be due to the northern hemisphere exporting cold water into the southern hemisphere. A seesaw effect is ob- nserved where warming in the northern hemisphere causes cold water from deep North Atlantic to circulate and surface in the southern hemisphere thereby cooling despite high CO2 levels [21]. Figure 2 shows again the trend of decreasing tem- peratures in Darwin, but it also reveals a period of colder than normal temperature. The period of 1942 to 2011 is shown to be on average 0.5˚C cooler than would be ex- pected by the trend. This period of cooling may be at- tributed to increased amounts of aerosols in the earth’s atmosphere specifically sulfate aerosols created by vol- canic activity, as well as anthropogenic activity. These Figure 1. Average annual temperature (˚C) for Darwin, 1882-2011. Data are incomplete for some years and there- fore are omitted. Copyright © 2012 SciRes. ACS  C. HUNTER, J. BINYAMIN 564 Figure 2. 30-year temperature (˚C) averages for Darwin, for the period 1882-2011. aerosols reflect incoming solar radiation and reduce the amount of radiation reaching the surface, as well as act- ing as cloud condensation nuclei and increasing the cloud cover. Through th ese processes, sulfate aerosols d ecrease the temperature of the surface and lower atmosphere. We believe that sulfate aerosols are one of the possible causes of this anomalous cold period from 1942-2011. The ENSO, AAO and the PDO show the strongest correlation with Darwin’s temperature. ENSO shows a strong negative correlation with the summer temperature at Darwin. The correlation coefficient of –0.36 means strong negative values of the SOI will produce above average temperatures. Large negative SOI values repre- sent strong El Niño events, these events seem to produce warm temperature anomalies, while positive SOI values represent La Niña event and produce cold anomalies at Darwin. Figure 3 shows this relationship between El Niño/La Niña events and the summer temperature in Darwin. The same relationship between temperature and SOI has also been recognized previously by Power et al. [6] and Suppiah [2]. This temperature trend could be due to the pressure systems above Darwin in summer during El Niño and La Niña events. During El Niño events a high-pressure system persists above Darwin , with air sin- king and diverging at the surface. Therefore there is no uplift over Darwin and thus no clouds to reflect incoming solar radiation. During La Niña events the opposite oc- curs and a low-pressure system over Darwin causes con- verging air and uplift. Greater amounts of cloud over can be expected to reflect solar radiation increasing the local albedo and so less radiation is received at the surface and lower temperatures are experienced. AAO also s eems to h ave a s trong eff ect on the av erag e summer temperature of Darwin with a correlation coeffi- cient of –0.42. Figure 4 shows strong positive AAO events produces colder temperatures while negative events produces warmer temperatures. The shift of the southern hemisphere midlatitude jet stream by the change in the pressure gradient between the polar and the sub- tropical pressure centers produces bands of varying tem- perature and rainfall differences in the southern hemi- sphere, with a latitudinal band of cool temperatures fal- ling on Australia during the positive phase and a latitu- dinal band of warmer temperatures during the negative phase [4]. PDO also shows a strong correlation with the average summer temperature of Darwin shown in Figure 5. The strong positive correlation coefficient of 0.37 shows PDO’s strong effect on the summer temperatures of Dar- win. The positive correlation means positive PDO even ts produce warm temperature anomalies while negative PDO events produce cold temperature anomalies. As we ll as affecting the atmosphere and oceans in the northern Pacific, the PDO also produces ENSO like conditions in the South Pacific. The PDO produces El Niño like condi- tions during the positive phase of the PDO, and La Niña like conditions during the negative phase of PDO [12]. The analogous ENSO conditions produced by the PDO explain the strong effect the PDO has on Darwin’s tem- perature. Figure 3. Correlation between average summer (DJF) Southern Oscillation index (SOI) and average summer te m- perature (˚C) for Darwin, 1882-2010. SOI data are from: http://www.cru.uea.ac.uk/cru/data/soi/soi.dat. Figure 4. Correlation between average summer (DJF) Ant- arctic Oscillation (AAO) index and average summer tem- perature (˚C) for Darwin, 1980-2010. AAO Index data are from: http://www.cpc.ncep.noaa.gov/products/precip/CWlink/dail y_ao_index/aao/monthly.aao.index.b79.current.ascii.table. Copyright © 2012 SciRes. ACS  C. HUNTER, J. BINYAMIN 565 Figure 5. Correlation between summer (DJF) Pacific De- cadal Oscillation (PDO) index and the average summer temperature (˚C) for Darwin, 1902-2010. PDO Index data are from: http://jisao.washington. edu/pdo/PDO.latest. The NAO, AO, and PNA are shown to have little ef- fect on the temperature of Darwin. As these three tele- connections affect the atmospheric and oceanic circula- tion in the northern hemisphere, their effect on Darwin if they have any, is too small to be discovered. If there is any effect on the climate of Darwin, it is likely masked by other interactions due to the large distance separating Darwin from the centers of action of these oscillation systems. 2.2. Precipitation Darwin has experienced an increase in the yearly total precipitation received in the last 142 years (Figure 6). On average Darwin received 650 mm more precipitation in a year now than in 1870. The trend in precipitation at Darwin follows the trend of precipitation across all of Australia, with the coastal wet regions receiving more precipitation and the interior dry regi ons receiving le ss [5]. As with temperature the ENSO, AAO, and PDO all are shown to have strong effects on the yearly summer pre- cipitation totals. Again AO, NAO and PNA have little effect on Darwin’s precipitation. The correlation coeffi- cient between summer averages of SOI and total summer precipitation for Darwin is 0.21 (Figure 7). The strong positive correlation means that La Niña events, (positive SOI values) causes greater than normal precipitation and El Niño events (negative SOI values) produces less pre- cipitation than normal. These precipitation anomalies are due to the persistent high and low pressures above Dar- win during La Niña and El Niño. During El Niño the anomalous high-pressure over Darwin causes divergence and sinking air, as there are few processes of up lift in this area, therefore, less precipitation is received. La Niña events have the opposite effect, anomalous low-pressure over Darwin produces lots of uplift and thus lots of pre- cipitation in the area [4,6,11]. Many strong El Niño/La Niña events have caused large precipitation anomalies in Darwin. Both the summers o f 1982-1983, and 1997-1998 were strong El Niño events with summer average SOI values of –3.06 and –2.16 respectively; these years re- ceived 576 mm, and 532 mm less than normal precipita- tion. The strong La Niña event in the summers of 1998- 1999 had an av erag e SOI v alue of 1.16 , whic h re - cord ed 148 mm of precipitation more than normal (Figure 6). The AAO has the strongest effect on the summer pre- cipitation totals for Darwin. Figure 8 clearly shows the positive relationship between the AAO index and the total summer’s precipitation values with a correlation coefficient of 0 .4. The positive cor relation between AAO index and summer p recipitation means the positiv e phase of AAO will cause greater than normal precipitation val- ues in Darwin, and the negative ph ase of AAO will cau se less than normal precipitation values. The movement of the southern hemisphere midlatitude jet stream south in the positive phase produ ces a dry band b etween 30˚S and 50˚S and a wetter band between 20˚C and 30˚S [4]. Dar- win (latitude 12.4˚S) is located nearest to the later band and obviously receives some residual effect of the wet band. While the negative ph ase of AAO cause a dry band between 20˚S and 30˚S and this must cause less precipi- tation in Darwin. The PDO also shows a strong influence on the pre- cipitation of Darwin. As stated above the PDO creates El Niño/La Niña conditions in the southern Pacific, as it affects the Northern Pacific [12]. The correlation coeffi- cient of –0.21 shows that dry El Niño type conditions are produced by the positiv e phase of PDO and wet La Niña like conditions are produced during by the negative phase of PDO (Figure 9). The figure also shows the negative relationship between PDO and summer precipi- tation values. 3. Summary and Conclusions Darwin has undergone a cooling of 1.5˚C of its average Figure 6. Total annual precipitation (mm) received in Dar- win, 1870-2011. Copyright © 2012 SciRes. ACS 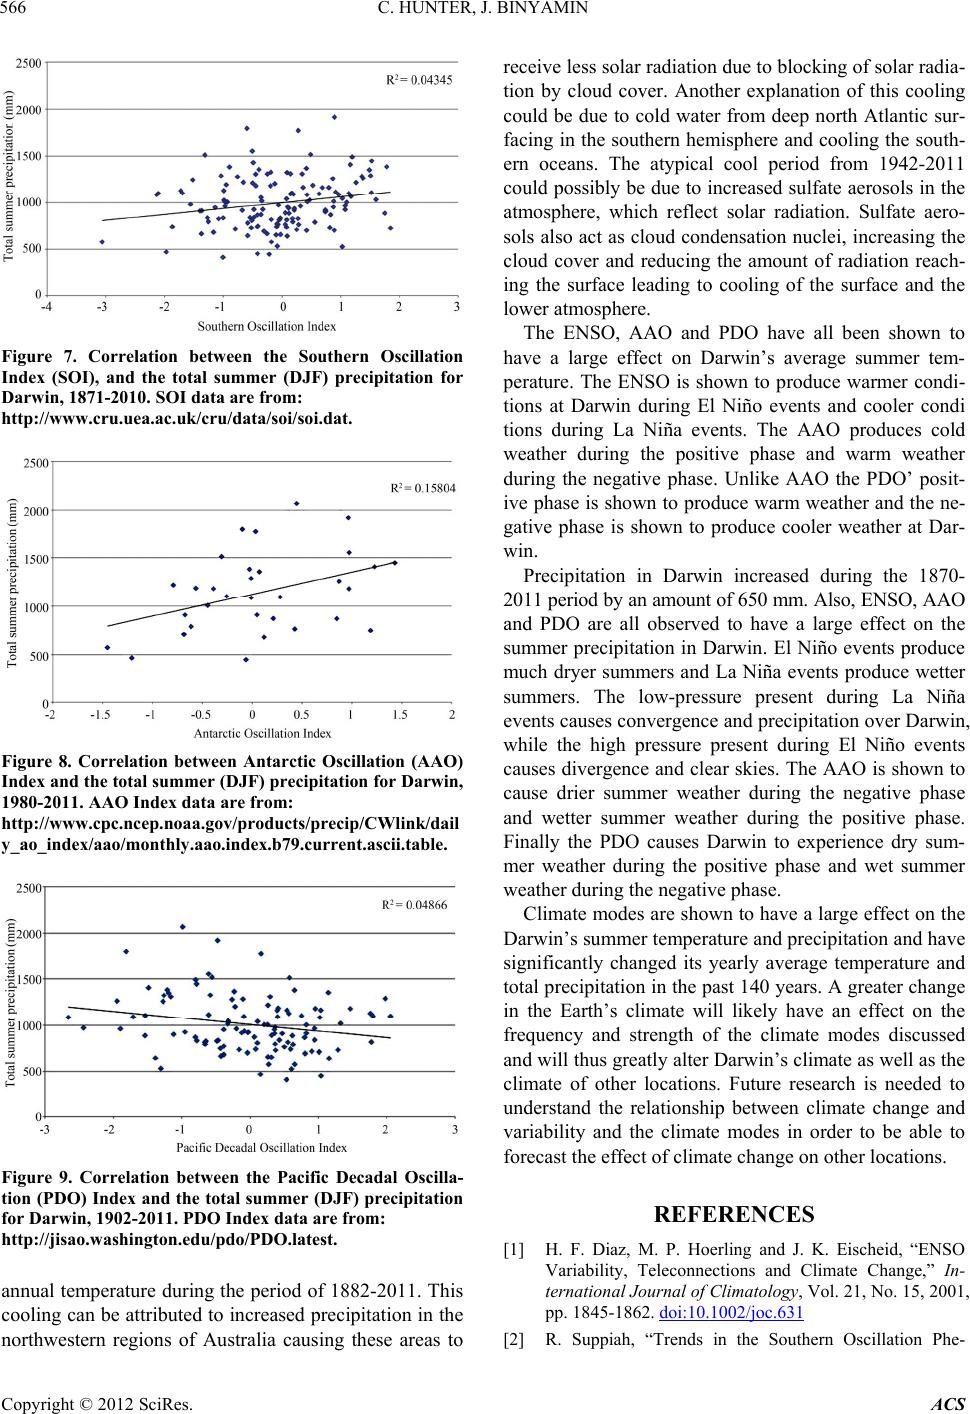 C. HUNTER, J. BINYAMIN 566 Figure 7. Correlation between the Southern Oscillation Index (SOI), and the total summer (DJF) precipitation for Darwin, 1871-2010. SOI data are from: http://www.cru.uea.ac.uk/cru/data/soi/soi.dat. Figure 8. Correlation between Antarctic Oscillation (AAO) Index and the total summer (DJF) precipitation for Darwin, 1980-2011. AAO Index data are from: http://www.cpc.ncep.noaa.gov/products/precip/CWlink/dail y_ao_index/aao/monthly.aao.index.b79.current.ascii.table. Figure 9. Correlation between the Pacific Decadal Oscilla- tion (PDO) Index and the total summer (DJF) precipitation for Darwin, 1902-2011. PDO Index data are from: http://jisao.washington.edu/pdo/PDO.latest. annual temperature dur ing the period of 1882-2011 . This cooling can be attributed to increased precipitation in the northwestern regions of Australia causing these areas to receive less solar radiation due to blocking of solar radia- tion by cloud cover. Another explanation of this cooling could be due to cold water from deep north Atlantic sur- facing in the southern hemisphere and cooling the south- ern oceans. The atypical cool period from 1942-2011 could possibly be due to increased sulfate aerosols in th e atmosphere, which reflect solar radiation. Sulfate aero- sols also act as cloud condensation nuclei, increasing the cloud cover and reducing the amount of radiation reach- ing the surface leading to cooling of the surface and the lower atmosphere. The ENSO, AAO and PDO have all been shown to have a large effect on Darwin’s average summer tem- perature. The ENSO is shown to produce warmer condi- tions at Darwin during El Niño events and cooler condi tions during La Niña events. The AAO produces cold weather during the positive phase and warm weather during the negative phase. Unlike AAO the PDO’ posit- ive phase is shown to produce warm weather and the ne- gative phase is shown to produce cooler weather at Dar- win. Precipitation in Darwin increased during the 1870- 2011 period by an amount of 650 mm. Also, ENSO, AAO and PDO are all observed to have a large effect on the summer precipitation in Darwin. El Niño events produce much dryer summers and La Niña events produce wetter summers. The low-pressure present during La Niña events causes convergence and precipitation over Darwin, while the high pressure present during El Niño events causes divergence and clear skies. The AAO is shown to cause drier summer weather during the negative phase and wetter summer weather during the positive phase. Finally the PDO causes Darwin to experience dry sum- mer weather during the positive phase and wet summer weather during the negative phase. Climate modes are shown to have a large effect on the Darwin’s summer temperature and precipitation and have significantly changed its yearly average temperature and total precipitation in the past 1 40 years. A greater change in the Earth’s climate will likely have an effect on the frequency and strength of the climate modes discussed and will thus greatly alter Darwin’s climate as well as the climate of other locations. Future research is needed to understand the relationship between climate change and variability and the climate modes in order to be able to forecast the effect of climate change on other locations. REFERENCES [1] H. F. Diaz, M. P. Hoerling and J. K. Eischeid, “ENSO Variability, Teleconnections and Climate Change,” In- ternational Journal of Climatology, Vol. 21, No. 15, 2001, pp. 1845-1862. doi:10.1002/joc.631 [2] R. Suppiah, “Trends in the Southern Oscillation Phe- Copyright © 2012 SciRes. ACS  C. HUNTER, J. BINYAMIN Copyright © 2012 SciRes. ACS 567 nomenon and Australian Rainfall and Changes in Their Relationship,” International Journal of Climatology, Vol. 24, No. 3, 2004, pp. 269-290. doi:10.1002/joc.1001 [3] B. Meneghini, I. Simminds and I. N. Smith, “Association between Australian Rainfall and the Southern Annular Mode,” International Journal of Climatology, Vol. 27, No. 1, 2007, pp. 109-121. doi:10.1002/joc.1370 [4] I. G. Watterson, “Components of Precipitation and Tem- perature anomalies and the Change Associated with the Modes of the Southern Hemisphere,” International Jour- nal of Climatology, Vol. 29, No. 6, 2009, pp. 809-827. doi:10.1002/joc.1772 [5] J. S. Risbey, “Dangerous Climate Change and Water Resources in Australia,” Regional Environmental Change, Vol. 11, Suppl. 1, 2011, pp. 190-203. doi:10.1007/s10113-010-0176-7 [6] S. Power, T. Casey, C. Follard, A. Colman and V. Mehta, “Inter-Decadal Modulation of the Impact of ENSO on Australia,” Climate Dynamics, Vol. 15, No. 5, 1999, pp. 319-324. doi:10.1007/s003820050284 [7] L. D. Rotstayn, M. A. Collier, M.R. Dix, Y. Feng, H. B. Gordon, S. P. O’Farrell, I. N. Smith and J. Syktus, “Im- proved simulation of Australian Climate and ENSO-Re- lated Rainfall Variability in a Global Climate Model with an Interactive Aerosol Treatment,” International Journal of Climatology, Vol. 30, 2010, pp. 1067-1088. [8] K. Wolter and M. S. Timlin, “El Niño/Southern Oscilla- tion Behavior Since 1871 as Diagnosed in a Extended Multivariate ENSO Index (MEI.ext),” International Jour- nal of Climatology, Vol. 31, No. 7, 2011, pp. 1047-1087. doi:10.1002/joc.2336 [9] K. S. Lui and J. C. Chan, “Interannual Variation of South- ern Hemisphere Tropical Cyclone Activity and Seasonal Forecast of Tropical Cyclone in the Australian Region,” International Journal of Climatology, Vol. 32, No. 2, 2012, pp. 190-202. doi:10.1002/joc.2259 [10] D. Gong and S. Wang, “Definition of Antarctic Oscilla- tion I nde x,” Geophy sical Rese arch Letters, Vol. 26, No. 4, 1999, pp. 459-462. doi:10.1029/1999GL900003 [11] Intergovernmental Panel on Climate Change (IPCC), “Climate Change 2007: The Physical Science Basis,” 2007. http://www.ipcc.ch/publications_and_data/publications_i pcc_fourth_assessment_report_wg1_report_the_physical_ science_basis.htm [12] N. J. Mantua and S. R. Hare, “The Pacific Decadal Oscil- lation,” Journal of Oceanography, Vol. 58, No. 1, 2002, pp. 35-44. doi:10.1023/A:1015820616384 [13] S. L. Lapp, J. St. Jacques, E. M. Barrow and D. J. Sauchyn, “GCM projections for the Pacific Decadal Os- cillation under Greenhouse Forcing for the Early 21st Century,” International Journal of Climatology, Vol. 32, No. 9, 2011, pp. 1423-1442. doi:10.1002/joc.2364 [14] J. W. Hurrel and H. Van Loon, “Decadal Variation in Climate Associated with the North Atlantic Oscillation,” Climate Change, Vol. 36, No. 3-4, 1997, pp. 301-326. doi:10.1023/A:1005314315270 [15] J. Marshall, Y. Kushnir, D. Battisti, P. Chang, A. Czaja, R. Dickson, J. Hurrel, M. McCartney, R. Saravanan and M. Visbeck, “North Atlantic Climate Variability: North Atlantic Climate Variability: Phenomena, Impacts and Mechanisms,” International Journal of Climatology, Vol. 21, No. 15, 2001, pp. 1863-1898. doi:10.1002/joc.693 [16] M. H. P. Ambaum, B. J. Hoskins and D. B. Stephenson, “Arctic Oscillation or North Atlantic Oscillation?” Jour- nal of Climate, Vol. 14, No. 16, 2001, pp. 3495-3507. doi:10.1175/1520-0442(2001)014<3495:AOONAO>2.0. CO;2 [17] D. W. J. Thompson and J. M. Wallace, “The Arctic Os- cillation Signature in the Summertime Geopotential Height and Temperature Fields,” Geophysical Research Letters, Vol. 25, No. 9, 1998, pp. 1297-1300. doi:10.1029/98GL00950 [18] I. G. Rigor, J. M. Wallace and R. L. Colony, “Response of Sea Ice to the Arctic Oscillation,” Journal of Climate, Vol. 15, No. 18, 2002, pp. 2648-2663. doi:10.1175/1520-0442(2002)015<2648:ROSITT>2.0.C O;2 [19] NOAA Climate Prediction Center, “Pacific/ North Amer- ica (PNA),” 2012. http://www.cpc.ncep.noaa.gov/data/ teledoc/pna.shtml. [20] D. J. Leather, B. Yarnal and M. A. Palecki, “The Pacific/ North American Teleconnection Patter and United States Climate. Part I: Regional Temperature and Precipitation Associations,” Journal of Climate, Vol. 4, No. 5, 1991, pp. 517-528. doi:10.1175/1520-0442(1991)004<0517:TPATPA>2.0.C O;2 [21] T. J. Crowley, “North Atlantic Deep Water Cools the Southern Hemisphere,” Paleoceanography, Vol. 7, No. 4, 1992, pp. 489-497. doi:10.1029/92PA01058 |