

Paper Menu >>
Journal Menu >>
 Advances in Chemical Engineering and Science, 2012, 2, 481-489 http://dx.doi.org/10.4236/aces.2012.24059 Published Online October 2012 (http://www.SciRP.org/journal/aces) Conceptual Modeling of Contaminated Solute Transport Based on Stream Tube Model Seung-Gun Chung1,2, Soon-Jae Lee1,2, Dong-Ju Kim2, Sang-Hyup Lee1, Jae-Woo Choi1* 1Center for Water Resource Cycle Research, Korea Institute of Science and Technology, Seoul, South Korea 2Department of Earth and Environmental Sciences, College of Science, Korea University, Seoul, South Korea Email: *[email protected] Received July 28, 2012; revised August 30, 2012; accepted September 9, 2012 ABSTRACT In this study, we performed a conceptual modeling on solute transport based on theoretical stream tube model (STM) with various travel time distributions assuming a pure convective flow through each tube in order to investigate how the lengths and distributions of solute travel time through STM affect the breakthrough curves at the end mixing surface. The conceptual modeling revealed that 1) the shape of breakthrough curve (BTC) at the mixing surface was determined by not only input travel time distributions but also solute injection mode such as sampling time and pulse lengths; 2) the increase of pulse length resulted in the linear increase of the first time moment (mean travel time) and quadratic in- crease of the second time moment (variance of travel time) leading to more spreading of solute, however, the second time moment was not affected by travel time distributions; and 3) for a given input distributions the increase in travel distance resulted in more dispersion with the quadratic increase of travel time variance. This indicates that stream tube model obeying strictly pure convective flow follows the concept of convective-lognormal transport (CLT) model re- gardless the input travel time distributions. Keywords: Conceptual Modeling; Solute Transport; Pure Convective Flow; Stream Tube Model; Travel Time Distribution 1. Introduction At macroscopic scale, there are three basic causes of ve- locity difference in pore-water that are friction loss, dif- ferences in pore size and path length, all or each of which leads to mixing of solute and thereby brings about me- chanical dispersion [1]. This mechanical dispersion is considered as a key parameter responsible for mixing or dilution of solutes during transport through soils and dis- tinguished from molecular diffusion arising from density or concentration differences. Combination of mechanical dispersion with molecular diffusion is termed hydrody- namic dispersion which constitutes major transport pa- rameters of solute transport equation together with con- vection. For instance, the convection-dispersion equation (CDE) of solute transport for nonreactive solute is de- scribed by only these two parameters. It is, however, based on a set of assumptions that are likely to be valid only under certain conditions in soil or aquifer systems. The CDE makes the hypothesis that the dispersion proc- ess is formally equivalent to diffusion even though dis- persion is a convective transport process. Because the CDE is valid only after sufficient time has elapsed to smooth out transport by convective velocity differences along the direction of motion, it cannot be valid at early times. For this reason, Jury [2] developed an alternative formulation for solute transport, called the transfer function or convective lognormal transfer func- tion (CLT) model, which does not require the restrictive assumptions of the CDE and can be applied to problems at different scales. This model relates an input condition to the output variable of interest based on the assumption that the velocity of a solute particle remains constant along its travel path through the soil. It further assumes that there is no exchange of solute particles between pores with different water velocities. In this regard, sol- ute particle arrival times are perfectly correlated with lognormal distribution of pore water velocities and solute travel time variance increases quadratically with depth. Recently Bardsley [3] studied temporal moments of a tracer pulse in a perfectly parallel flow system by parti- tioning water flow into isolated one-dimensional stream tubes which maintain spatial correlation of all properties in the direction of flow. The individual flow tubes in the parallel flow model are referred to as channels for frac- ture-flow and layers in the context of perfectly stratified aquifer systems. *Corresponding author. C opyright © 2012 SciRes. ACES  S.-G. CHUNG ET AL. 482 Tracer transport in parallel systems provides a non- diffusive mechanism contributing to dispersion [4-8]. This stream tube effect has been referred to as a convec- tive-dispersive process [9,10], causing tracer arrival-time variance to increase as a quadratic function of travel dis- tance for convective flow. Since within a single stream tube all hydraulic properties remain constant, the distri- bution of travel time or flow velocities between stream tubes will be the utmost important factors determining the dispersive process at the outflow mixing surface. In the previous studies of dispersion, the effect of normal distributions [11,12], normal or lognormal arrival times [10,13,14] between the stream tubes on solute transport were investigated. However, to date there has been no systematic study on both a pure convective process within a stream tube and the effect of normal or log- normal distributions of arrival times between stream tubes on solute transport. In addition to the travel time distributions, there would be some other factors such as sampling time and pulse duration which influence the dispersive process for pure convective flow. The objective of this study is (1) to generate the break- through curves (BTC) of nonreactive solute using a con- ceptual stream tube model (STM) by assuming pure convective process and (2) to investigate how the pulse conditions and various travel time distributions affect the transport concept of stream tube model using time mo- ment analysis. 2. Material and Methods 2.1. Modeling of Conceptual Stream Tube The conceptual stream tube model can be constructed in two different ways. The first is a diameter-based type to assemble a finite number of tubes with equal lengths but different cross-sectional areas or diameters so that dif- ferent average flow velocities are achieved by allowing equal flow rate to each tube. The other is a length-based type to construct the tubes with equal diameter but dif- ferent lengths in order for the stream tubes to have nor- mal or lognormal distributions of travel time when an equal amount of discharge is imposed to each tube. In this study, the latter case is adopted. Following assumptions should be made for the con- ceptual stream tube model: 1) The stream tube model is constructed with a finite number of bundles of one-dimensional stream tubes with equal diameter but different lengths. 2) Flow velocity within a single tube is steady and in- variant. 3) Tracer solution is injected uniformly at the inlet boundary of each tube. 4) Tracer transport in each tube obeys the convective flow. 5) Molecular diffusion during pulse input is neglected. 6) Dispersive mixing occurs due to velocity differences between tubes at the outflow mixing surface by instanta- neous and complete mixing. 7) Effluents are collected at one common mixing sur- face regardless the differences in tube lengths. 8) Velocity differences can be realized by normal or lognormal distributions of travel length or time. Consider a set of stream tubes which has a normal dis- tribution of tube length as shown in Figure 1 where each bundle consisting of the same tube length has a different tube number. Let the length of ith tube bundle be Li, the number of ith tube bundle Ni. Then the total number of max 1 i i i NTT N . Let the diameter and cross- tubes is sectional area of each tube be d and A, and injection flow rate at the inlet boundary Q, injection concentration Co, pulse duration To. Then the flow velocity and flow rate in each tube is vQNTTA , qQNTT LvT and pulse length 0p t . If a STM consists of five different lengths (30, 40, 50, 60, 70 cm) and sampling time inter- val Lvt , then the sampling length interval and number of pulse length p. Let the number of sampling J and then sampling time will be NPL LL 12 J TJ t L. For instance, the number of times of which can have the effluent concentration for ith bundle ii TLLL, and the number of times of required for breakthrough of ith tube ii TT . Then the number of tubes with tracer effluent at sampling time J would be the following: T NPL where J iii iI NTENIi TJTT (1) Therefore the effluent concentration at J will be 00 J J J qtNTE NTE CC C Qt NTT L (2) In order to investigate the effect of travel time distri- bution on the convective-dispersive process, we gener- ated three different input probability density functions of travel times or tube lengths (60, 80, 100, 120, 140 cm) as was shown in Figure 2 and used them for simulation of BTCs at the mixing surface based on pure convective flow within stream tubes. Sensitivity analysis was also performed to see the effect of sampling time ( = 10, 20 cm) and pulse length (NPL = 1 to 6) on the BTCs. 2.2. Time Moment Analysis In order to investigate the effect of sampling time, pulse duration and input distribution of travel length on the dispersive process along stream tubes, time moment analysis was performed. The simulated concentrations in time were first converted to probability density function (pdf) as: Copyright © 2012 SciRes. ACES 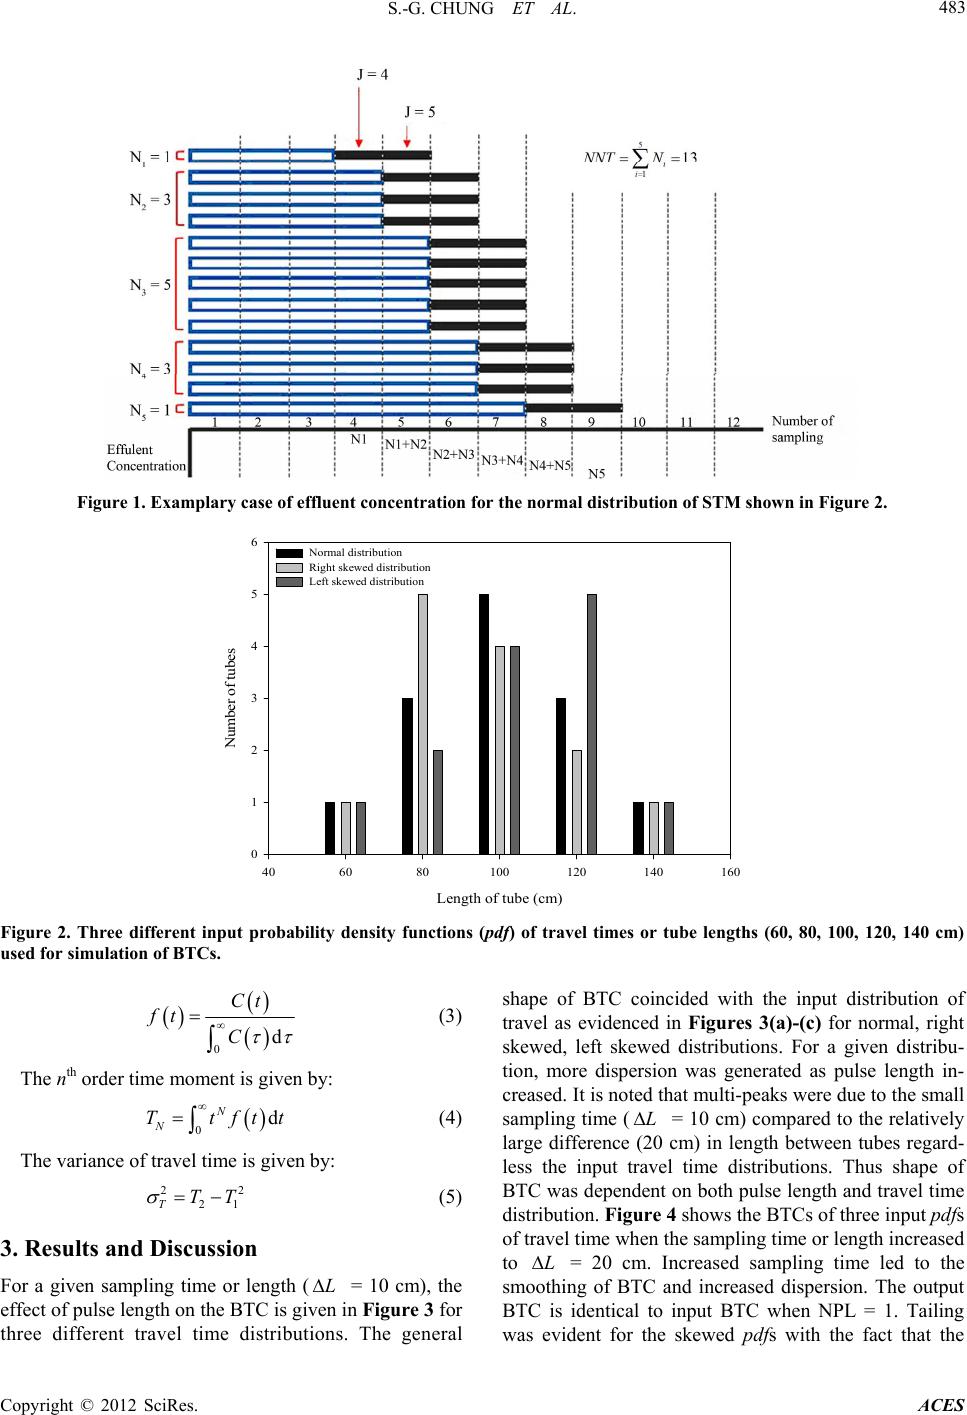 S.-G. CHUNG ET AL. Copyright © 2012 SciRe ACES 483 Figure 1. Examplary case of effluent concentration for the normal distribution of STM shown in Figure 2. Length of tube (cm) 406080100 120 140 160 Number of tubes 0 1 2 3 4 5 6 Normal distribution Right skewed distribution Left skewed distribution Figure 2. Three different input probability density functions (pdf) of travel times or tube lengths (60, 80, 100, 120, 140 cm) used for simulation of BTCs. s. 0d Ct C ft 0d N Ttftt 22 21TTT L L (3) The nth order time moment is given by: N (4) The variance of travel time is given by: (5) 3. Results and Discussion For a given sampling time or length ( = 10 cm), the effect of pulse length on the BTC is given in Figure 3 for three different travel time distributions. The general shape of BTC coincided with the input distribution of travel as evidenced in Figures 3(a)-(c) for normal, right skewed, left skewed distributions. For a given distribu- tion, more dispersion was generated as pulse length in- creased. It is noted that multi-peaks were due to the small sampling time ( = 10 cm) compared to the relatively large difference (20 cm) in length between tubes regard- less the input travel time distributions. Thus shape of BTC was dependent on both pulse length and travel time distribution. Figure 4 shows the BTCs of three input pdfs of travel time when the sampling time or length increased to L = 20 cm. Increased sampling time led to the smoothing of BTC and increased dispersion. The output BTC is identical to input BTC when NPL = 1. Tailing was evident for the skewed pdfs with the fact that the 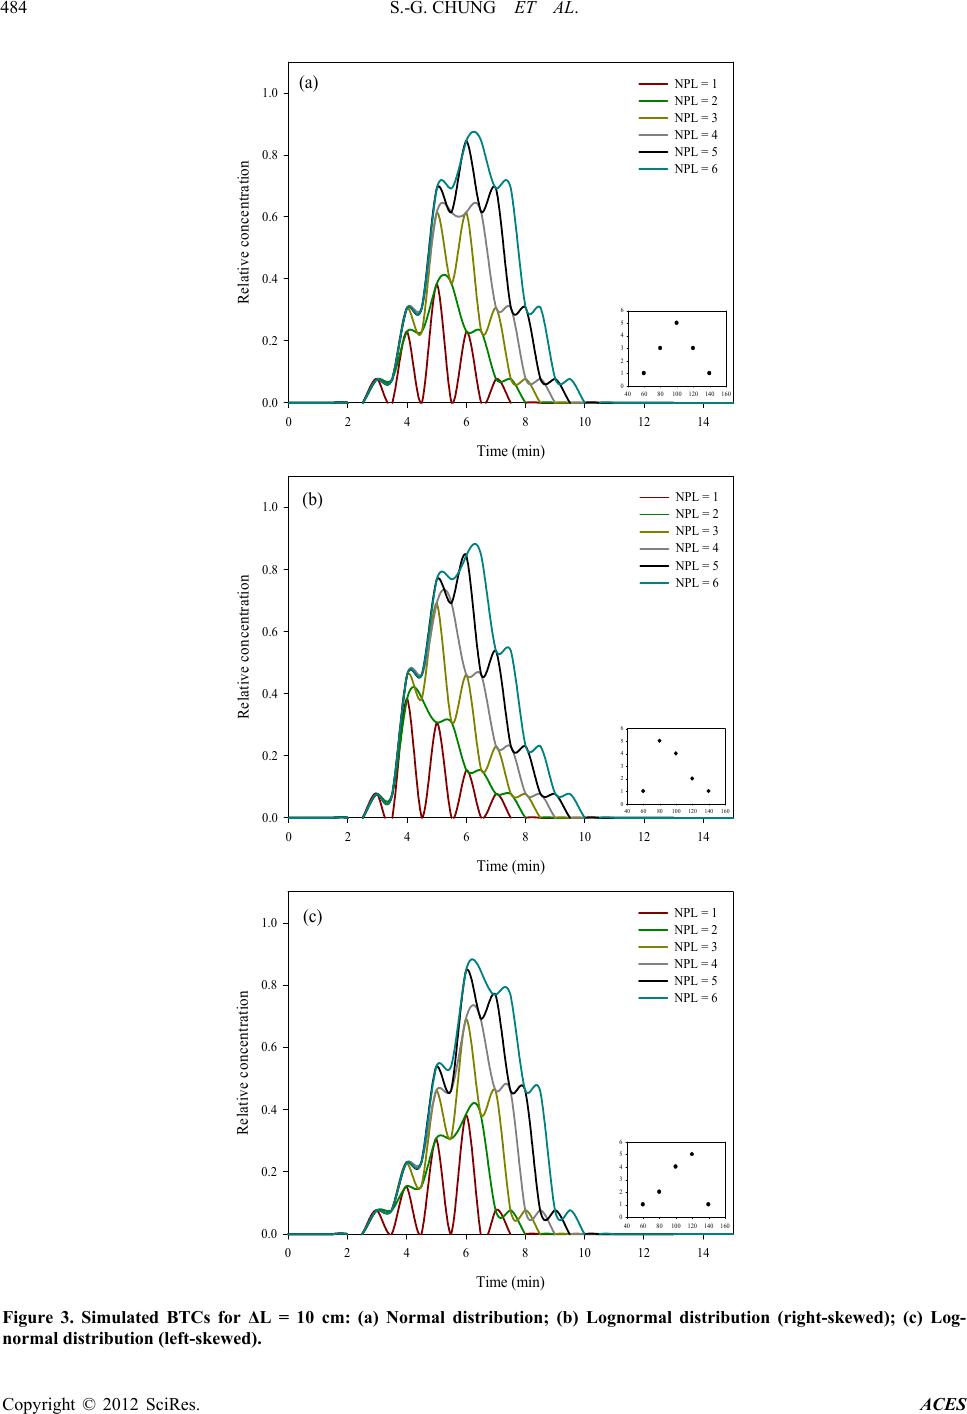 S.-G. CHUNG ET AL. 484 Time (min) 02468101214 Relative concentration 0.0 0.2 0.4 0.6 0.8 1.0 NPL = 1 NPL = 2 NPL = 3 NPL = 4 NPL = 5 NPL = 6 406080100 120140 160 0 1 2 3 4 5 6 (a) Time (min) 02468101214 Relative concentration 0.0 0.2 0.4 0.6 0.8 1.0 NPL = 1 NPL = 2 NPL = 3 NPL = 4 NPL = 5 NPL = 6 406080100 120 140160 0 1 2 3 4 5 6 (b) Time (min) 02468101214 Relative concentration 0.0 0.2 0.4 0.6 0.8 1.0 NPL = 1 NPL = 2 NPL = 3 NPL = 4 NPL = 5 NPL = 6 406080100 120 140 160 0 1 2 3 4 5 6 (c) Figure 3. Simulated BTCs for ΔL = 10 cm: (a) Normal distribution; (b) Lognormal distribution (right-skewed); (c) Log- normal distribution (left-skewed). Copyright © 2012 SciRes. ACES 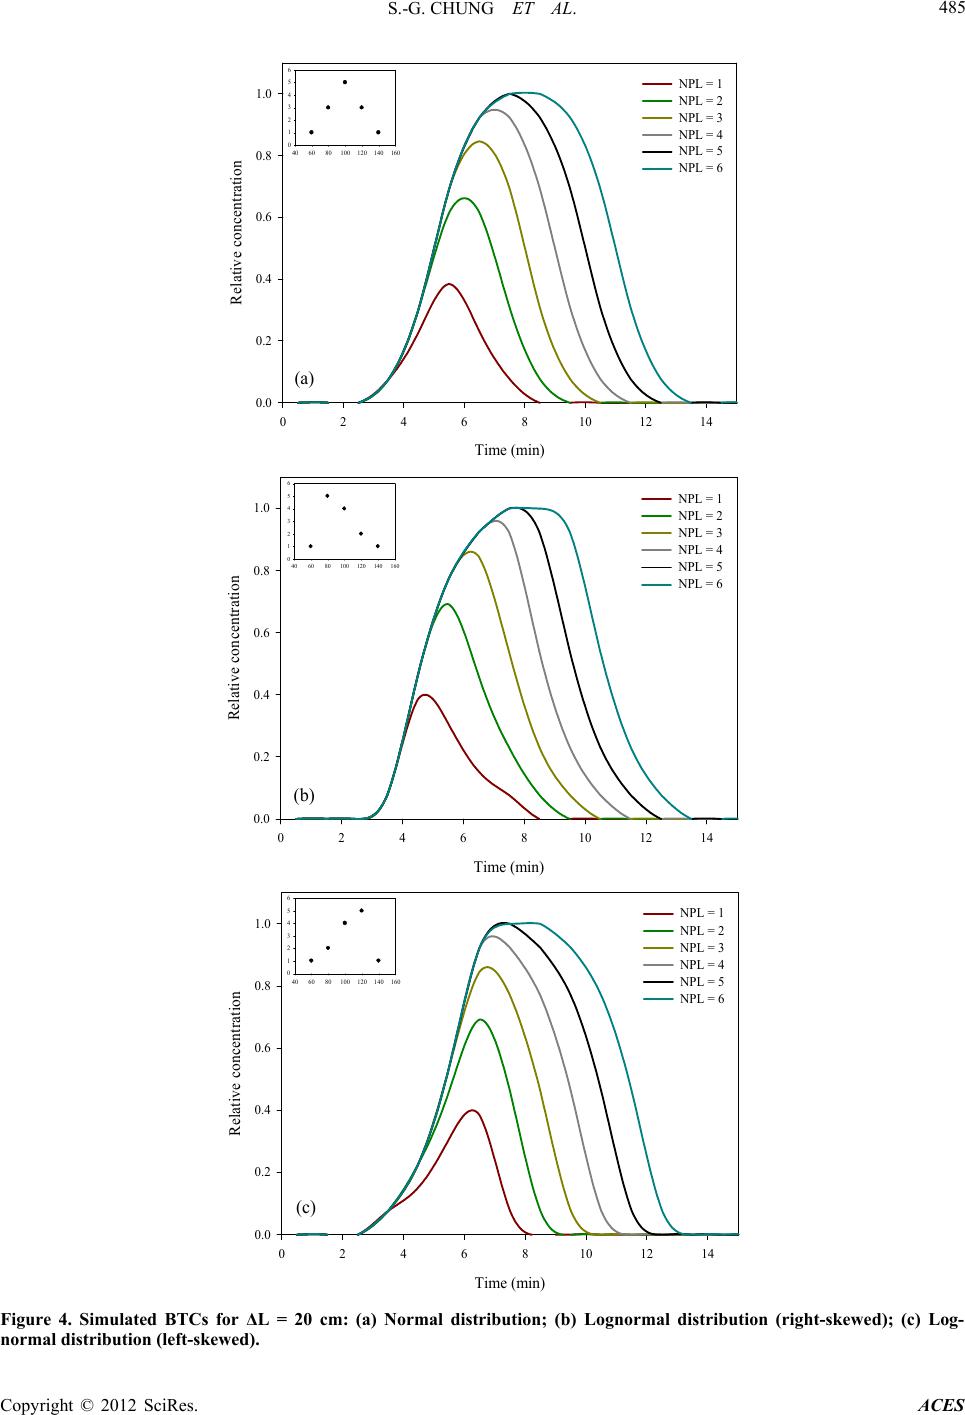 S.-G. CHUNG ET AL. 485 Time (min) 02468101214 Relative concentration 0.0 0.2 0.4 0.6 0.8 1.0 NPL = 1 NPL = 2 NPL = 3 NPL = 4 NPL = 5 NPL = 6 406080100120 140 160 0 1 2 3 4 5 6 (a) Time (min) 0 2 4 6 8101214 Relative concentration 0.0 0.2 0.4 0.6 0.8 1.0 NPL = 1 NPL = 2 NPL = 3 NPL = 4 NPL = 5 NPL = 6 406080100 120 140 160 0 1 2 3 4 5 6 (b) Time (min) 0 2 4 6 8101214 Relative concentration 0.0 0.2 0.4 0.6 0.8 1.0 NPL = 1 NPL = 2 NPL = 3 NPL = 4 NPL = 5 NPL = 6 406080100 120140 160 0 1 2 3 4 5 6 (c) Figure 4. Simulated BTCs for ΔL = 20 cm: (a) Normal distribution; (b) Lognormal distribution (right-skewed); (c) Log- normal distribution (left-skewed). Copyright © 2012 SciRes. ACES 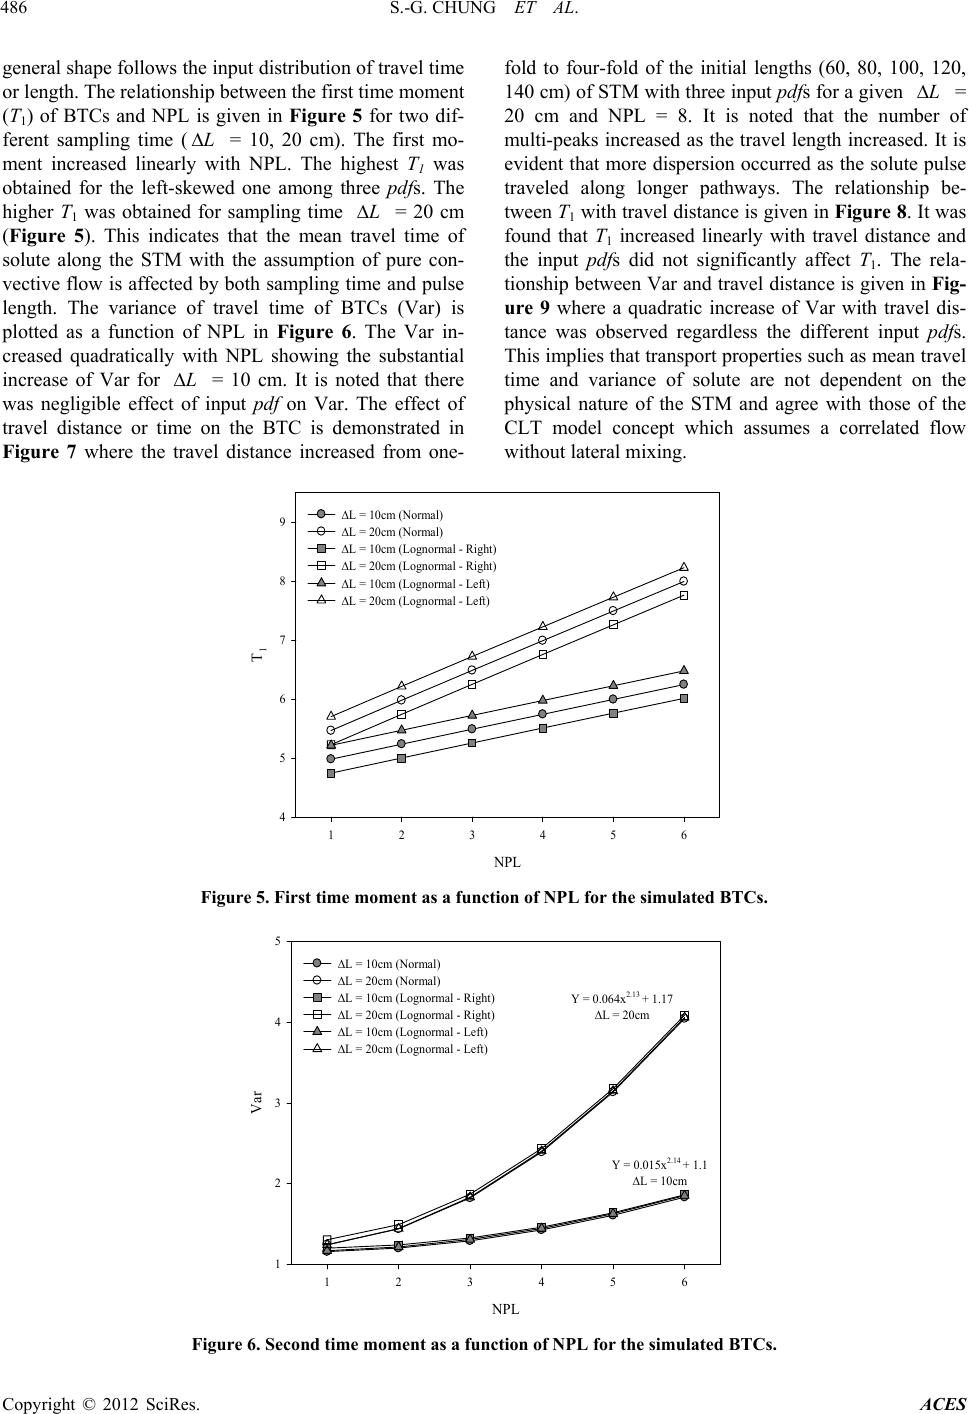 S.-G. CHUNG ET AL. Copyright © 20ACES 486 L L L L general shape follows the input distribution of travel time or length. The relationship between the first time moment (T1) of BTCs and NPL is given in Figure 5 for two dif- ferent sampling time ( = 10, 20 cm). The first mo- ment increased linearly with NPL. The highest T1 was obtained for the left-skewed one among three pdfs. The higher T1 was obtained for sampling time = 20 cm (Figure 5). This indicates that the mean travel time of solute along the STM with the assumption of pure con- vective flow is affected by both sampling time and pulse length. The variance of travel time of BTCs (Var) is plotted as a function of NPL in Figure 6. The Var in- creased quadratically with NPL showing the substantial increase of Var for = 10 cm. It is noted that there was negligible effect of input pdf on Var. The effect of travel distance or time on the BTC is demonstrated in Figure 7 where the travel distance increased from one- fold to four-fold of the initial lengths (60, 80, 100, 120, 140 cm) of STM with three input pdfs for a given = 20 cm and NPL = 8. It is noted that the number of multi-peaks increased as the travel length increased. It is evident that more dispersion occurred as the solute pulse traveled along longer pathways. The relationship be- tween T1 with travel distance is given in Figure 8. It was found that T1 increased linearly with travel distance and the input pdfs did not significantly affect T1. The rela- tionship between Var and travel distance is given in Fig- ure 9 where a quadratic increase of Var with travel dis- tance was observed regardless the different input pdfs. This implies that transport properties such as mean travel time and variance of solute are not dependent on the physical nature of the STM and agree with those of the CLT model concept which assumes a correlated flow without lateral mixing. 12 SciRes. NPL L = 10cm (Normal) 4 5 6 7 8 9L = 20cm (Normal) L = 10cm (Lognormal - Right) L = 20cm (Lognormal - Right) L = 10cm (Lognormal - Left) L = 20cm (Lognormal - Left) T 1 123456 Figure 5. First time moment as a function of NPL for the simulated BTCs. NPL 123456 Var 1 2 3 4 5 L = 10cm (Normal) L = 20cm (Normal) L = 10cm (Lognormal - Right) L = 20cm (Lognormal - Right) L = 10cm (Lognormal - Left) L = 20cm (Lognormal - Left) Y = 0.0 64x 2.13 + 1.17 L = 20cm Y = 0.015x 2.14 + 1.1 L = 10cm Figure 6. Second time moment as a function of NPL for the simulated BTCs. 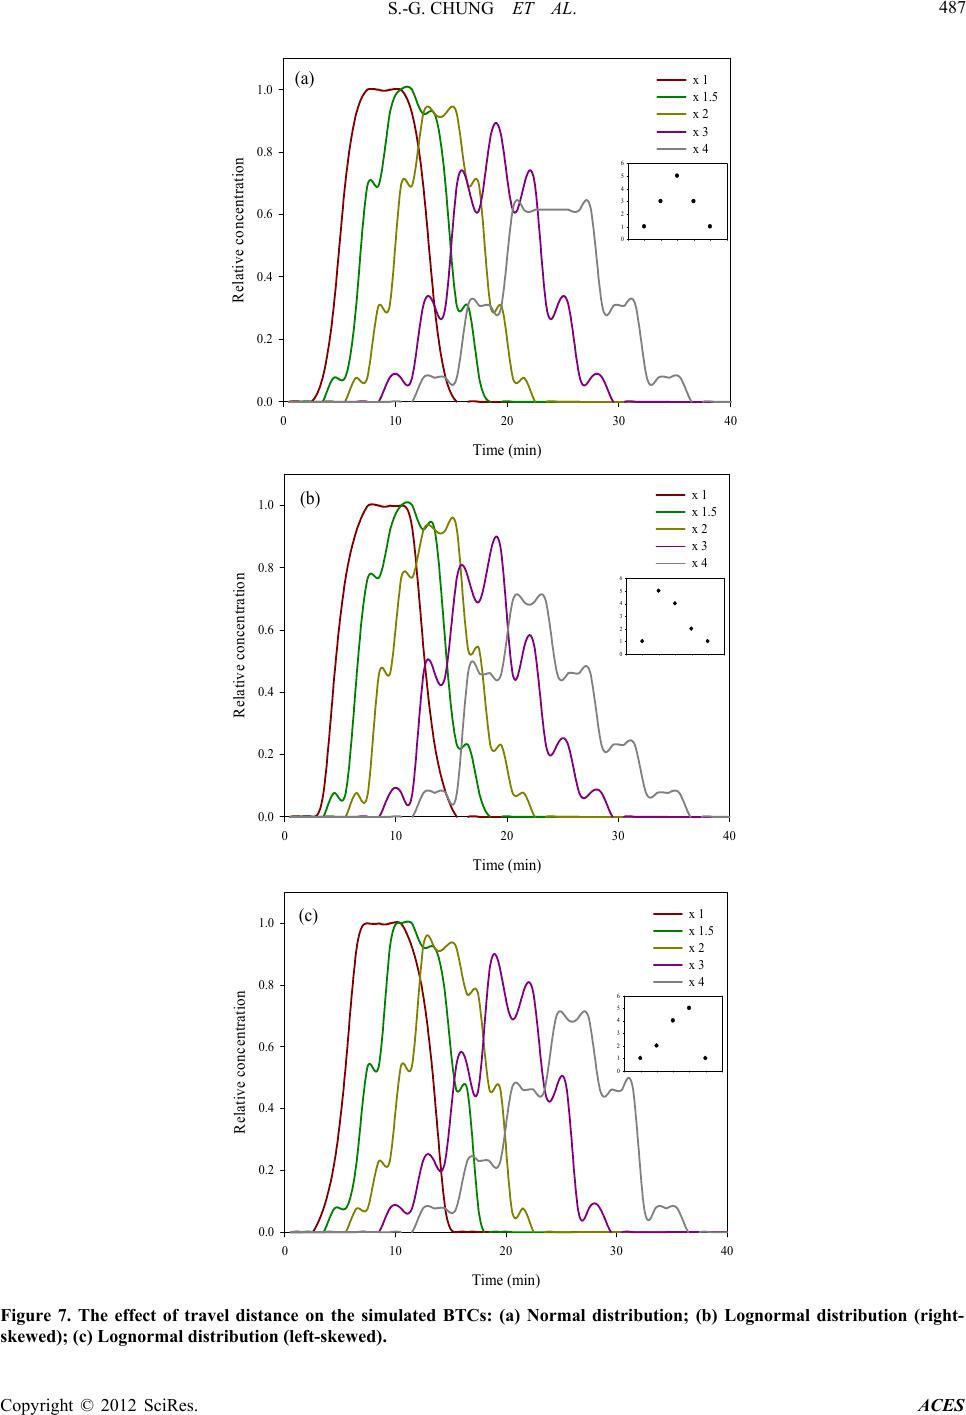 S.-G. CHUNG ET AL. 487 Time (min) 0 10203040 Relative concentration 0.0 0.2 0.4 0.6 0.8 1.0 x 1 x 1.5 x 2 x 3 x 4 0 1 2 3 4 5 6 (a) Time (min) 0 10203040 Relative concentration 0.0 0.2 0.4 0.6 0.8 1.0 x 1 x 1.5 x 2 x 3 x 4 0 1 2 3 4 5 6 (b) Time (min) 0 10203040 Relative concentration 0.0 0.2 0.4 0.6 0.8 1.0 x 1 x 1.5 x 2 x 3 x 4 0 1 2 3 4 5 6 (c) Figure 7. The effect of travel distance on the simulated BTCs: (a) Normal distribution; (b) Lognormal distribution (right- skewed); (c) Lognormal distribution (left-skewed). Copyright © 2012 SciRes. ACES 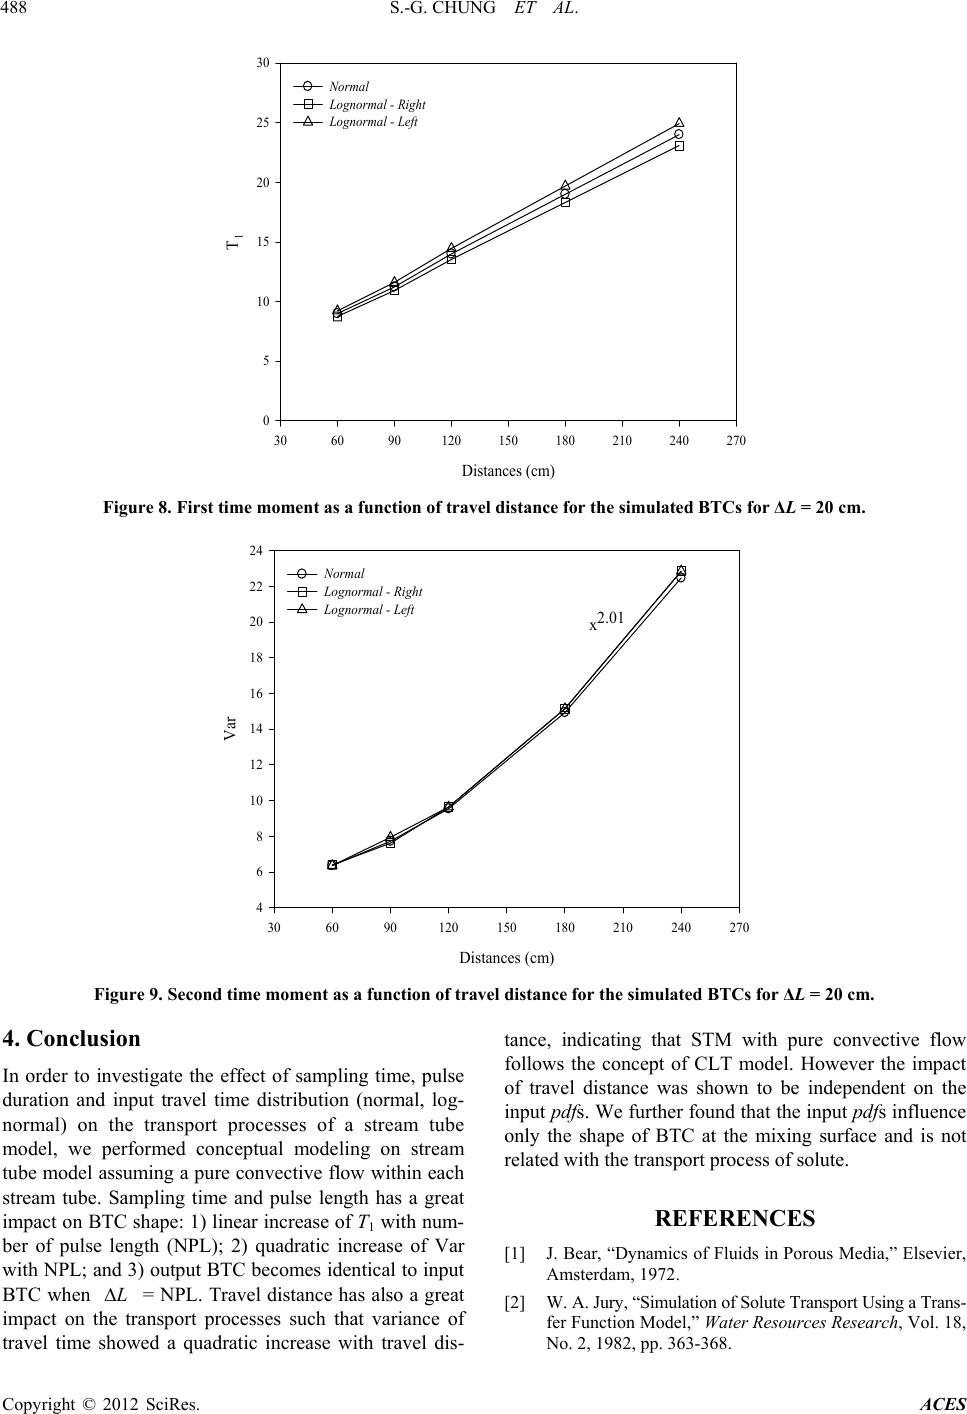 S.-G. CHUNG ET AL. Copyright © 2012 SciRes. ACES 488 Distances (cm) 306090120 150 180 210 240 270 T 1 0 5 10 15 20 25 30 Normal Lognormal - Right Lognormal - Left Figure 8. First time moment as a function of travel distance for the simulated BTCs for ΔL = 20 cm. Distances (cm) 306090120 150 180 210 240 270 Var 4 6 8 10 12 14 16 18 20 22 24 Normal Lognormal - Right Lognormal - Left x2.01 Figure 9. Second time moment as a function of travel distance for the simulated BTCs for ΔL = 20 cm. 4. Conclusion tance, indicating that STM with pure convective flow follows the concept of CLT model. However the impact of travel distance was shown to be independent on the input pdfs. We further found that the input pdfs influence only the shape of BTC at the mixing surface and is not related with the transport process of solute. In order to investigate the effect of sampling time, pulse duration and input travel time distribution (normal, log- normal) on the transport processes of a stream tube model, we performed conceptual modeling on stream tube model assuming a pure convective flow within each stream tube. Sampling time and pulse length has a great impact on BTC shape: 1) linear increase of T1 with num- ber of pulse length (NPL); 2) quadratic increase of Var with NPL; and 3) output BTC becomes identical to input BTC when = NPL. Travel distance has also a great impact on the transport processes such that variance of travel time showed a quadratic increase with travel dis- REFERENCES [1] J. Bear, “Dynamics of Fluids in Porous Media,” Elsevier, Amsterdam, 1972. L[2] W. A. Jury, “Simulation of Solute Transport Using a Trans- fer Function Model,” Water Resources Research, Vol. 18, No. 2, 1982, pp. 363-368.  S.-G. CHUNG ET AL. 489 doi:10.1029/WR018i002p00363 [3] W. E. Bardsley, “Temporal Moments of a Tracer Pulse in a Perfectly Parallel Flow System,” Advances in Water Re- sources, Vol. 26, No. 6, 2003, pp. 599-607. doi:10.1016/S0309-1708(03)00047-2 [4] L. W. Gelhar, A. L. Gutjahr and R. L. Naff, “Stochastic Aquifer Analysis of Macrodispersion in a Stratified Aqui- fer,” Water Resources Research, Vol. 15, No. 6, 1979, pp. 1387-1397. doi:10.1029/WR015i006p01387 [5] O. Güven, F. J. Molz and J. G. Melville, “An Analysis of Dispersion in a Stratified Aquifer,” Water Resources Re- search, Vol. 20, No. 10, 1984, pp. 1337-1354. doi:10.1029/WR020i010p01337 [6] G. Matheron and G. de Marsily, “Is Transport in Porous Media Always Diffusive? A Counter Example,” Water Resources Research, Vol. 16, No. 5, 1980, pp. 901-917. doi:10.1029/WR016i005p00901 [7] J. F. Pickens and G. E. Grisak, “Scale-Dependent Disper- sion in a Stratified Granular Aquifer,” Water Resources Research, Vol. 17, No. 4, 1981, pp. 1191-1211. doi:10.1029/WR017i004p01191 [8] K. W. Thorbjarnarson and D. M. Mackay, “A Field-Test of Tracer Transport and Organic Contaminant Elution in a Stratified Aquifer at the Rocky-Mountain Arsenal (Den- ver, Colorado, USA),” Journal of Contaminant Hydrol- ogy, Vol. 24, No. 3-4, 1997, pp. 287-312. doi:10.1016/S0169-7722(96)00015-0 [9] W. A. Jury and K. Roth, “Transfer Functions and Solute Movement Through Soil,” Birkhauser, Boston, 1990. [10] C. S. Simmons, “A Stochastic-Convective Transport Rep- resentation of Dispersion in One-Dimensional Porous Me- dia Systems,” Water Resources Research, Vol. 18, No. 4, 1982, pp. 1193-1214. doi:10.1029/WR018i004p01193 [11] A. Mercado, “The Spreading Pattern of Injected Water in a Permeability Stratified Aquifer,” In: Artificial Recharge and Management of Aquifers. Symposium of Haifa, March 1967, Organized in the Framework of the IHD, IASH Publication, Gentbrugge, 1967, pp. 23-26. [12] D. Grecov and J. R. Clermont, “Numerical Simulations of Non-Newtonian Flows between Eccentric Cylinders by Domain Decomposition and Stream-Tube Method,” Jour- nal of Non-Newtonian Fluid Mechanics, Vol. 126, No. 2-3, 2005, pp. 175-185. doi:10.1016/j.jnnfm.2004.10.004 [13] G. Demmy, S. Berglund and W. Graham, “Injection Mode Implications for Solute Transport in Porous-Media-Ana- lysis in a Stochastic Lagrangian Framework,” Water Re- sources Research, Vol. 35, No. 7, 1999, pp. 1965-1973. doi:10.1029/1999WR900027 [14] J. M. Köhne, S. Köhne and J. Šimůnek, “A Review of Model Applications for Structured Soils: a) Water Flow and Tracer Transport,” Journal of Contaminant Hydrol- ogy, Vol. 104, No. 1-4, 2009, pp. 4-35. doi:10.1016/j.jconhyd.2008.10.002 Copyright © 2012 SciRes. ACES |