

Paper Menu >>
Journal Menu >>
 Journal of Minerals and Materials Characterization and Engineering, 2012, 11, 947-952 Published Online October 2012 (http://www.SciRP.org/journal/jmmce) Model for Assessment Evaluation of Methane Gas Yield Based on Hydraulic Retention Time during Fruit Wastes Biodigestion Chukwuka Nwoye1*, Asuke Ferdinand2, Ijomah Agatha1, Obiorah Samuelmary1 1Department of Metallurgical and Materials Engineering, Nnamdi Azikiwe University, Awka, Nigeria 2Department of Metallurgical and Materials Engineering, Ahmadu Bello University, Zaria, Nigeria Email: [email protected] Received July 13, 2012; revised August 15, 2012; accepted August 25, 2012 ABSTRACT This paper presents an assessment evaluation of methane gas yield using a derived model based on the hydraulic reten- tion time (HRT) of the feed stock (waste fruits) undergoing biotreatment in the digester. The derived model; γ = e(3.5436 α + 2.0259) indicates an exponential relationship between methane yield and the HRT. Statistical analysis of the model-predicted and experimental gas methane yield for each value of HRT considered shows a standard error of 0.0081 and 0.0114% respectively. Furthermore, the correlation between methane yield and HRT as obtained from de- rived model and experimental results were evaluated as 0.9716 and 0.9709 respectively. Methane gas yield per unit HRT as obtained from derived model and experiment are 0.0196 and 0.0235 (m3·kg−1 VS) days−1 respectively. Devi- ational analysis indicates that the maximum deviation of the model-predicted methane yield from the corresponding experimental value is less than 16%. It was also found that the validity of the model is rooted on the expression 0.2822 ln γ = α + 0.5717 where both sides of the expression are correspondingly approximately equal. Keywords: Model; Methane Gas Yield; Biodigestion; Fruit Wastes 1. Introduction Biowastes such bovine bones and fish scales which could find application in energy generation have also found [1] application in medicine, being developed to produce suit- able materials that act as an interface between the im- plant and tissue in the body. These materials have been proved to be biocompatible for tissue engineering. Solid wastes products such as used tires and lubricant oils which could be processed for heat energy generation have been found [2] to cause serious environmental pro- blems when littered around. Therefore the recycling or burning of these materials for heat generation and trans- mission to industries is most appropriate for environ- mental cleanliness and cheap energy supply. The need to diversify sources of energy for industrial growth has resulted to the use of various raw materials like sugarcane juice and molasses [3,4] sugar beet, beet molasses [4,5], Sweet sorghum [6] and starchy materials like sweet potato [7], Corn cobs and hulls [8,9], cellu- losic materials like cocoa, pineapples and sugarcane waste [10] and milk, cheese, and whey using lactose hy- drolyzing fermenting strains [11] for ethanol production. The possibility and potentialities in fruit wastes mi- crobial treatment, to produce methane gas used as energy source have been studied [12]. A research work in re- spect of this has shown [12] that tomato, mango, pineap- ple, lemon, and orange processing waste, yielded 0.62, 0.56, 0.77, 0.72 and 0.63 m3 of methane gas/kg of VS respectively. Mango peel supplemented with urea was found [13] to adjust the C:N ratio to 20 - 30:1 resulting in the stability of the digester. Addition of nitrogen in the form of silkworm waste and oilseed extracts, such as neem and castor, was found [13] to increase the methane content of the biogas pro- duced. Successive addition of fruit and vegetable solid wastes on the performance of biogas digester shows that the digester was stable at a loading rate of 3.8 kg VS m−3·d−1 [14]. The researchers further observed that no noticeable changes in the rates and yields of biogas oc- curred as a result of minor manipulation in nutritional and operational parameters which practically helped in the functioning of the digester fed with different fruits (mango, pineapple, tomato, jack fruit, banana, and or- ange) and vegetable wastes for a considerably long time. Studies [13] carried out on Pilot plant (of volumetric capacity 1.5 m3 and digester type KVIC) with mango *Corresponding author. Copyright © 2012 SciRes. JMMCE 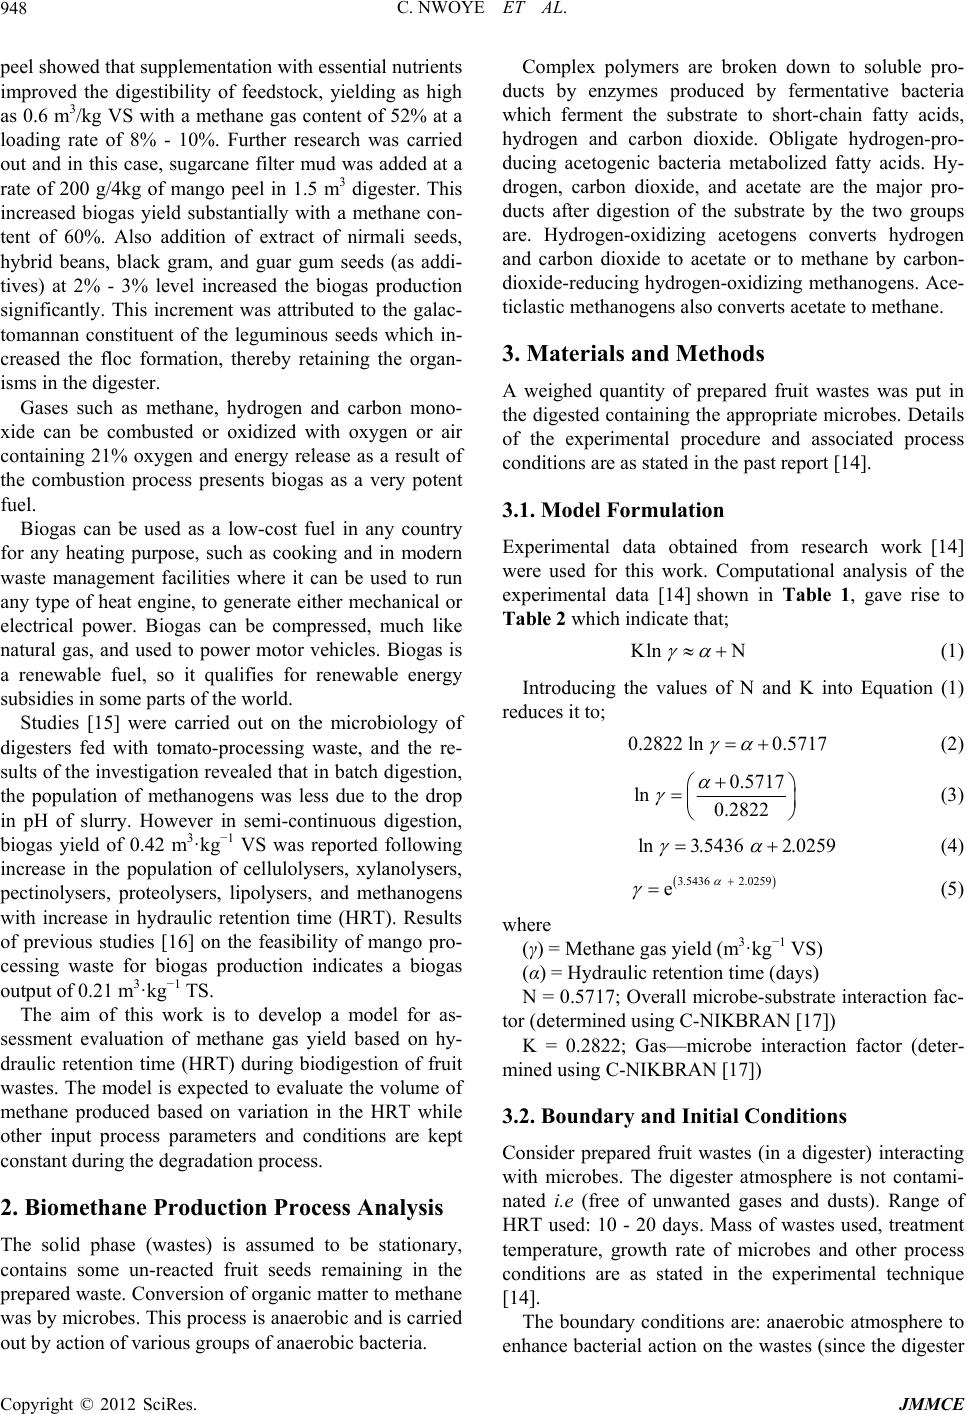 C. NWOYE ET AL. 948 peel showed that supplementation with essential nutrients improved the digestibility of feedstock, yielding as high as 0.6 m3/kg VS with a methane gas content of 52% at a loading rate of 8% - 10%. Further research was carried out and in this case, sugarcane filter mud was added at a rate of 200 g/4kg of mango peel in 1.5 m3 digester. This increased biogas yield substantially with a methane con- tent of 60%. Also addition of extract of nirmali seeds, hybrid beans, black gram, and guar gum seeds (as addi- tives) at 2% - 3% level increased the biogas production significantly. This increment was attributed to the galac- tomannan constituent of the leguminous seeds which in- creased the floc formation, thereby retaining the organ- isms in the digester. Gases such as methane, hydrogen and carbon mono- xide can be combusted or oxidized with oxygen or air containing 21% oxygen and energy release as a result of the combustion process presents biogas as a very potent fuel. Biogas can be used as a low-cost fuel in any country for any heating purpose, such as cooking and in modern waste management facilities where it can be used to run any type of heat engine, to generate either mechanical or electrical power. Biogas can be compressed, much like natural gas, and used to power motor vehicles. Biogas is a renewable fuel, so it qualifies for renewable energy subsidies in some parts of the world. Studies [15] were carried out on the microbiology of digesters fed with tomato-processing waste, and the re- sults of the investigation revealed that in batch digestion, the population of methanogens was less due to the drop in pH of slurry. However in semi-continuous digestion, biogas yield of 0.42 m3·kg−1 VS was reported following increase in the population of cellulolysers, xylanolysers, pectinolysers, proteolysers, lipolysers, and methanogens with increase in hydraulic retention time (HRT). Results of previous studies [16] on the feasibility of mango pro- cessing waste for biogas production indicates a biogas output of 0.21 m3·kg−1 TS. The aim of this work is to develop a model for as- sessment evaluation of methane gas yield based on hy- draulic retention time (HRT) during biodigestion of fruit wastes. The model is expected to evaluate the volume of methane produced based on variation in the HRT while other input process parameters and conditions are kept constant during the degradation process. 2. Biomethane Production Process Analysis The solid phase (wastes) is assumed to be stationary, contains some un-reacted fruit seeds remaining in the prepared waste. Conversion of organic matter to methane was by microbes. This process is anaerobic and is carried out by action of various groups of anaerobic bacteria. Complex polymers are broken down to soluble pro- ducts by enzymes produced by fermentative bacteria which ferment the substrate to short-chain fatty acids, hydrogen and carbon dioxide. Obligate hydrogen-pro- ducing acetogenic bacteria metabolized fatty acids. Hy- drogen, carbon dioxide, and acetate are the major pro- ducts after digestion of the substrate by the two groups are. Hydrogen-oxidizing acetogens converts hydrogen and carbon dioxide to acetate or to methane by carbon- dioxide-reducing hydrogen-oxidizing methanogens. Ace- ticlastic methanogens also converts acetate to methane. 3. Materials and Methods A weighed quantity of prepared fruit wastes was put in the digested containing the appropriate microbes. Details of the experimental procedure and associated process conditions are as stated in the past report [14]. 3.1. Model Formulation Experimental data obtained from research work [14] were used for this work. Computational analysis of the experimental data [14] shown in Table 1, gave rise to Table 2 which indicate that; Kln N (1) Introducing the values of N and K into Equation (1) reduces it to; 0.2822 ln 0.5717 (2) 0.5717 ln 0.2822 (3) ln 3.5436 2.0259 (4) 3.5436 2.0259 e (5) where (γ) = Methane gas yield (m3·kg−1 VS) (α) = Hydraulic retention time (days) N = 0.5717; Overall microbe-substrate interaction fac- tor (determined using C-NIKBRAN [17]) K = 0.2822; Gas—microbe interaction factor (deter- mined using C-NIKBRAN [17]) 3.2. Boundary and Initial Conditions Consider prepared fruit wastes (in a digester) interacting with microbes. The digester atmosphere is not contami- nated i.e (free of unwanted gases and dusts). Range of HRT used: 10 - 20 days. Mass of wastes used, treatment temperature, growth rate of microbes and other process conditions are as stated in the experimental technique [14]. The boundary conditions are: anaerobic atmosphere to enhance bacterial action on the wastes (since the digester Copyright © 2012 SciRes. JMMCE 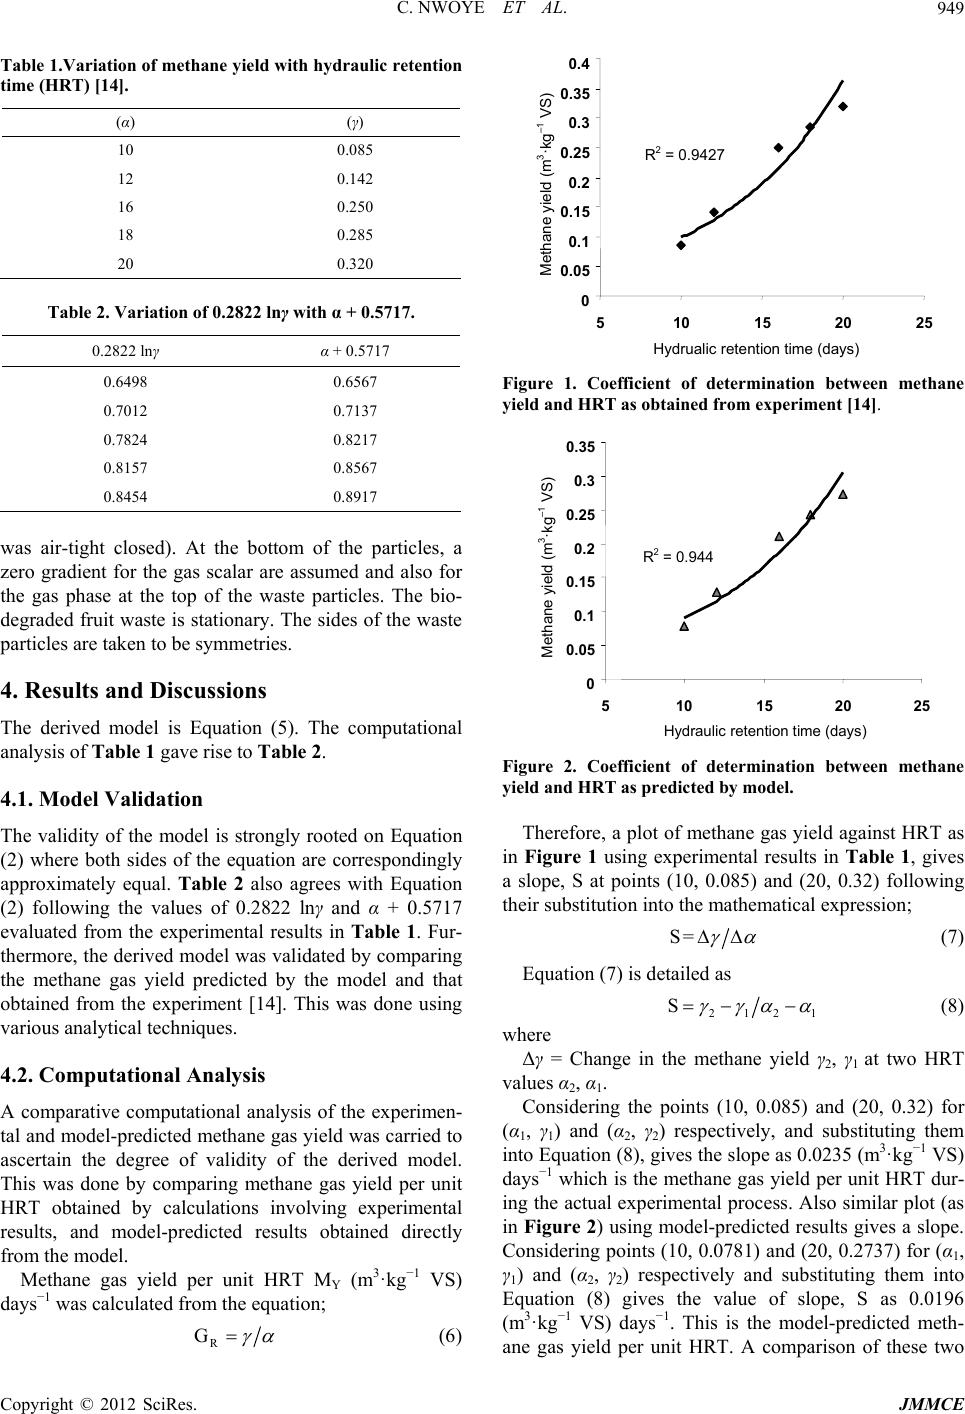 C. NWOYE ET AL. 949 Table 1.Variation of methane yield with hydraulic retention time (HRT) [14]. (α) (γ) 10 0.085 12 0.142 16 0.250 18 0.285 20 0.320 Table 2. Variation of 0.2822 lnγ with α + 0.5717. 0.2822 lnγ α + 0.5717 0.6498 0.6567 0.7012 0.7137 0.7824 0.8217 0.8157 0.8567 0.8454 0.8917 was air-tight closed). At the bottom of the particles, a zero gradient for the gas scalar are assumed and also for the gas phase at the top of the waste particles. The bio- degraded fruit waste is stationary. The sides of the waste particles are taken to be symmetries. 4. Results and Discussions The derived model is Equation (5). The computational analysis of Table 1 gave rise to Table 2. 4.1. Model Validation The validity of the model is strongly rooted on Equation (2) where both sides of the equation are correspondingly approximately equal. Table 2 also agrees with Equation (2) following the values of 0.2822 lnγ and α + 0.5717 evaluated from the experimental results in Table 1. Fur- thermore, the derived model was validated by comparing the methane gas yield predicted by the model and that obtained from the experiment [14]. This was done using various analytical techniques. 4.2. Computational Analysis A comparative computational analysis of the experimen- tal and model-predicted methane gas yield was carried to ascertain the degree of validity of the derived model. This was done by comparing methane gas yield per unit HRT obtained by calculations involving experimental results, and model-predicted results obtained directly from the model. Methane gas yield per unit HRT MY (m3·kg−1 VS) days−1 was calculated from the equation; R G (6) R 2 = 0.9427 0 0.05 0.1 0.15 0.2 0.25 0.3 0.35 0.4 510 15 20 25 Hydrualic retention time (days) Methane yield (m 3 ·kg –1 VS) Figure 1. Coefficient of determination between methane yield and HRT as obtained from experiment [14] . R 2 = 0.944 0 0.05 0.1 0.15 0.2 0.25 0.3 0.35 510 15 20 25 Hydraulic retention time (days) Methane yield (m 3 ·kg –1 VS) Figure 2. Coefficient of determination between methane yield and HRT as predicted by model. Therefore, a plot of methane gas yield against HRT as in Figure 1 using experimental results in Table 1, gives a slope, S at points (10, 0.085) and (20, 0.32) following their substitution into the mathematical expression; S= (7) Equation (7) is detailed as 212 S1 (8) where Δγ = Change in the methane yield γ2, γ1 at two HRT values α2, α1. Considering the points (10, 0.085) and (20, 0.32) for (α1, γ1) and (α2, γ2) respectively, and substituting them into Equation (8), gives the slope as 0.0235 (m3·kg−1 VS) days−1 which is the methane gas yield per unit HRT dur- ing the actual experimental process. Also similar plot (as in Figure 2) using model-predicted results gives a slope. Considering points (10, 0.0781) and (20, 0.2737) for (α1, γ1) and (α2, γ2) respectively and substituting them into Equation (8) gives the value of slope, S as 0.0196 (m3·kg−1 VS) days−1. This is the model-predicted meth- ane gas yield per unit HRT. A comparison of these two Copyright © 2012 SciRes. JMMCE 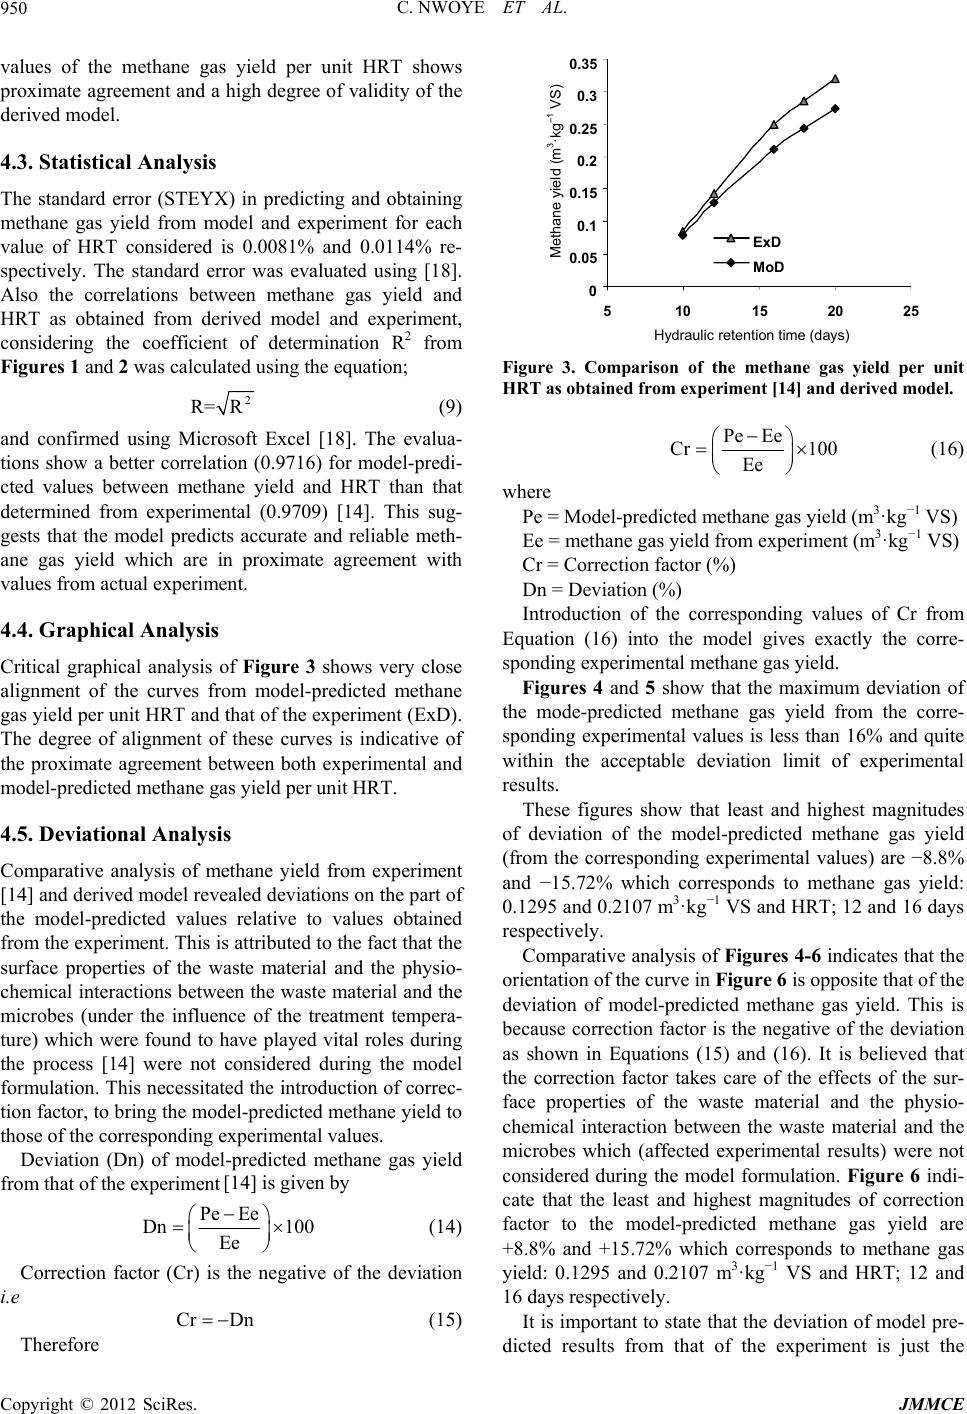 C. NWOYE ET AL. 950 values of the methane gas yield per unit HRT shows proximate agreement and a high degree of validity of the derived model. 4.3. Statistical Analysis The standard error (STEYX) in predicting and obtaining methane gas yield from model and experiment for each value of HRT considered is 0.0081% and 0.0114% re- spectively. The standard error was evaluated using [18]. Also the correlations between methane gas yield and HRT as obtained from derived model and experiment, considering the coefficient of determination R2 from Figures 1 and 2 was calculated using the equation; 2 R= R (9) and confirmed using Microsoft Excel [18]. The evalua- tions show a better correlation (0.9716) for model-predi- cted values between methane yield and HRT than that determined from experimental (0.9709) [14]. This sug- gests that the model predicts accurate and reliable meth- ane gas yield which are in proximate agreement with values from actual experiment. 4.4. Graphical Analysis Critical graphical analysis of Figure 3 shows very close alignment of the curves from model-predicted methane gas yield per unit HRT and that of the experiment (ExD). The degree of alignment of these curves is indicative of the proximate agreement between both experimental and model-predicted methane gas yield per unit HRT. 4.5. Deviational Analysis Comparative analysis of methane yield from experiment [14] and derived model revealed deviations on the part of the model-predicted values relative to values obtained from the experiment. This is attributed to the fact that the surface properties of the waste material and the physio- chemical interactions between the waste material and the microbes (under the influence of the treatment tempera- ture) which were found to have played vital roles during the process [14] were not considered during the model formulation. This necessitated the introduction of correc- tion factor, to bring the model-predicted methane yield to those of the corresponding experimental values. Deviation (Dn) of model-predicted methane gas yield from that of the experiment [14] is given by Pe Ee Dn 100 Ee (14) Correction factor (Cr) is the negative of the deviation i.e Cr Dn (15) Therefore 0 0.05 0.1 0.15 0.2 0.25 0.3 0.35 510 15 20 25 Hydraulic retention time (days) Methane yield (m 3 ·kg –1 VS) ExD MoD Figure 3. Comparison of the methane gas yield per unit HRT as obtained from experiment [14] and derived model. Pe Ee Cr 100 Ee (16) where Pe = Model-predicted methane gas yield (m3·kg−1 VS) Ee = methane gas yield from experiment (m3·kg−1 VS) Cr = Correction factor (%) Dn = Deviation (%) Introduction of the corresponding values of Cr from Equation (16) into the model gives exactly the corre- sponding experimental methane gas yield. Figures 4 and 5 show that the maximum deviation of the mode-predicted methane gas yield from the corre- sponding experimental values is less than 16% and quite within the acceptable deviation limit of experimental results. These figures show that least and highest magnitudes of deviation of the model-predicted methane gas yield (from the corresponding experimental values) are −8.8% and −15.72% which corresponds to methane gas yield: 0.1295 and 0.2107 m3·kg−1 VS and HRT; 12 and 16 days respectively. Comparative analysis of Figures 4-6 indicates that the orientation of the curve in Figure 6 is opposite that of the deviation of model-predicted methane gas yield. This is because correction factor is the negative of the deviation as shown in Equations (15) and (16). It is believed that the correction factor takes care of the effects of the sur- face properties of the waste material and the physio- chemical interaction between the waste material and the microbes which (affected experimental results) were not considered during the model formulation. Figure 6 indi- cate that the least and highest magnitudes of correction factor to the model-predicted methane gas yield are +8.8% and +15.72% which corresponds to methane gas yield: 0.1295 and 0.2107 m3·kg−1 VS and HRT; 12 and 16 days respectively. It is important to state that the deviation of model pre- dicted results from that of the experiment is just the Copyright © 2012 SciRes. JMMCE  C. NWOYE ET AL. 951 -17 -15 -13 -11 -9 -7 -5 00.1 0.20.3 Deviation (%) Methane yield (m3·kg−1 VS) Figure 4. Variation of model-predicted methane yield with its associated deviation from experimental values. -17 -15 -13 -11 -9 -7 -5 5101520 Hydraulic retention time (days) Deviation (%) 25 Figure 5. Variation of deviation (of model-predicted me- thane yield) with HRT. 5 7 9 11 13 15 17 00.10.2 0.3 Correction factor (%) Methane yield (m3·kg−1 VS) Figure 6. Variation of model-predicted methane yield with its associated correction factor. magnitude of the value. The associated sign preceding the value signifies if the deviation is deficit (negative sign) or surplus (positive sign). 5. Conclusion The derived model gave an assessment evaluation of methane gas yield based on the HRT of the waste fruits undergoing biotreatment in a digester while other input process parameters and conditions are kept constant. Sta- tistical analysis of the model-predicted and experimental methane gas yield for each value of (HRT) considered shows a standard error of 0.0081% and 0.0114% respec- tively. Furthermore, the correlation between methane yield and HRT as obtained from derived model and ex- perimental results were evaluated as 0.9716 and 0.9709 respectively. Methane yield per unit HRT as obtained from derived model and experiment are 0.0196 and 0.0235 (m3·kg−1 VS) days−1 respectively. Deviational analysis indicates that the maximum deviation of the model-predicted methane yield from the corresponding experimental value is less than 16%. It was also found that the validity of the model is rooted on the expression 0.2822 lnγ = α + 0.5717 where both sides of the expres- sion are correspondingly approximately equal. REFERENCES [1] M. Sudip, M. Biswanath, D. Apurba and S. M. Sudit, “Studies on Processing and Characterization of Hydroxya Patite Biomaterials fron Different Biowastes,” Journal of Minerals & Materials Characterization & Engineering, Vol. 11, No. 1, 2012, pp. 52-67. [2] H. Esher and K. Chen-Ming, “Household Solid Wastes Recycling Induced Production Values and Employment Opportunities in Taiwan,” Journal of Minerals & Materi als Characterization & Engineering, Vol. 1, No. 2, 2002, pp. 121-129. [3] S. Morimura, Z. Y. Ling and K. Kida, “Ethanol Produc- tion by Repeated Batch Fermentation at High Tempera- ture in a Molasses Medium Containing a High Concentra- tion of Total Sugar by Thermotolerant Flocculating Yeast with Improved Salt Tolerance,” Journal of Fermentation and Bioengineering, Vol. 83, No. 3, 1997, pp. 271-274. doi:10.1016/S0922-338X(97)80991-9 [4] P. K. Agrawal, S. Kumar and S. Kumar, “Studies on Al- cohol Production from Sugarcane Juice, Sugarcane Mo- lasses, Sugarbeet Juice and Sugarbeet Molasses, Sac- charomyces Cerevisiae,” Proceedings of the 60th Annual Convention of the Sugar Technologists Association of In- dia, Shimla, 19-21 September 1998, pp. 34-45. [5] A. I. El-Diwany, M. S. El-Abyad, R. A. H. EL, L. A. Sallam and R. P. Allam, “Effect of Some Fermentation Parameters on Ethanol Production from Beet Molasses by Saccahromyces Cerevisiae Y-7,” Bioresearch Technology, Vol. 42, No. 3, 1992, pp. 191-198. doi:10.1016/0960-8524(92)90022-P [6] B. Bulawayo, J. M. Brochora, M. I. Munzondo and R. Zvauya, “Ethanol Production by Fermentation of Sweet Sorghum Juice Using Various Yeast Strains,” World Journal of Microbiology and Biotechnology, Vol. 12, No. 4, 1996, pp. 357-360. doi:10.1007/BF00340211 [7] N. K. Sree, M. Sridhar, K. Suresh, I. M. Bharat and L. V. Rao, “High Alcohol Production by Repeated Batch Fer- mentation Using Immobilized Osmotolerant Saccharomy- ces Cerevisiae,” Journal of Industrial Microbiology and Biotechnology, Vol. 24, No. 3, 2000, pp. 222-226. Copyright © 2012 SciRes. JMMCE  C. NWOYE ET AL. Copyright © 2012 SciRes. JMMCE 952 doi:10.1038/sj.jim.2900807 [8] D. S. L. O. Beall, A. B. Bassat, J. B. Doran, D. E. Fowler, R. G. Hall and B. E. Wood, “Conversion of Hydrolysate of Corn Cobs and Hulls into Ethanol by Recombinant E.coli B Containing Integrated Genes for Ethanol Produc- tion,” Biotechnology Letters, Vol. 14, No. 9, 1992, pp. 857. doi:10.1007/BF01029153 [9] S. Arni, M. Molinari, M. D. Borghi and A. Converti, “Improvement of Alcohol Fermentation of a Corn Starch Hydrolysate by Viscosity Raising Additives,” Starch Stärke, Vol. 51, No. 6, 1999, pp. 218-24. doi:10.1002/(SICI)1521-379X(199906)51:6<218::AID-S TAR218>3.0.CO;2-7 [10] A. S. Othman, M. N. Othaman, A. R. Abdulrahim and S. A. Bapar, “Cocoa, Pineapples, Sugarcane Waste for Etha- nol Production,” Planter, Vol. 68, No. 792, 1992, pp. 125-132. [11] C. Silva, G. R. J. H. Castro, C. Abercio-da-Silva and R. J. H. C. Gomez, “Study of the Fermentation Process Using Milk Whey and the Yeast Kluyveromyces Fragilis,” Semina Londrina, Vol. 16, 1995, pp. 17-21. [12] Anonymous, “Final Report Submitted to Department of Non-Conventional Energy Sources,” Government of In- dia, New Delhi, 1989. [13] B. Nagamani and K. Ramasamy, ‘‘Biogas Production Technology: An Indian Perspective,’’ Fermentation Laboratory, Coimbatore, Vol. 13, 1994, pp. 33-35. [14] P. Viswanath, S. Devi and K. Krishnanand, “Anaerobic Digestion of Fruit and Vegetable Processing Wastes for Biogas Production,” Bioresearch Technology, Vol. 40, No. 1, 1992, pp. 43-48. doi:10.1016/0960-8524(92)90117-G [15] R. Sarada and R. Joseph, “Characterization and Enumera- tion of Microorganisms Associated with Anaerobic Di- gestion of Tomato-Processing Waste,” Bioresearch Tech- nology, Vol. 49, No. 3, 1994, pp. 261-265. doi:10.1016/0960-8524(94)90050-7 [16] M. Mahadevaswamy and L. V. Venkataraman, “Integrated Utilization of Fruit-Processing Wastes for Biogas and Fish Production,” Biology Wastes, Vol. 32, No. 4, 1990, pp. 243-251. doi:10.1016/0269-7483(90)90056-X [17] C. I. Nwoye, “Data Analytical Memory,” C-NIKBRAN, 2008. [18] Microsoft Excel 2003 Version. |