

Paper Menu >>
Journal Menu >>
 Journal of Minerals and Materials Characterization and Engineering, 2012, 11, 931-937 Published Online October 2012 (http://www.SciRP.org/journal/jmmce) Optimization of ECM Process Parameters Using NSGA-II Chinnamuthu Senthilkumar1*, Gowrishankar Ganesan1, Ramanujam Karthikeyan2 1Department of Manufacturing Engineering, Annamalai University, Annamalai Nagar, Tamilnadu, India 2Department of Mechanical Engineering, Birla Institute of Technology and Science, Pilani, Dubai Email: *[email protected] Received July 1, 2012; revised August 5, 2012; accepted August 15, 2012 ABSTRACT Electrochemical machining (ECM) could be used as one of the best non-traditional machining technique for machining electrically conducting, tough and difficult to machine material with appropriate machining parameters combination. This paper attempts to establish a comprehensive mathematical model for correlating the interactive and higher-order influences of various machining parameters on the predominant machining criteria, i.e. metal removal rate and surface roughness through response surface methodology (RSM). The adequacy of the developed mathematical models has also been tested by the analysis of variance (ANOVA) test. The process parameters are optimized through Nondominated Sorting Genetic Algorithm-II (NSGA-II) approach to maximize metal removal rate and minimize surface roughness. A non-dominated solution set has been obtained and reported. Keywords: Electro Chemical Machining; Metal Removal Rate; Response Surface Methodology; Surface Roughness; NSGA-II 1. Introduction Electrochemical machining (ECM) is one of the non- traditional machining techniques; it can achieve a wanted shape of a surface using metal dissolution by electro- chemical reaction and can be applied to metals such as high-strength, heat-resistant and hardened steel. ECM has been used in industry for cutting, deburring, drilling and shaping [1]. In ECM electrical current passes be- tween the cathode tool and the anode workpiece through an electrolyte solution. The workpiece is eroded in a way that can be described by Faraday’s law of electrolysis. ECM is suitable for the machining of components of complex shape and high strength alloys, as typically found in the semiconductors industries [2]. Metal Matrix Composites (MMC’s) are relatively new class of materi- als characterized by lighter weight and greater wear re- sistance than those of conventional materials. These ma- terials have been considered for use in automobile brake rotors and various components in internal combustion engines. The machining of MMCs is very difficult due to the highly abrasive nature of the reinforcement [3]. Tra- ditional edged cutting tool machining processes are un- economical for such materials as the attainable degree of accuracy and surface finish are quite poor. Machining of complex shapes in such materials by traditional processes is still more difficult. To meet these demands, ECM pro- cesses has now emerged [4]. The present paper, therefore, emphasizes features of the development of comprehend- sive mathematical models for correlating the interactive and higher-order influences of the various machining parameters on the most dominant machining criteria, i.e. the metal removal rate and surface roughness phenomena, for achieving controlled ECM. The investigation into controlled ECM has been carried out through response surface methodology (RSM), utilizing the relevant ex- perimental data as obtained through experimentation. The adequacy of thedeveloped mathematical models has also been tested by the analysis of variance test. The process parameters were optimized using Non-Domi- nated Sorting Genetic Algorithm-II (NSGA-II) to maxi- mize MRR and minimize Ra. 2. Experimental Planning Experiments were conducted on METATECH ECM equipment. The dimensions of the specimens were 30 mm in diameter and 6 mm in height. The tool was made up of copper with a square cross section. Electrolyte was axially fed to the cutting zone through a central hole of the tool. The electrolyte used for experiment was fresh NaCl solution, because of the fact that NaCl electrolyte has no passivation effect on the surface of the job. The test specimens of LM25 Al/10%SiCp composites were produced through stir casting. The machining has been carried out for fixed time interval. The observations were made by varying predominant process parameters such as *Corresponding author. Copyright © 2012 SciRes. JMMCE 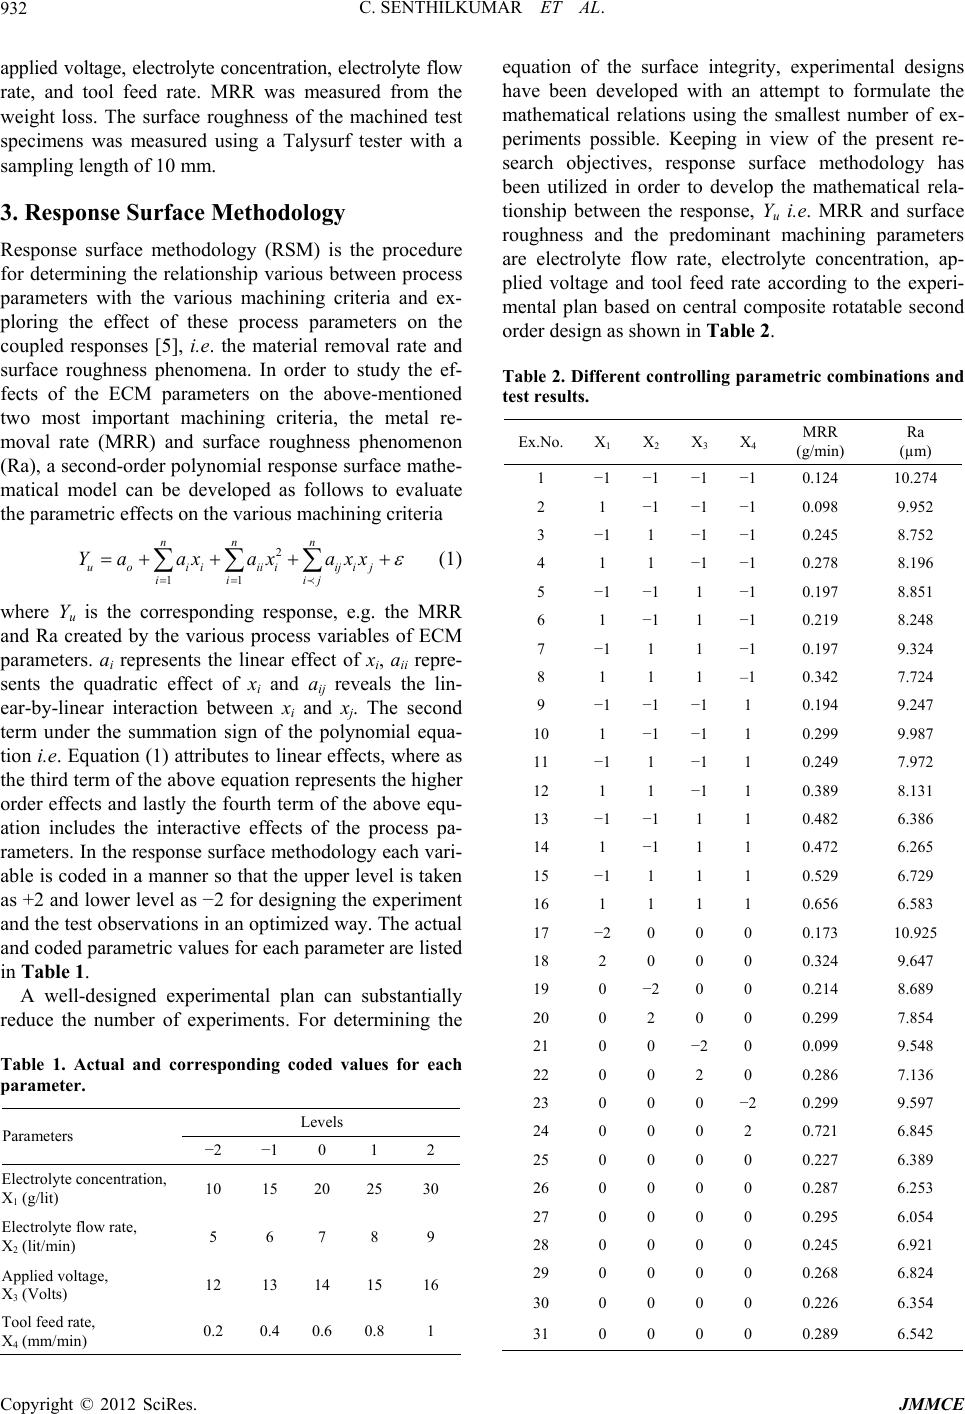 C. SENTHILKUMAR ET AL. 932 applied voltage, electrolyte concentration, electrolyte flow rate, and tool feed rate. MRR was measured from the weight loss. The surface roughness of the machined test specimens was measured using a Talysurf tester with a sampling length of 10 mm. 3. Response Surface Methodology Response surface methodology (RSM) is the procedure for determining the relationship various between process parameters with the various machining criteria and ex- ploring the effect of these process parameters on the coupled responses [5], i.e. the material removal rate and surface roughness phenomena. In order to study the ef- fects of the ECM parameters on the above-mentioned two most important machining criteria, the metal re- moval rate (MRR) and surface roughness phenomenon (Ra), a second-order polynomial response surface mathe- matical model can be developed as follows to evaluate the parametric effects on the various machining criteria 2 11 nn n uo ii iiiijij ii ij Yaax axaxx (1) where Yu is the corresponding response, e.g. the MRR and Ra created by the various process variables of ECM parameters. ai represents the linear effect of xi, aii repre- sents the quadratic effect of xi and aij reveals the lin- ear-by-linear interaction between xi and xj. The second term under the summation sign of the polynomial equa- tion i.e. Equation (1) attributes to linear effects, where as the third term of the above equation represents the higher order effects and lastly the fourth term of the above equ- ation includes the interactive effects of the process pa- rameters. In the response surface methodology each vari- able is coded in a manner so that the upper level is taken as +2 and lower level as −2 for designing the experiment and the test observations in an optimized way. The actual and coded parametric values for each parameter are listed in Table 1. A well-designed experimental plan can substantially reduce the number of experiments. For determining the Table 1. Actual and corresponding coded values for each parameter. Levels Parameters −2 −1 0 1 2 Electrolyte concentration, X1 (g/lit) 10 15 20 25 30 Electrolyte flow rate, X2 (lit/min) 5 6 7 8 9 Applied voltage, X3 (Volts) 12 13 14 15 16 Tool feed rate, X4 (mm/min) 0.2 0.4 0.6 0.8 1 equation of the surface integrity, experimental designs have been developed with an attempt to formulate the mathematical relations using the smallest number of ex- periments possible. Keeping in view of the present re- search objectives, response surface methodology has been utilized in order to develop the mathematical rela- tionship between the response, Yu i.e. MRR and surface roughness and the predominant machining parameters are electrolyte flow rate, electrolyte concentration, ap- plied voltage and tool feed rate according to the experi- mental plan based on central composite rotatable second order design as shown in Table 2. Table 2. Different controlling parametric combinations and test results. Ex.No. X1 X 2 X 3 X 4 MRR (g/min) Ra (µm) 1 −1−1 −1−1 0.124 10.274 2 1 −1 −1−1 0.098 9.952 3 −11 −1−1 0.245 8.752 4 1 1 −1−1 0.278 8.196 5 −1−1 1 −1 0.197 8.851 6 1 −1 1 −1 0.219 8.248 7 −11 1 −1 0.197 9.324 8 1 1 1 –1 0.342 7.724 9 −1−1 −11 0.194 9.247 10 1 −1 −11 0.299 9.987 11 −11 −11 0.249 7.972 12 1 1 −11 0.389 8.131 13 −1−1 1 1 0.482 6.386 14 1 −1 1 1 0.472 6.265 15 −11 1 1 0.529 6.729 16 1 1 1 1 0.656 6.583 17 −20 0 0 0.173 10.925 18 2 0 0 0 0.324 9.647 19 0 −2 0 0 0.214 8.689 20 0 2 0 0 0.299 7.854 21 0 0 −20 0.099 9.548 22 0 0 2 0 0.286 7.136 23 0 0 0 −2 0.299 9.597 24 0 0 0 2 0.721 6.845 25 0 0 0 0 0.227 6.389 26 0 0 0 0 0.287 6.253 27 0 0 0 0 0.295 6.054 28 0 0 0 0 0.245 6.921 29 0 0 0 0 0.268 6.824 30 0 0 0 0 0.226 6.354 31 0 0 0 0 0.289 6.542 Copyright © 2012 SciRes. JMMCE 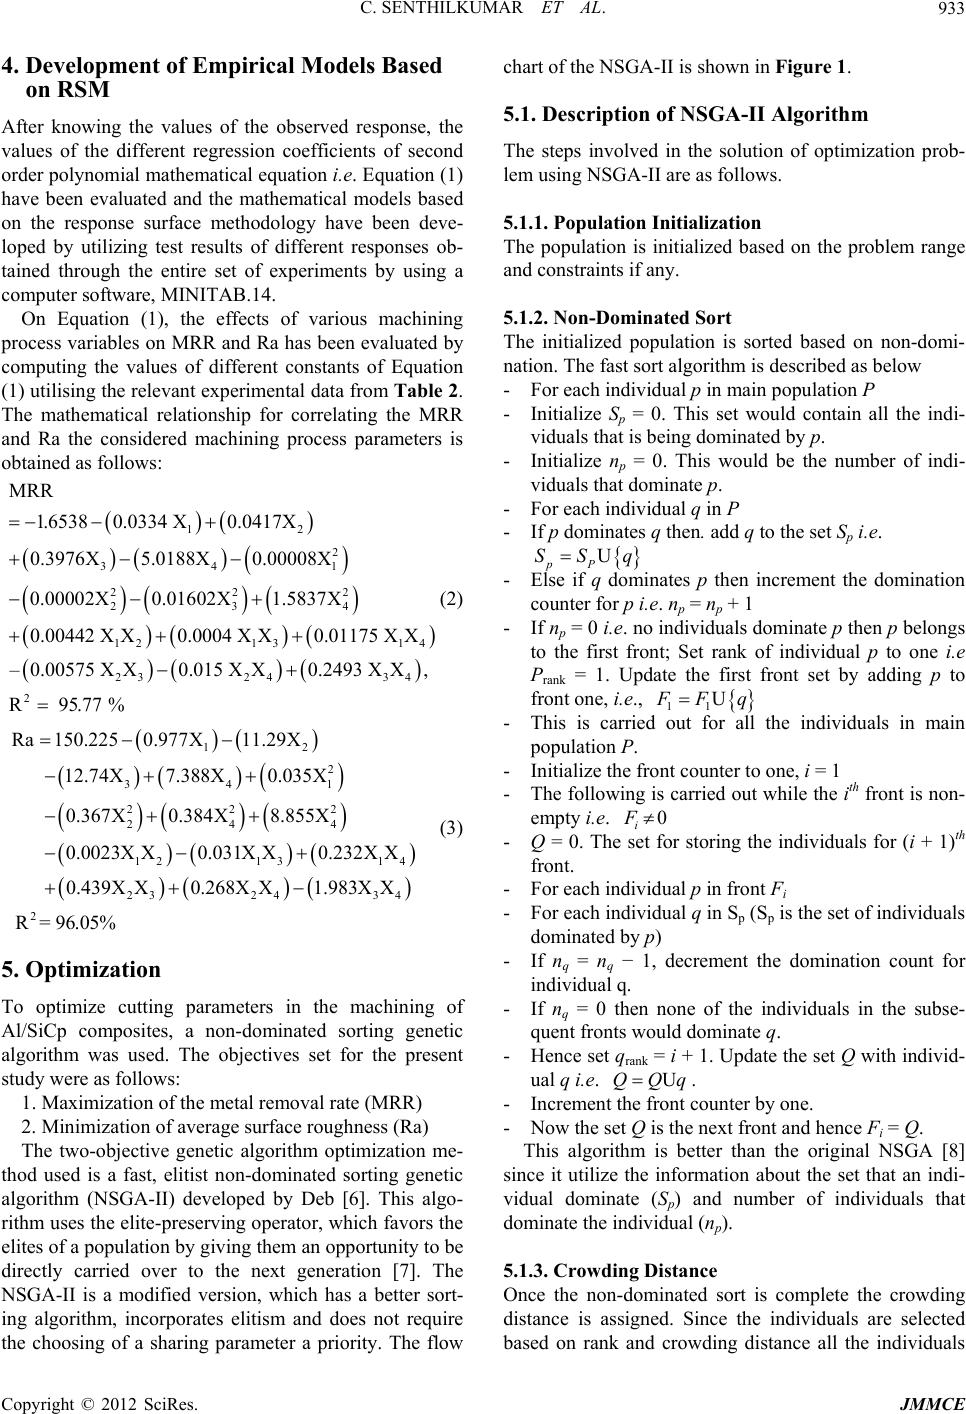 C. SENTHILKUMAR ET AL. 933 4. Development of Empirical Models Based on RSM After knowing the values of the observed response, the values of the different regression coefficients of second order polynomial mathematical equation i.e. Equation (1) have been evaluated and the mathematical models based on the response surface methodology have been deve- loped by utilizing test results of different responses ob- tained through the entire set of experiments by using a computer software, MINITAB.14. On Equation (1), the effects of various machining process variables on MRR and Ra has been evaluated by computing the values of different constants of Equation (1) utilising the relevant experimental data from Table 2. The mathematical relationship for correlating the MRR and Ra the considered machining process parameters is obtained as follows: 12 2 34 1 222 234 12 1314 23 2434 2 MRR 1.65380.0334 X0.0417X 0.3976X 5.0188X0.00008X 0.00002X0.01602X 1.5837X 0.00442 XX0.0004 XX0.01175 XX –0.00575 XX0.015 XX0.2493 XX, R 95.77 % (2) 12 2 341 222 244 12 1314 2324 34 2 Ra 150.2250.977X11.29X 12.74X 7.388X0.035X 0.367X0.384X 8.855X 0.0023X X0.031XX0.232X X 0.439X X0.268X X1.983XX R= 96.05% (3) 5. Optimization To optimize cutting parameters in the machining of Al/SiCp composites, a non-dominated sorting genetic algorithm was used. The objectives set for the present study were as follows: 1. Maximization of the metal removal rate (MRR) 2. Minimization of average surface roughness (Ra) The two-objective genetic algorithm optimization me- thod used is a fast, elitist non-dominated sorting genetic algorithm (NSGA-II) developed by Deb [6]. This algo- rithm uses the elite-preserving operator, which favors the elites of a population by giving them an opportunity to be directly carried over to the next generation [7]. The NSGA-II is a modified version, which has a better sort- ing algorithm, incorporates elitism and does not require the choosing of a sharing parameter a priority. The flow chart of the NSGA-II is shown in Figure 1. 5.1. Description of NSGA-II Algorithm The steps involved in the solution of optimization prob- lem using NSGA-II are as follows. 5.1.1. Population Initialization The population is initialized based on the problem range and constraints if any. 5.1.2. Non-Dominated Sort The initialized population is sorted based on non-domi- nation. The fast sort algorithm is described as below - For each individual p in main population P - Initialize Sp = 0. This set would contain all the indi- viduals that is being dominated by p. - Initialize np = 0. This would be the number of indi- viduals that dominate p. - For each individual q in P - If p dominates q then. add q to the set Sp i.e. U pP SS q - Else if q dominates p then increment the domination counter for p i.e. np = np + 1 - If np = 0 i.e. no individuals dominate p then p belongs to the first front; Set rank of individual p to one i.e Prank = 1. Update the first front set by adding p to front one, i.e., 11 U F Fq - This is carried out for all the individuals in main population P. - Initialize the front counter to one, i = 1 - The following is carried out while the ith front is non- empty i.e. 0 i F - Q = 0. The set for storing the individuals for (i + 1)th front. - For each individual p in front Fi - For each individual q in Sp (Sp is the set of individuals dominated by p) - If nq = nq − 1, decrement the domination count for individual q. - If nq = 0 then none of the individuals in the subse- quent fronts would dominate q. - Hence set qrank = i + 1. Update the set Q with individ- ual q i.e. UQQq . - Increment the front counter by one. - Now the set Q is the next front and hence Fi = Q. This algorithm is better than the original NSGA [8] since it utilize the information about the set that an indi- vidual dominate (Sp) and number of individuals that dominate the individual (np). 5.1.3. Crowding D i s tance Once the non-dominated sort is complete the crowding distance is assigned. Since the individuals are selected based on rank and crowding distance all the individuals Copyright © 2012 SciRes. JMMCE 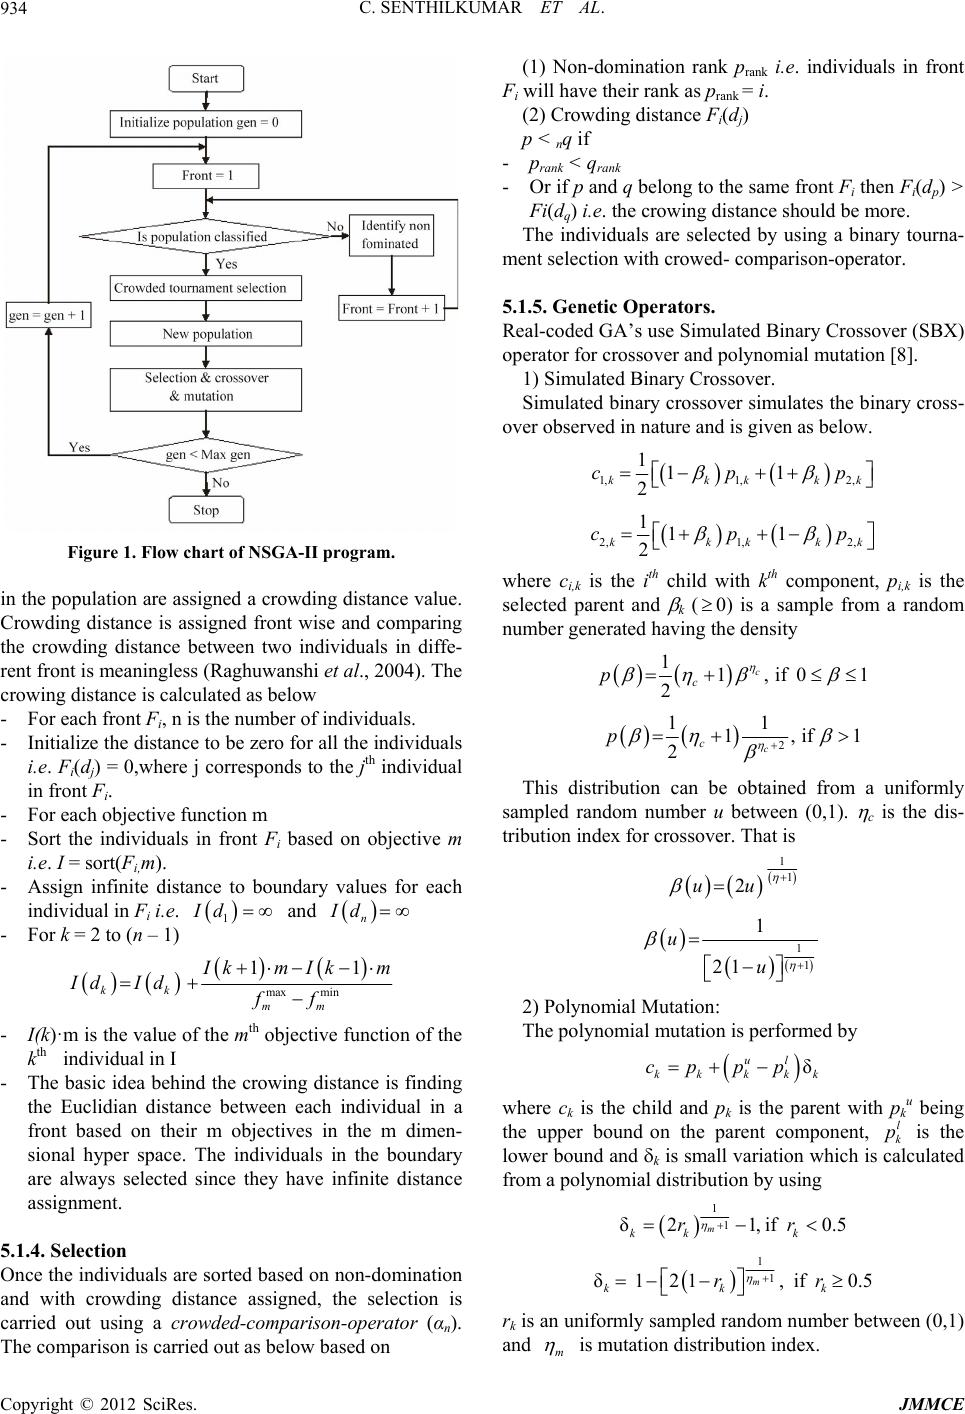 C. SENTHILKUMAR ET AL. 934 Figure 1. Flow chart of NSGA-II program. in the population are assigned a crowding distance value. Crowding distance is assigned front wise and comparing the crowding distance between two individuals in diffe- rent front is meaningless (Raghuwanshi et al., 2004). The crowing distance is calculated as below - For each front Fi, n is the number of individuals. - Initialize the distance to be zero for all the individuals i.e. Fi(dj) = 0,where j corresponds to the jth individual in front Fi. - For each objective function m - Sort the individuals in front Fi based on objective m i.e. I = sort(Fi,m). - Assign infinite distance to boundary values for each individual in Fi i.e. 1 Id and n Id - For k = 2 to (n – 1) max min 11 kk mm I kmIk Id Idff m - I(k)·m is the value of the mth objective function of the kth individual in I - The basic idea behind the crowing distance is finding the Euclidian distance between each individual in a front based on their m objectives in the m dimen- sional hyper space. The individuals in the boundary are always selected since they have infinite distance assignment. 5.1.4. Selection Once the individuals are sorted based on non-domination and with crowding distance assigned, the selection is carried out using a crowded-comparison-operator (αn). (1) Non-domination rank prank i.e. individuals The comparison is carried out as below based on in front Fi - rank belong to the same front Fi then Fi(dp) > urna- m 5.1.5. Genetic Operators. ed Binary Crossover (SBX) lates the binary cross- ov will have their rank as prank = i. (2) Crowding distance Fi(dj) p < nq if prank < q - Or if p and q Fi(dq) i.e. the crowing distance should be more. The individuals are selected by using a binary to ent selection with crowed- comparison-operator. Real-coded GA’s use Simulat operator for crossover and polynomial mutation [8]. 1) Simulated Binary Crossover. Simulated binary crossover simu er observed in nature and is given as below. 1,1, 2, 111 2 kkkkk cpp 2,1, 2, 111 2 kkkk cp k p th th where ci,k is the i child with k component, pi,k is the t selected parent and k (0) is a sample from a random number generated havinghe density 1 1, if0 1 2 c c p 2 11 1,if 2c c p 1 This distribution can be obtained from a uniformly sampled random number u between (0,1). c is the dis- tribution index for crossover. That is 1 1 2uu 1 1 1 21 u u 2) Polynomial Mutation: is performed by The polynomial mutation δ ul cp pp kk kkk where ck is the child and pk is the parent with pu being k the upper bound on the parent component, l k p is the lower bound and k is small variation which is calculated from a polynomial distribution by using 1 1 δ21,if0.5 m kk k rr 1 1 δ121,if 0.5 m kkk rr rk is an uniformly sampled random number beteen (0,1) w and m is mutation distribution index. Copyright © 2012 SciRes. JMMCE 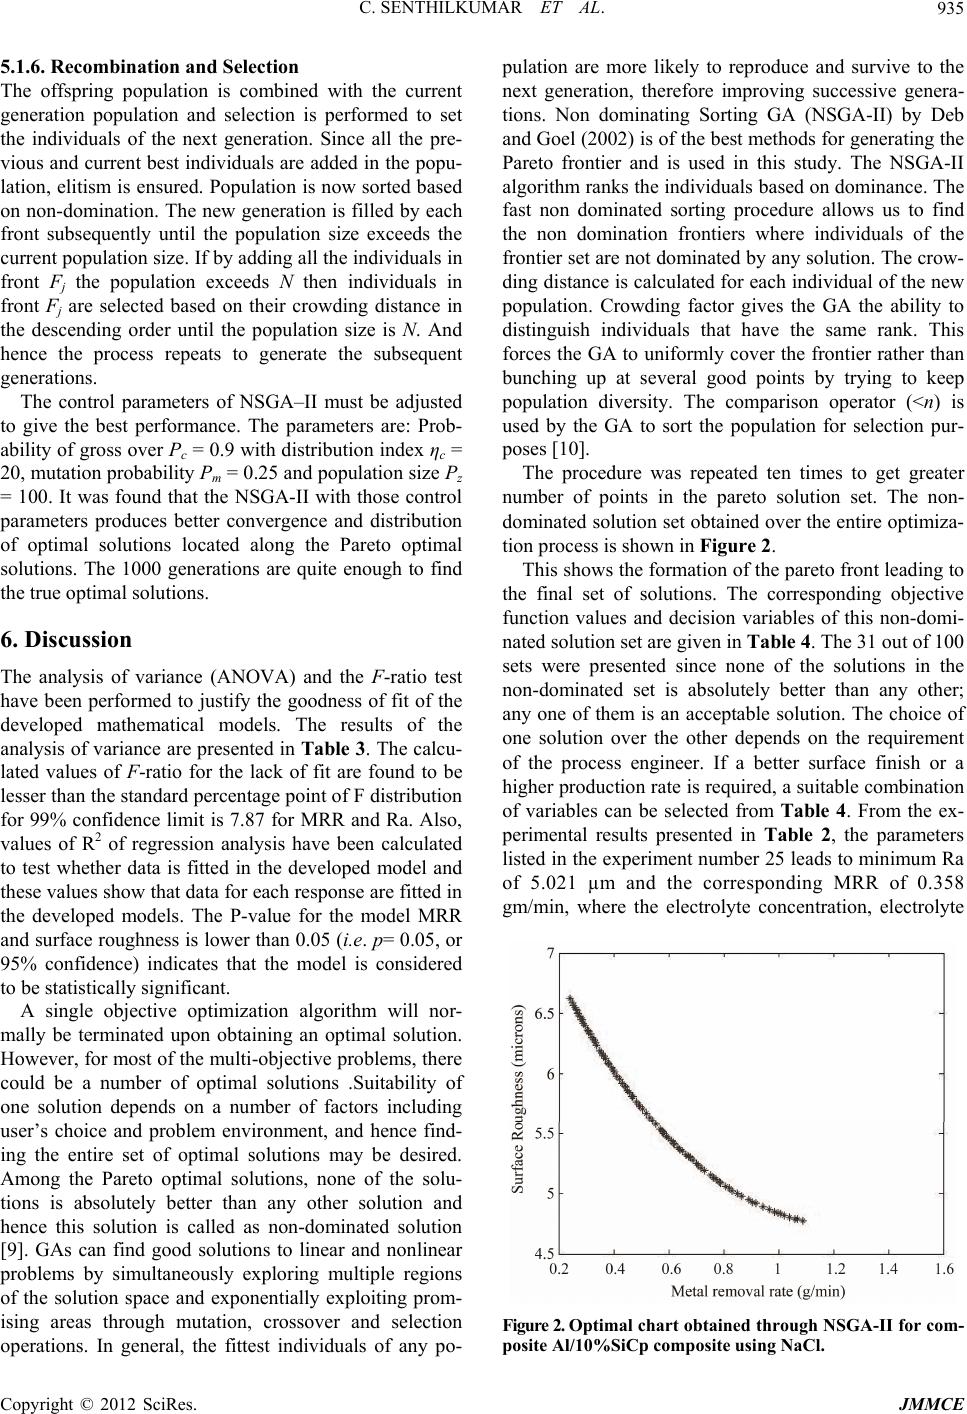 C. SENTHILKUMAR ET AL. 935 5.1.6. Recombin ation and Selection The offspring population is combined with the current erformed to set est performance. The parameters are: Prob- ab ariance (ANOVA) and the F-ratio test ed to justify the goodness of fit of the aining an optimal solution. H points in the pareto solution set. The non- do rresponding objective fu generation population and selection is p the individuals of the next generation. Since all the pre- vious and current best individuals are added in the popu- lation, elitism is ensured. Population is now sorted based on non-domination. The new generation is filled by each front subsequently until the population size exceeds the current population size. If by adding all the individuals in front Fj the population exceeds N then individuals in front Fj are selected based on their crowding distance in the descending order until the population size is N. And hence the process repeats to generate the subsequent generations. The control parameters of NSGA–II must be adjusted to give the b ility of gross over Pc = 0.9 with distribution index ηc = 20, mutation probability Pm = 0.25 and population size Pz = 100. It was found that the NSGA-II with those control parameters produces better convergence and distribution of optimal solutions located along the Pareto optimal solutions. The 1000 generations are quite enough to find the true optimal solutions. 6. Discussion The analysis of v have been perform developed mathematical models. The results of the analysis of variance are presented in Tabl e 3. The calcu- lated values of F-ratio for the lack of fit are found to be lesser than the standard percentage point of F distribution for 99% confidence limit is 7.87 for MRR and Ra. Also, values of R2 of regression analysis have been calculated to test whether data is fitted in the developed model and these values show that data for each response are fitted in the developed models. The P-value for the model MRR and surface roughness is lower than 0.05 (i.e. p= 0.05, or 95% confidence) indicates that the model is considered to be statistically significant. A single objective optimization algorithm will nor- mally be terminated upon obt owever, for most of the multi-objective problems, there could be a number of optimal solutions .Suitability of one solution depends on a number of factors including user’s choice and problem environment, and hence find- ing the entire set of optimal solutions may be desired. Among the Pareto optimal solutions, none of the solu- tions is absolutely better than any other solution and hence this solution is called as non-dominated solution [9]. GAs can find good solutions to linear and nonlinear problems by simultaneously exploring multiple regions of the solution space and exponentially exploiting prom- ising areas through mutation, crossover and selection operations. In general, the fittest individuals of any po- pulation are more likely to reproduce and survive to the next generation, therefore improving successive genera- tions. Non dominating Sorting GA (NSGA-II) by Deb and Goel (2002) is of the best methods for generating the Pareto frontier and is used in this study. The NSGA-II algorithm ranks the individuals based on dominance. The fast non dominated sorting procedure allows us to find the non domination frontiers where individuals of the frontier set are not dominated by any solution. The crow- ding distance is calculated for each individual of the new population. Crowding factor gives the GA the ability to distinguish individuals that have the same rank. This forces the GA to uniformly cover the frontier rather than bunching up at several good points by trying to keep population diversity. The comparison operator (<n) is used by the GA to sort the population for selection pur- poses [10]. The procedure was repeated ten times to get greater number of minated solution set obtained over the entire optimiza- tion process is shown in Figure 2. This shows the formation of the pareto front leading to the final set of solutions. The co nction values and decision variables of this non-domi- nated solution set are given in Table 4. The 31 out of 100 sets were presented since none of the solutions in the non-dominated set is absolutely better than any other; any one of them is an acceptable solution. The choice of one solution over the other depends on the requirement of the process engineer. If a better surface finish or a higher production rate is required, a suitable combination of variables can be selected from Table 4. From the ex- perimental results presented in Table 2, the parameters listed in the experiment number 25 leads to minimum Ra of 5.021 µm and the corresponding MRR of 0.358 gm/min, where the electrolyte concentration, electrolyte Figure 2. Optimal chart obtained through NSGA-II for com- posite Al/10%SiCp composite using NaCl. Copyright © 2012 SciRes. JMMCE 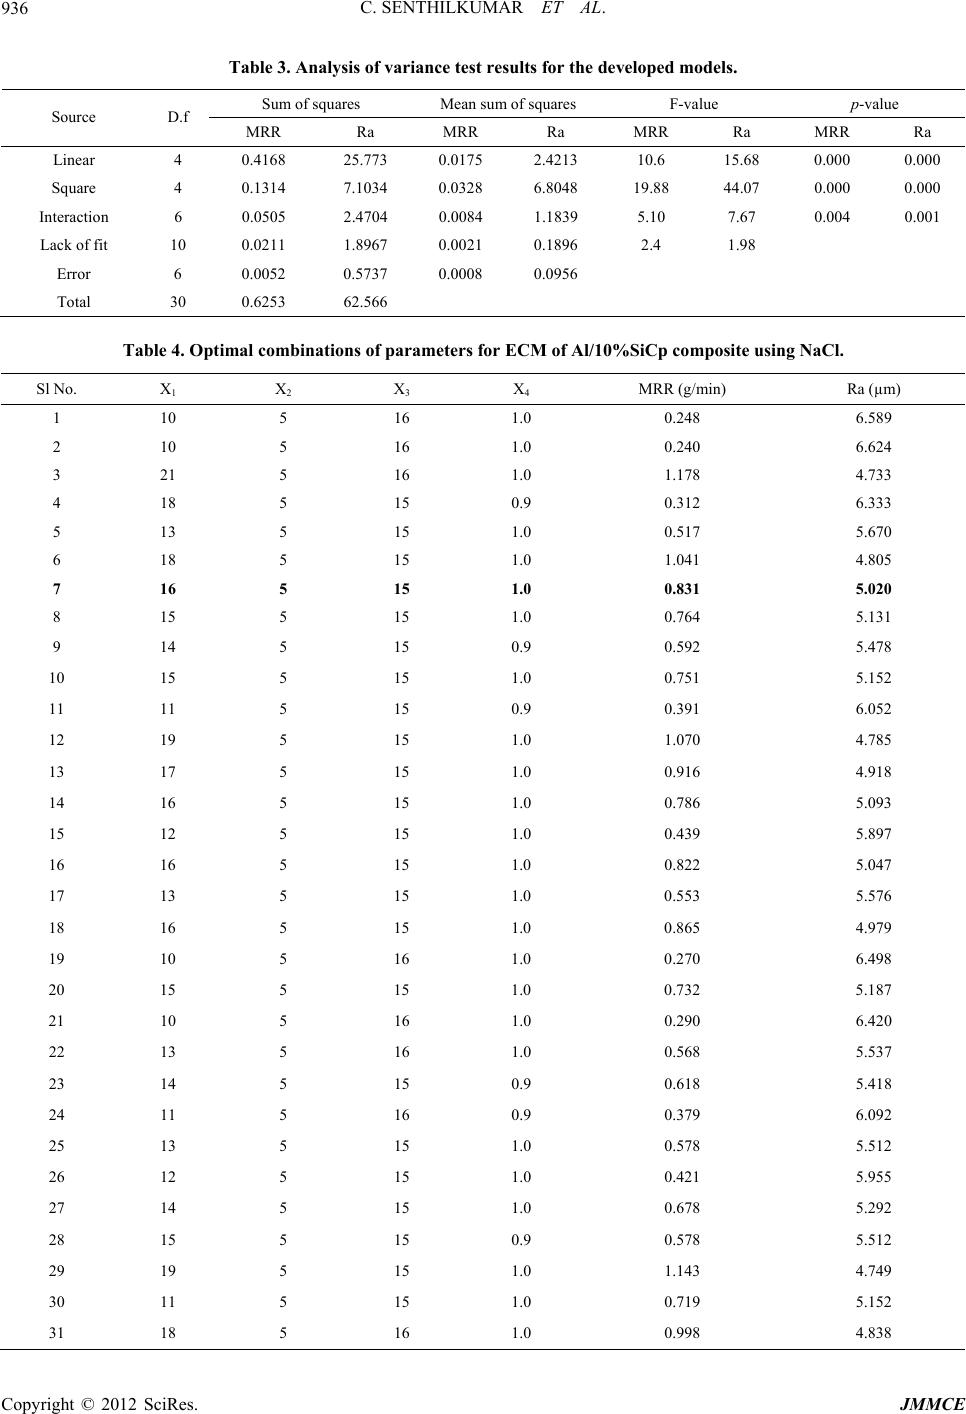 C. SENTHILKUMAR ET AL. Copyright © 2012 SciRes. JMMCE 936 t results for the developed models. p-value Table 3. Analysis of variance tes Sum of squares Mean sum of squares F-value Source D.f MRR Ra MRR Ra MRR Ra MRR Ra Linear 4 0.473 10.668 0.000000 168 25.70.0175 2.4213 15. 0. Square 4 7. 6 4 0 In Lt 0.1314 1034 0.0328 .804819.88 4.070.000 .000 teraction6 0.0505 2.4704 0.0084 1.1839 5.10 7.67 0.004 0.001 ack of fi10 0.0211 1.8967 0.0021 0.1896 2.4 1.98 Error 6 0.0052 0.5737 0.0008 0.0956 Total 30 0.6253 62.566 Tableptiminatioarameters for ECM Al/10%Si composite using NaCl. Sl No. m) 4. Oal combns of pofCp X1 X 2 X 3 X 4 MRR (g/min) Ra (µ 1 10 6.589 5 16 1.0 0.248 2 10 5 16 1.0 0.240 6.624 3 21 5 16 1.0 1.178 4.733 4 18 5 15 0.9 0.312 6.333 5 13 5 15 1.0 0.517 5.670 6 18 5 15 1.0 1.041 4.805 7 16 5 15 1.0 0.831 5.020 8 15 5 15 1.0 0.764 5.131 9 14 5 15 0.9 0.592 5.478 10 15 5 15 1.0 0.751 5.152 11 11 5 15 0.9 0.391 6.052 12 19 5 15 1.0 1.070 4.785 13 17 5 15 1.0 0.916 4.918 14 16 5 15 1.0 0.786 5.093 15 12 5 15 1.0 0.439 5.897 16 16 5 15 1.0 0.822 5.047 17 13 5 15 1.0 0.553 5.576 18 16 5 15 1.0 0.865 4.979 19 10 5 16 1.0 0.270 6.498 20 15 5 15 1.0 0.732 5.187 21 10 5 16 1.0 0.290 6.420 22 13 5 16 1.0 0.568 5.537 23 14 5 15 0.9 0.618 5.418 24 11 5 16 0.9 0.379 6.092 25 13 5 15 1.0 0.578 5.512 26 12 5 15 1.0 0.421 5.955 27 14 5 15 1.0 0.678 5.292 28 15 5 15 0.9 0.578 5.512 29 19 5 15 1.0 1.143 4.749 30 11 5 15 1.0 0.719 5.152 31 18 5 16 1.0 0.998 4.838 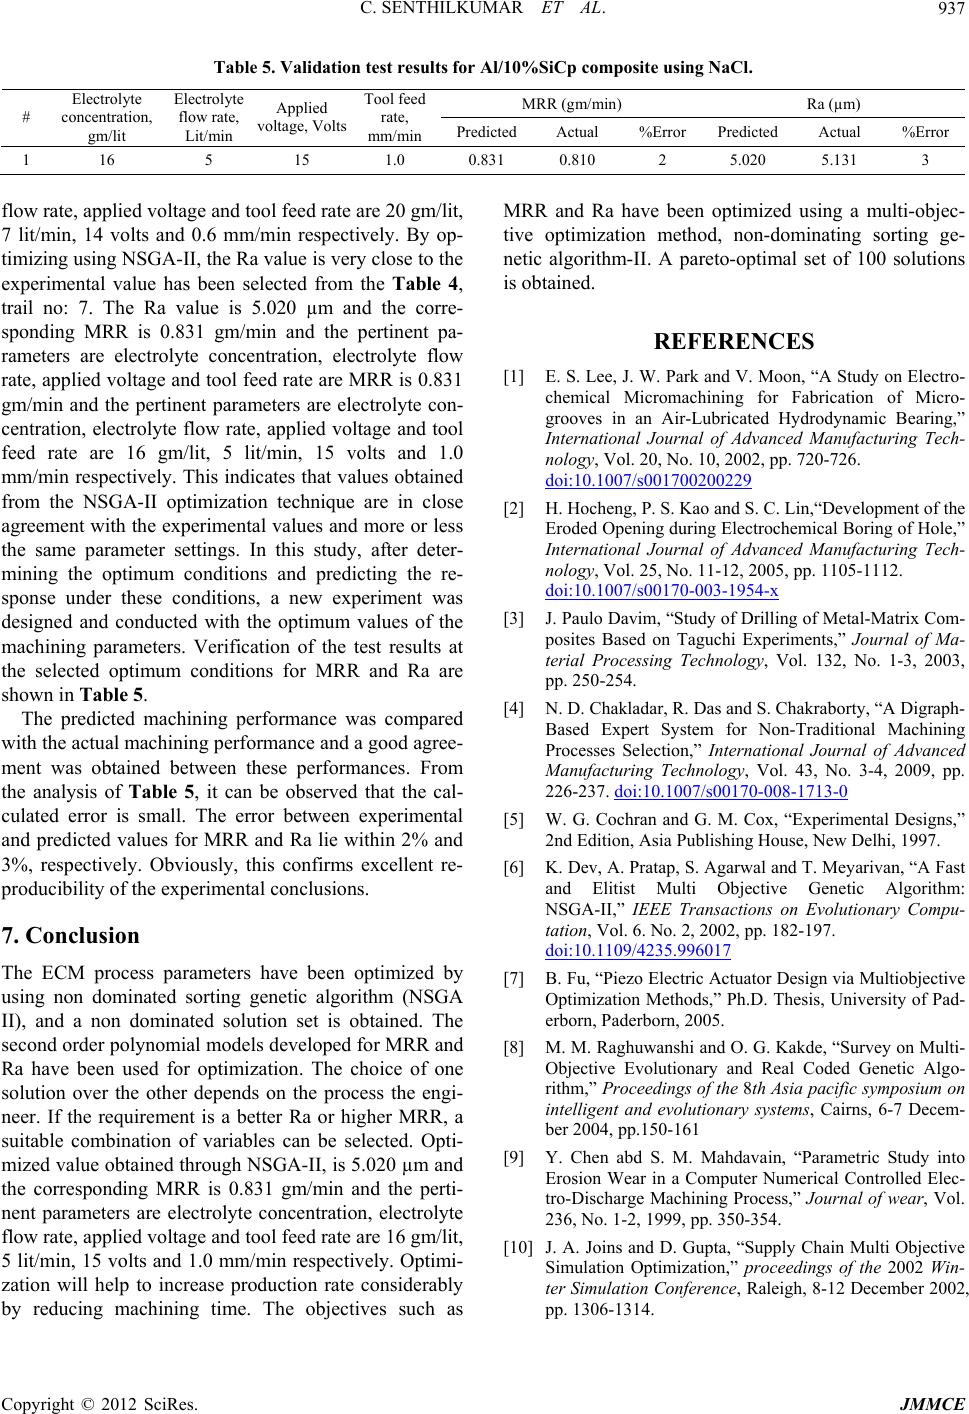 C. SENTHILKUMAR ET AL. 937 Table 5.lidation tesults for Al/1SiCp compositeNaCl. R (gm/min) Ra (µm Vat res0% using MR) # yte concentration, gm/lit ectrolyte flow rate, Lit/ plied Tool feed rate, ed Actual %Error Electrol El min voltage, Volts mm/min PredictedActual %ErrorPredict Ap 1 16 15 0.831 0.810 2 5.020 5.131 3 5 1.0 flow rate, d volt ta/li 7 lit/min, 1lts and 0minpectively. By op- mizing using NSGA-II, the Ra value is very close to the etween these performances. From th imized by ted sorting genetic algorithm (NSGA inated solution set is obtained. The RR ha usul- ve oation thod,ominsortinge- netic algorithm-II. A pareto-optimal set of 100 solutions in an Air-Lubricated Hydrodynamic Bearing,” International Journal of Advanced Manufacturing Tech- nology, Vol. 2726. doi:10.1007/s0 applieage andool feed rate re 20 gmt, M 4 vo.6 mm/ res ti experimental value has been selected from the Table 4, trail no: 7. The Ra value is 5.020 µm and the corre- sponding MRR is 0.831 gm/min and the pertinent pa- rameters are electrolyte concentration, electrolyte flow rate, applied voltage and tool feed rate are MRR is 0.831 gm/min and the pertinent parameters are electrolyte con- centration, electrolyte flow rate, applied voltage and tool feed rate are 16 gm/lit, 5 lit/min, 15 volts and 1.0 mm/min respectively. This indicates that values obtained from the NSGA-II optimization technique are in close agreement with the experimental values and more or less the same parameter settings. In this study, after deter- mining the optimum conditions and predicting the re- sponse under these conditions, a new experiment was designed and conducted with the optimum values of the machining parameters. Verification of the test results at the selected optimum conditions for MRR and Ra are shown in Table 5. The predicted machining performance was compared with the actual machining performance and a good agree- ment was obtained b e analysis of Table 5, it can be observed that the cal- culated error is small. The error between experimental and predicted values for MRR and Ra lie within 2% and 3%, respectively. Obviously, this confirms excellent re- producibility of the experimental conclusions. 7. Conclusion The ECM process parameters have been opt using non domina II), and a non dom second order polynomial models developed for MRR and Ra have been used for optimization. The choice of one solution over the other depends on the process the engi- neer. If the requirement is a better Ra or higher MRR, a suitable combination of variables can be selected. Opti- mized value obtained through NSGA-II, is 5.020 µm and the corresponding MRR is 0.831 gm/min and the perti- nent parameters are electrolyte concentration, electrolyte flow rate, applied voltage and tool feed rate are 16 gm/lit, 5 lit/min, 15 volts and 1.0 mm/min respectively. Optimi- zation will help to increase production rate considerably by reducing machining time. The objectives such as is obtained. REFERENCES [1] E. S. Lee, J. W. Park and V. Moon, “A Study on Electro- chemical Micromachining for Fabrication of Micro- grooves and Rave been optimizeding a mti-objec tiptimizme non-dating g 0, No. 10, 2002, pp. 720- 01700200229 [2] H. Hocheng, P. S. Kao and S. C. Lin,“Development of the Eroded Opening during Electrochemical Boring of Hole,” International Journal of Advanced Manufacturing Tech- nology, Vol. 25, No. 11-12, 2005, pp. 1105-1112. doi:10.1007/s00170-003-1954-x [3] J. Paulo Davim, “Study of Drilling of Metal-Matrix Com- posites Based on Taguchi Experiments,” Journal of Ma- terial Processing Technology, Vol. 132, No. 1-3, 2003, pp. 250-254. [4] N. D. Chakladar, R. Das and S. Chakraborty, “A Digraph- Based Expert System for Non-Traditional Machining Processes Selection,” International Journal of Advanced Manufacturing Technology, Vol. 43, No. 3-4, 2009, pp. 226-237. doi:10.1007/s00170-008-1713-0 [5] W. G. Cochran and G. M. Cox, “Experimental Designs,” 2nd Edition, Asia Publishing House, New Delhi, 1997. [6] K. Dev, A. Pratap, S. Agarwal and T. Meyarivan, “A Fast and Elitist Multi Objective Genetic Algorithm: NSGA-II,” IEEE Transactions on Evolutionary Compu- tation, Vol. 6. No. 2, 2002, pp. 182-197. doi:10.1109/4235.996017 [7] B. Fu, “Piezo Electric Actuator Design via Multiobjective Optimization Methods,” Ph.D. Thesis, University of Pad- erborn, Paderborn, 2005. [8] M. M. Raghuwanshi and O. G. Kakde, “Survey on Multi- Objective Evolutionary and Real Coded Genetic Algo- rithm,” Proceedings of the 8th Asia pacific symposium on intelligent and evolutionary systems, Cairns, 6-7 Decem- ber 2004, pp.150-161 [9] Y. Chen abd S. M. Mahdavain, “Parametric Study into Erosion Wear in a Computer Numerical Controlled Elec- tro-Discharge Machining Process,” Journal of wear, Vol. 236, No. 1-2, 1999, pp. 350-354. [10] J. A. Joins and D. Gupta, “Supply Chain Multi Objective Simulation Optimization,” proceedings of the 2002 Win- ter Simulation Conference, Raleigh, 8-12 December 2002, pp. 1306-1314. Copyright © 2012 SciRes. JMMCE |